| Param | Original file | Final file |
|---|---|---|
| Filename | modeM0/AS1G04_003T02_9000000228cztM0_level2.fits | modeM0/AS1G04_003T02_9000000228cztM0_level2_quad_clean.evt |
| Size (bytes) | 111,709,440 | 150,168,960 |
| Size | 106.5 MB | 143.2 MB |
| Events in quadrant A | 653,966 | 962,327 |
| Events in quadrant B | 649,872 | 972,606 |
| Events in quadrant C | 644,470 | 935,016 |
| Events in quadrant D | 489,422 | 733,288 |
| Mode M0 | |||
|---|---|---|---|
| Quadrant | BADHDUFLAG | Total packets | Discarded packets |
| A | 0 | 55723 | 0 |
| B | 0 | 61428 | 0 |
| C | 0 | 57561 | 0 |
| D | 0 | 99110 | 0 |
| Mode SS | |||
|---|---|---|---|
| Quadrant | BADHDUFLAG | Total packets | Discarded packets |
| A | 0 | 282 | 0 |
| B | 0 | 282 | 0 |
| C | 0 | 282 | 0 |
| D | 0 | 282 | 0 |
| Mode M9 | |||
|---|---|---|---|
| Quadrant | BADHDUFLAG | Total packets | Discarded packets |
| A | 0 | 32 | 0 |
| B | 0 | 32 | 0 |
| C | 0 | 32 | 0 |
| D | 0 | 32 | 0 |
| Quadrant | Total seconds | Saturated seconds | Saturation percentage |
|---|---|---|---|
| A | 13661 | 5 | 0.036601% |
| B | 13661 | 82 | 0.600249% |
| C | 13661 | 36 | 0.263524% |
| D | 13661 | 2850 | 20.862309% |
Noise dominated data is calculated using 1-second bins in cleaned event files. If a bin has >2000 counts, and if more than 50% of those come from <1% of pixels, then it is considered to be noise-dominated and hence unusable.
| Quadrant | # 1 sec bins | Bins with >0 counts | Bins with >2000 counts | High rate bins dominated by noise | Noise dominated (total time) | Noise dominated (detector-on time) | Marked lightcurve |
|---|---|---|---|---|---|---|---|
| A | 16966 | 13659 | 0 | 0 | 0.00% | 0.00% | 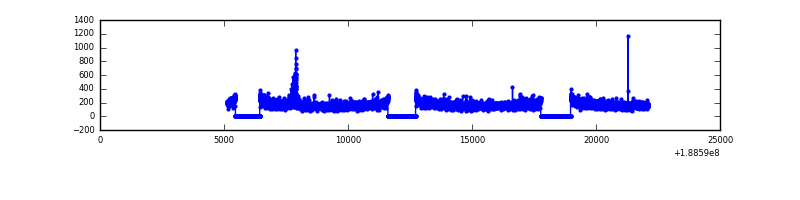 |
| B | 16965 | 13659 | 0 | 0 | 0.00% | 0.00% |  |
| C | 16966 | 13658 | 0 | 0 | 0.00% | 0.00% |  |
| D | 16965 | 13645 | 0 | 0 | 0.00% | 0.00% | 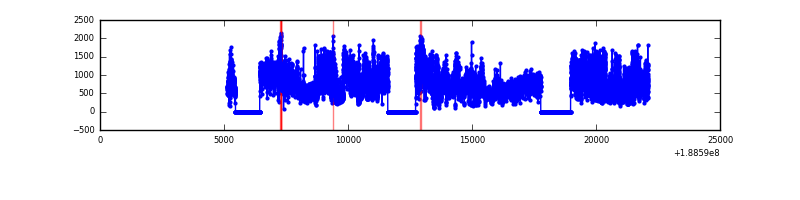 |
Top three noisy pixels from each quadrant. If the there are fewer than three noisy pixels in the level2.evt file, extra rows are filled as -1
| Pixel properties | Quadrant properties | ||||||
|---|---|---|---|---|---|---|---|
| Quadrant | DetID | PixID | Counts | Sigma | Mean | Median | Sigma |
| A | 0 | 29 | 582 | 10.47 | 169 | 160 | 40.3 |
| A | 7 | 110 | 555 | 9.8 | 169 | 160 | 40.3 |
| A | 14 | 188 | 516 | 8.84 | 169 | 160 | 40.3 |
| B | 2 | 9 | 527 | 10.97 | 171 | 164 | 33.1 |
| B | 5 | 128 | 450 | 8.64 | 171 | 164 | 33.1 |
| B | 14 | 254 | 428 | 7.98 | 171 | 164 | 33.1 |
| C | 9 | 242 | 440 | 6.61 | 170 | 158 | 42.6 |
| C | 2 | 127 | 437 | 6.54 | 170 | 158 | 42.6 |
| C | 12 | 241 | 427 | 6.31 | 170 | 158 | 42.6 |
| D | 11 | 82 | 422 | 8.38 | 139 | 128 | 35.1 |
| D | 6 | 231 | 381 | 7.21 | 139 | 128 | 35.1 |
| D | 3 | 14 | 375 | 7.04 | 139 | 128 | 35.1 |
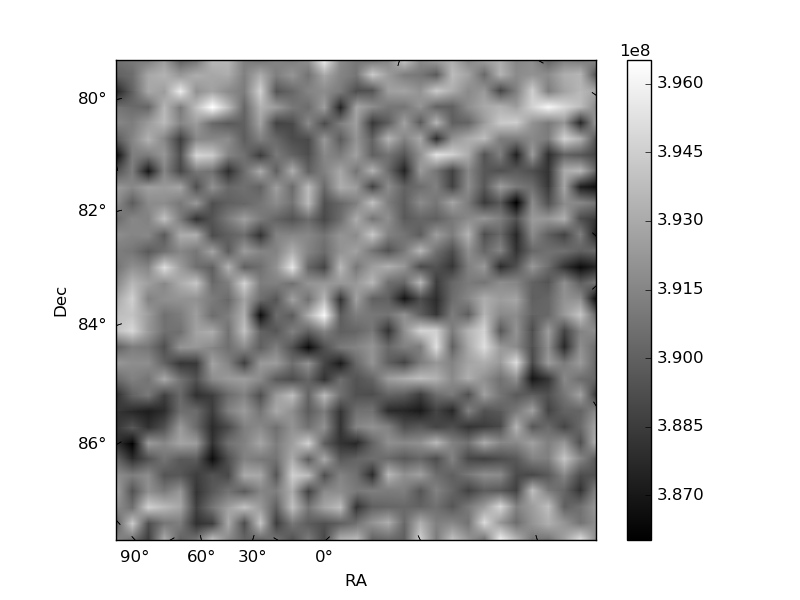
Histogram calculated using DETX and DETY for each event in the final _common_clean file
| Quadrant A | 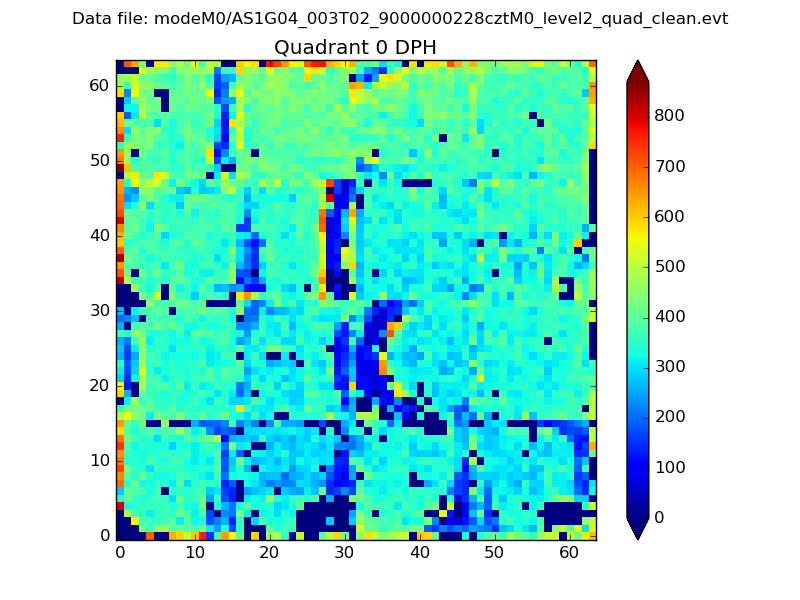 |
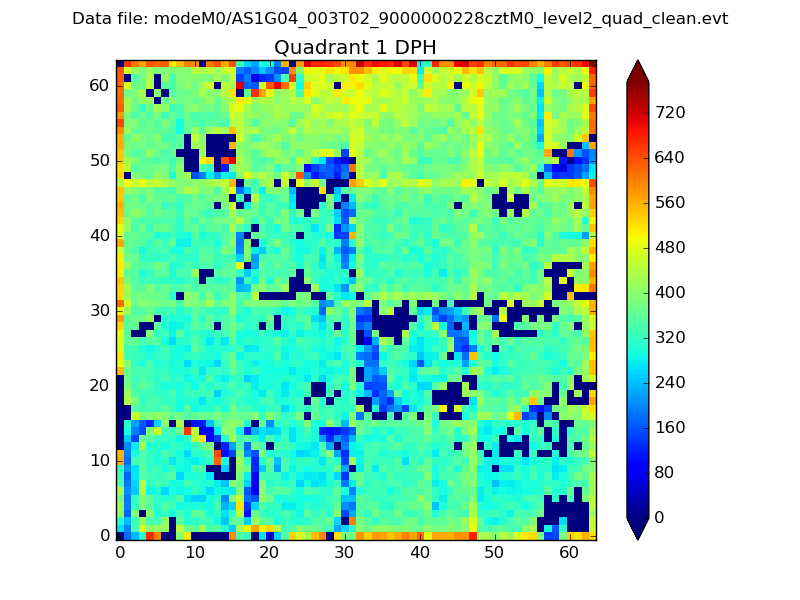 |
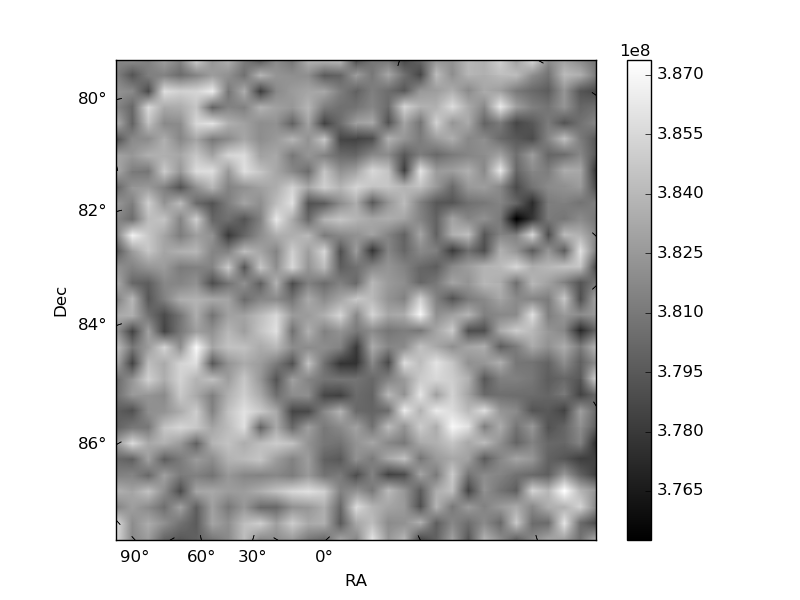
Quadrant B |
|---|---|---|---|
| Quadrant D |  |
 |
Quadrant C |
| Plot type | Count rate plots | Images |
|---|---|---|
| Comparison with Poisson distribution Blue bars denote a histogram of data divided into 1 sec bins. Red curve is a Poisson curve with rate = median count rate of data. |
 |
 |
| Quadrant-wise count rates Data is divided into 100 sec bins |
 |
|
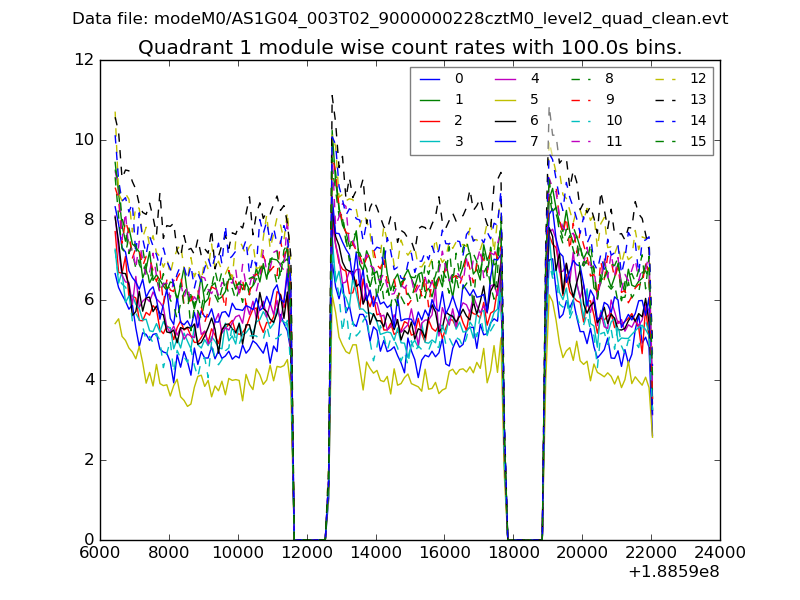
| Module-wise count rates for Quadrant A Data is divided into 100 sec bins |
 |
 |
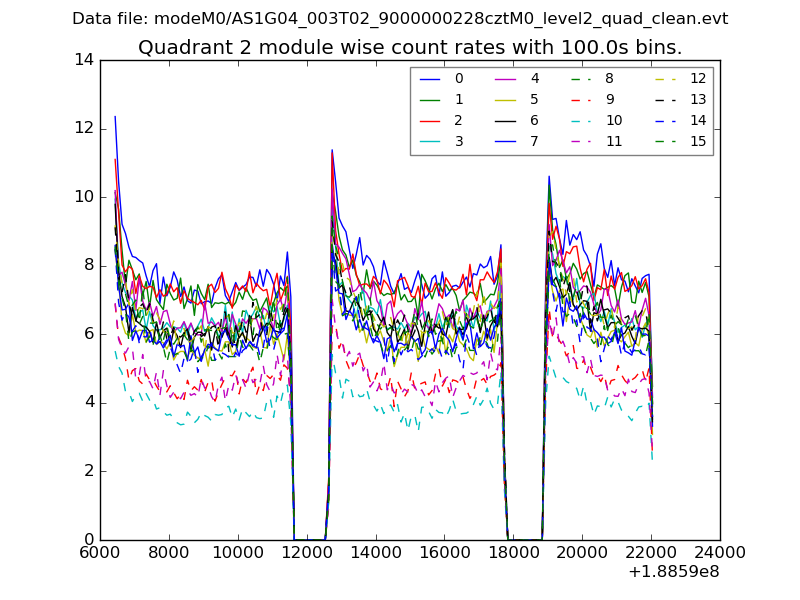
| Module-wise count rates for Quadrant B Data is divided into 100 sec bins |
 |
 |
| Module-wise count rates for Quadrant C Data is divided into 100 sec bins |
 |
 |
| Module-wise count rates for Quadrant D Data is divided into 100 sec bins |
 |
 |
| Parameter | Plot |
|---|---|
| CZT HV Monitor |  |
| D_VDD | 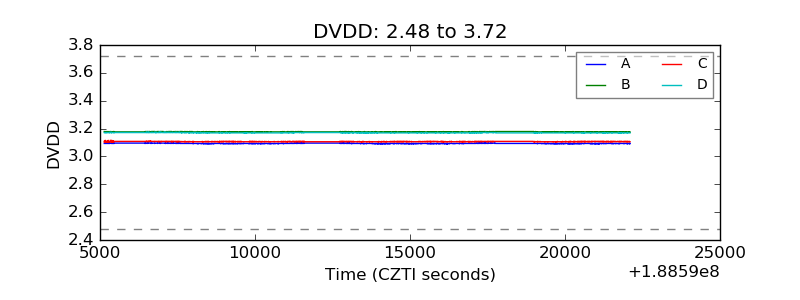 |
| Temperature 1 | 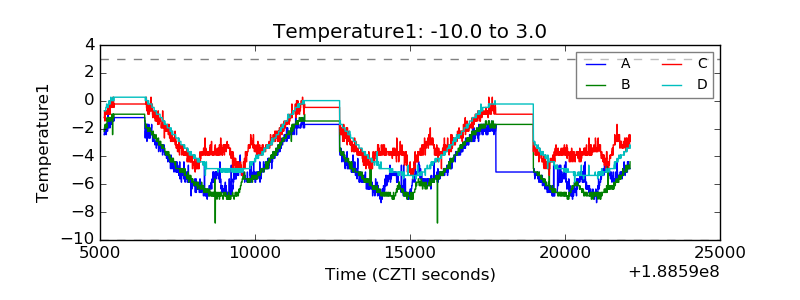 |
| Veto HV Monitor | 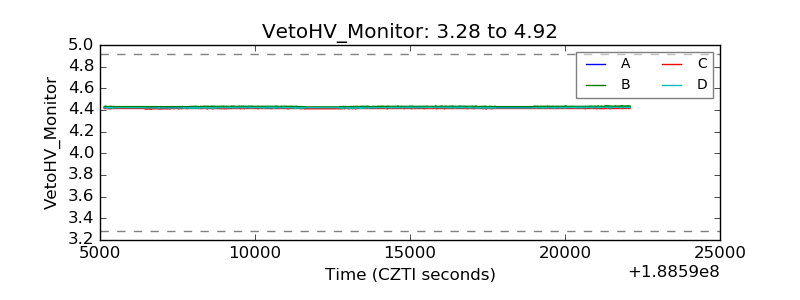 |
| Veto LLD |  |
| Alpha Counter |  |
| _CPM_Rate |  |
| CZT Counter |  |
| +2.5 Volts monitor |  |
| +5 Volts monitor |  |
| _ROLL_ROT |  |
| _Roll_DEC | 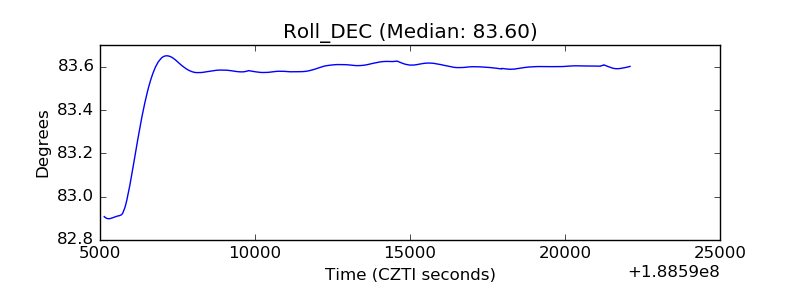 |
| _Roll_RA |  |
| Veto Counter |  |