| Param | Original file | Final file |
|---|---|---|
| Filename | modeM0/AS1G04_003T02_9000000228_01283cztM0_level2.evt | modeM0/AS1G04_003T02_9000000228_01283cztM0_level2_quad_clean.evt |
| Size (bytes) | 385,905,600 | 25,058,880 |
| Size | 368.0 MB | 23.9 MB |
| Events in quadrant A | 2,147,185 | 171,267 |
| Events in quadrant B | 2,491,184 | 165,197 |
| Events in quadrant C | 2,445,187 | 162,950 |
| Events in quadrant D | 4,492,685 | 136,884 |
| Mode M0 | |||
|---|---|---|---|
| Quadrant | BADHDUFLAG | Total packets | Discarded packets |
| A | 0 | 7541 | 2 |
| B | 0 | 8554 | 1 |
| C | 0 | 8402 | 1 |
| D | 0 | 14574 | 1 |
| Mode SS | |||
|---|---|---|---|
| Quadrant | BADHDUFLAG | Total packets | Discarded packets |
| A | 0 | 38 | 0 |
| B | 0 | 38 | 0 |
| C | 0 | 38 | 0 |
| D | 0 | 38 | 0 |
| Mode M9 | |||
|---|---|---|---|
| Quadrant | BADHDUFLAG | Total packets | Discarded packets |
| A | 0 | 9 | 0 |
| B | 0 | 9 | 0 |
| C | 0 | 9 | 0 |
| D | 0 | 9 | 0 |
| Quadrant | Total seconds | Saturated seconds | Saturation percentage |
|---|---|---|---|
| A | 1644 | 3 | 0.182482% |
| B | 1644 | 30 | 1.824818% |
| C | 1644 | 15 | 0.912409% |
| D | 1644 | 678 | 41.240876% |
Noise dominated data is calculated using 1-second bins in cleaned event files. If a bin has >2000 counts, and if more than 50% of those come from <1% of pixels, then it is considered to be noise-dominated and hence unusable.
| Quadrant | # 1 sec bins | Bins with >0 counts | Bins with >2000 counts | High rate bins dominated by noise | Noise dominated (total time) | Noise dominated (detector-on time) | Marked lightcurve |
|---|---|---|---|---|---|---|---|
| A | 2624 | 1645 | 71 | 71 | 2.71% | 4.32% | 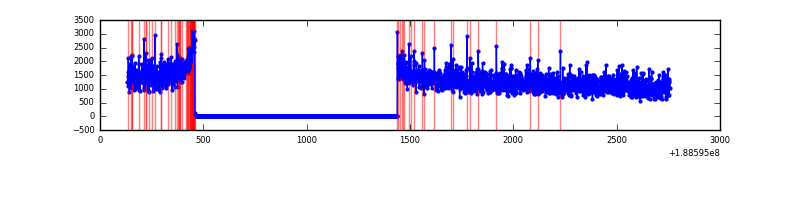 |
| B | 2624 | 1645 | 240 | 240 | 9.15% | 14.59% | 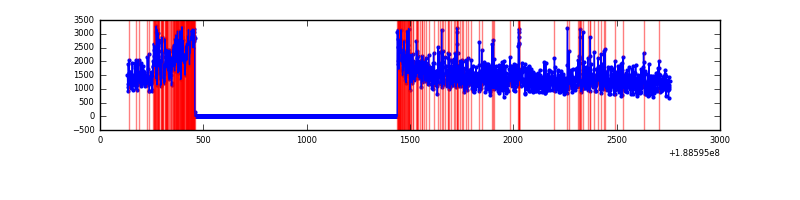 |
| C | 2624 | 1644 | 144 | 144 | 5.49% | 8.76% | 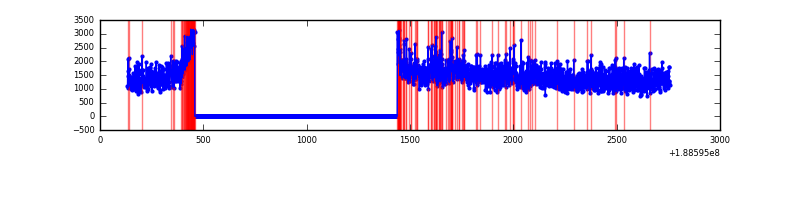 |
| D | 2624 | 1644 | 1522 | 1522 | 58.00% | 92.58% | 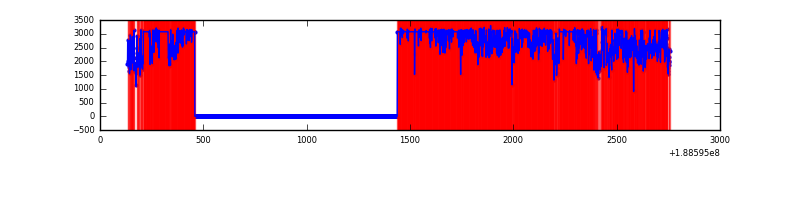 |
Top three noisy pixels from each quadrant. If the there are fewer than three noisy pixels in the level2.evt file, extra rows are filled as -1
| Pixel properties | Quadrant properties | ||||||
|---|---|---|---|---|---|---|---|
| Quadrant | DetID | PixID | Counts | Sigma | Mean | Median | Sigma |
| A | 12 | 243 | 6993 | 47.43 | 556 | 557 | 135.7 |
| A | 10 | 2 | 2537 | 14.59 | 556 | 557 | 135.7 |
| A | 13 | 9 | 2408 | 13.64 | 556 | 557 | 135.7 |
| B | 8 | 4 | 134872 | 973.9 | 580 | 580 | 137.9 |
| B | 6 | 53 | 103248 | 744.56 | 580 | 580 | 137.9 |
| B | 15 | 22 | 15512 | 108.29 | 580 | 580 | 137.9 |
| C | 8 | 208 | 130663 | 819.98 | 561 | 584 | 158.6 |
| C | 15 | 241 | 83071 | 519.98 | 561 | 584 | 158.6 |
| C | 10 | 207 | 18176 | 110.9 | 561 | 584 | 158.6 |
| D | 13 | 169 | 1950055 | 12837.12 | 488 | 504 | 151.9 |
| D | 10 | 84 | 302002 | 1985.26 | 488 | 504 | 151.9 |
| D | 13 | 70 | 183237 | 1203.23 | 488 | 504 | 151.9 |
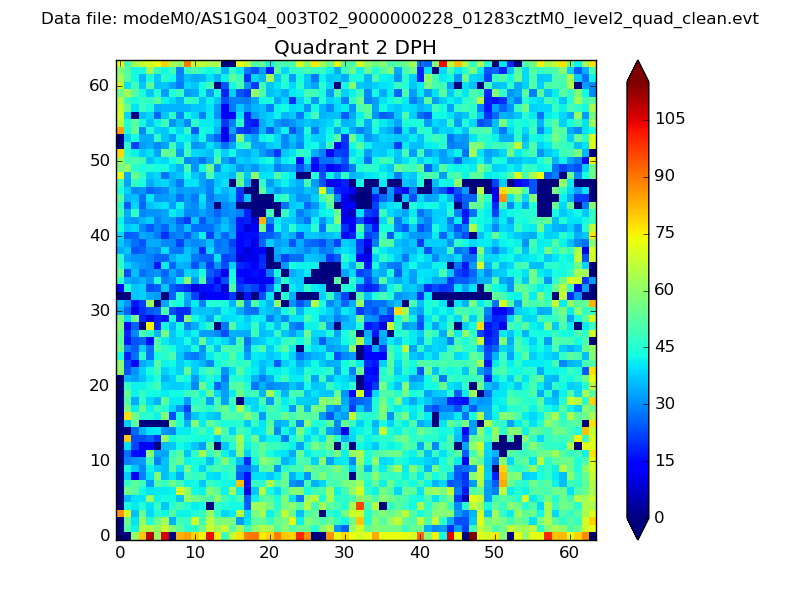
Histogram calculated using DETX and DETY for each event in the final _common_clean file
| Quadrant A | 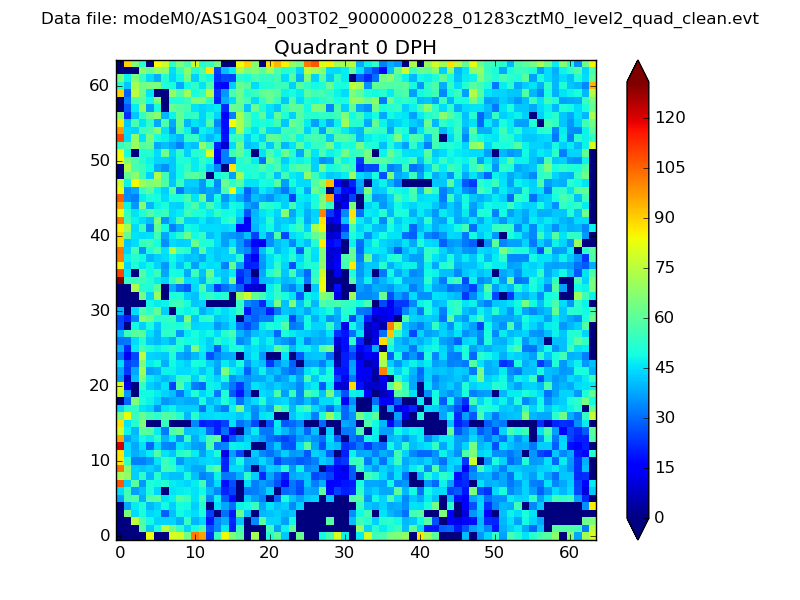 |
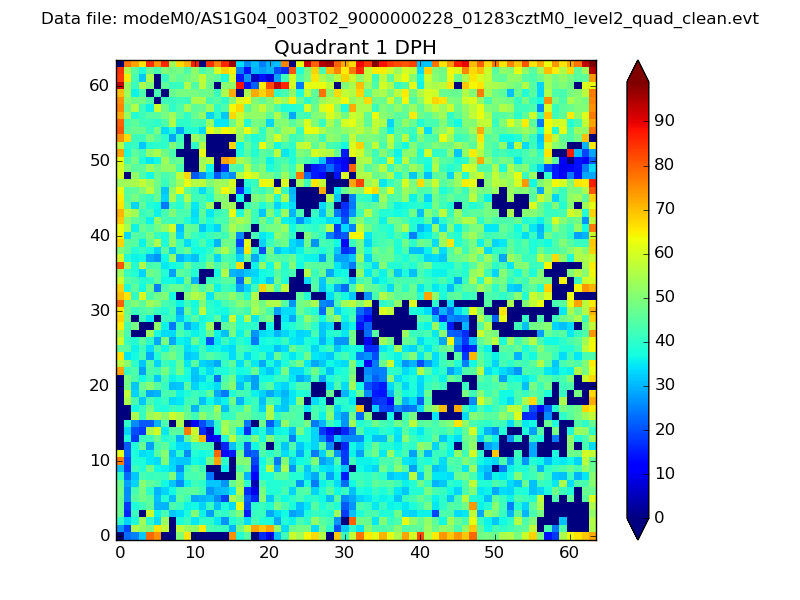 |
Quadrant B |
|---|---|---|---|
| Quadrant D | 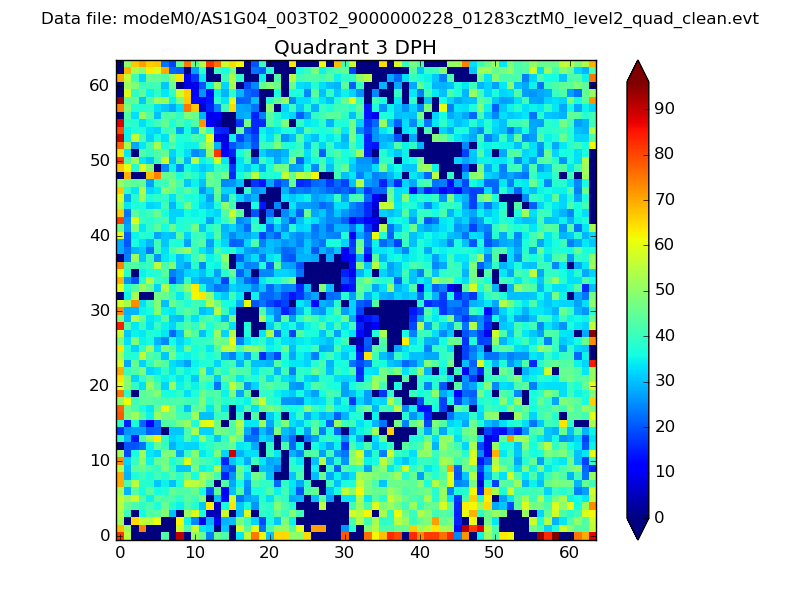 |
 |
Quadrant C |
| Plot type | Count rate plots | Images |
|---|---|---|
| Comparison with Poisson distribution Blue bars denote a histogram of data divided into 1 sec bins. Red curve is a Poisson curve with rate = median count rate of data. |
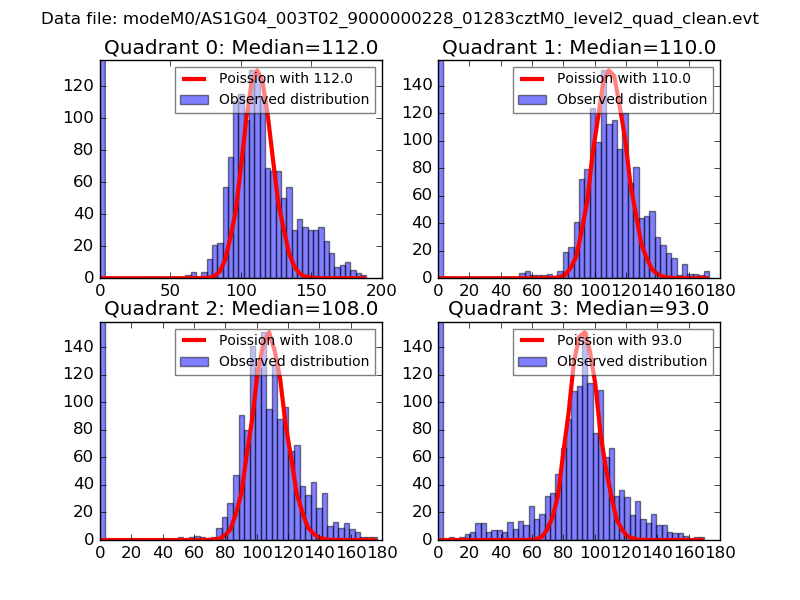 |
 |
| Quadrant-wise count rates Data is divided into 100 sec bins |
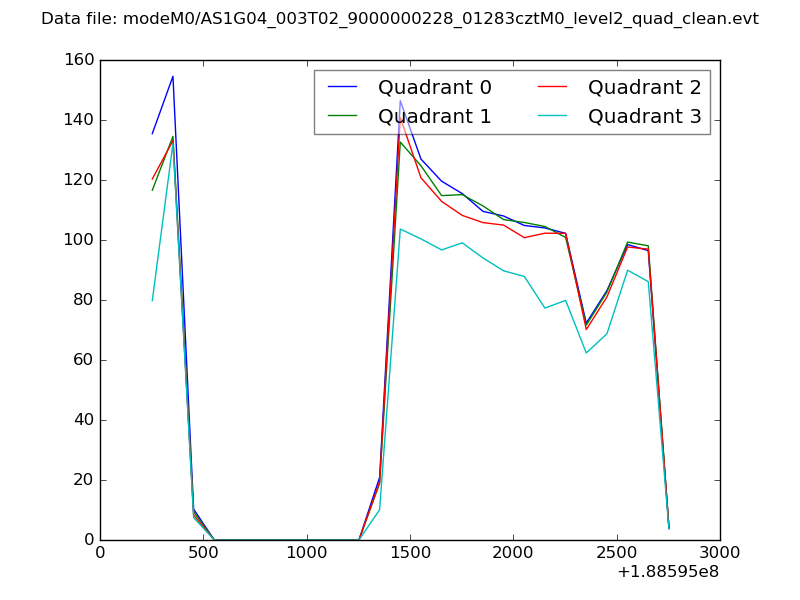 |
|
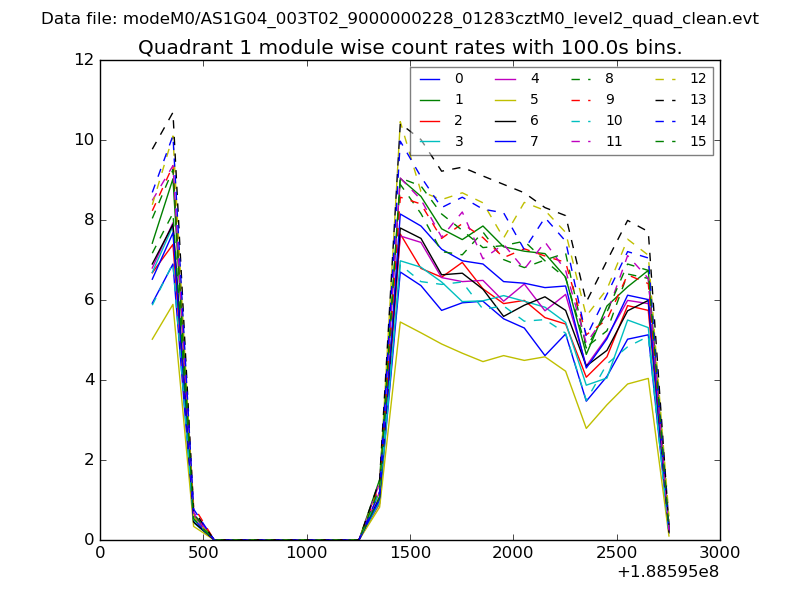
| Module-wise count rates for Quadrant A Data is divided into 100 sec bins |
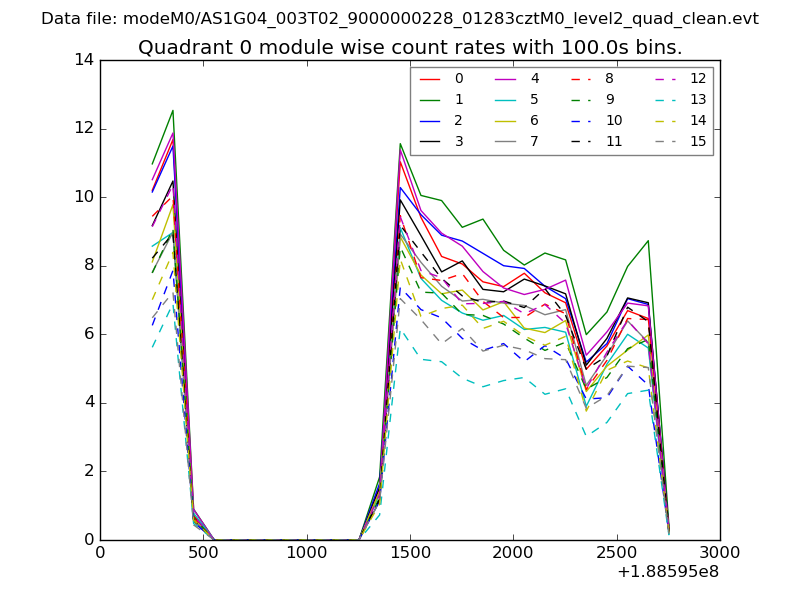 |
 |
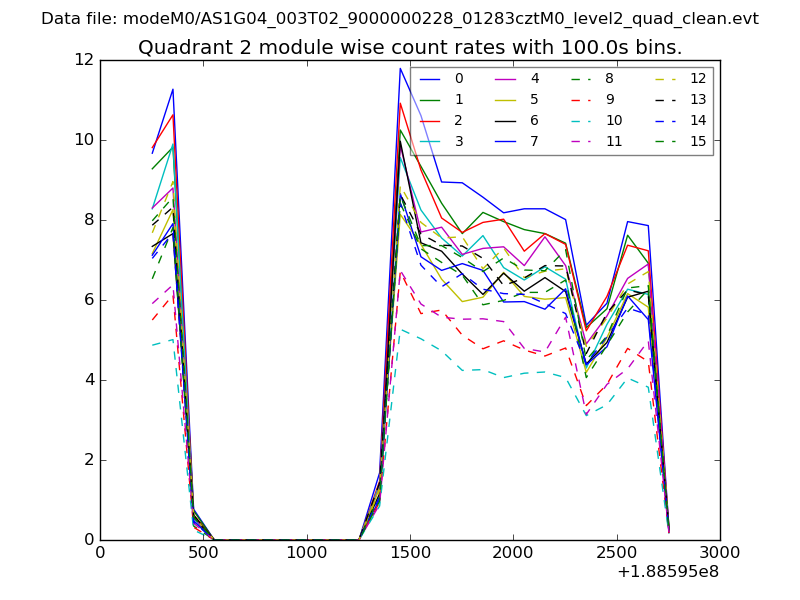
| Module-wise count rates for Quadrant B Data is divided into 100 sec bins |
 |
 |
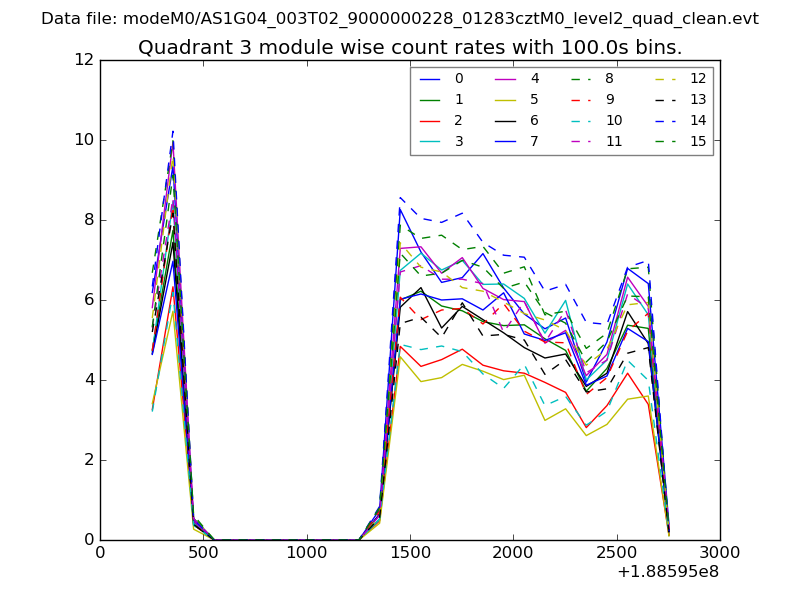
| Module-wise count rates for Quadrant C Data is divided into 100 sec bins |
 |
 |
| Module-wise count rates for Quadrant D Data is divided into 100 sec bins |
 |
 |
| Parameter | Plot |
|---|---|
| CZT HV Monitor | 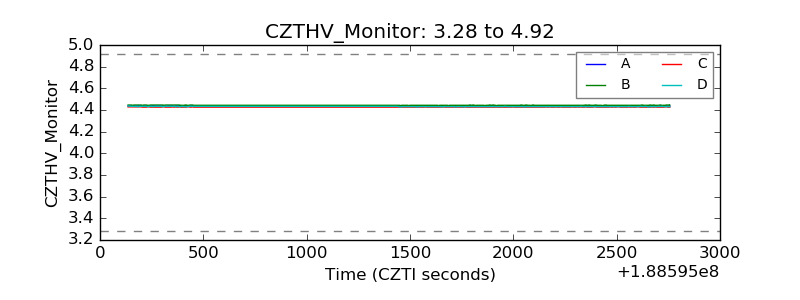 |
| D_VDD |  |
| Temperature 1 | 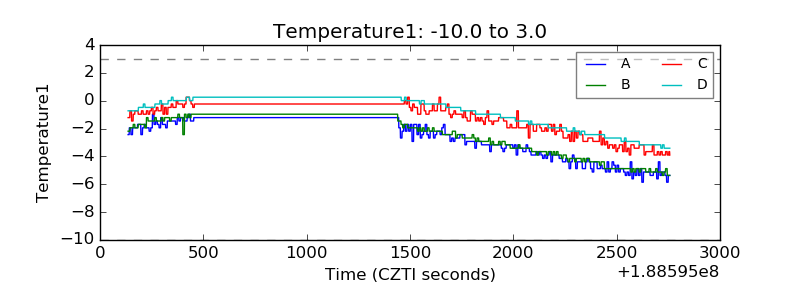 |
| Veto HV Monitor | 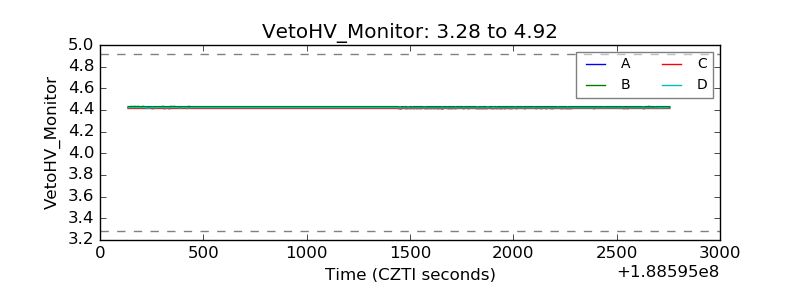 |
| Veto LLD | 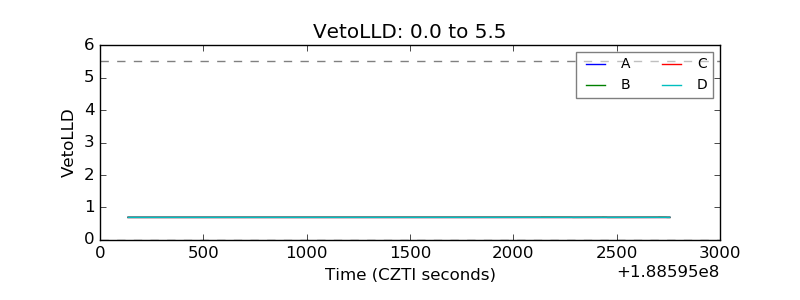 |
| Alpha Counter | 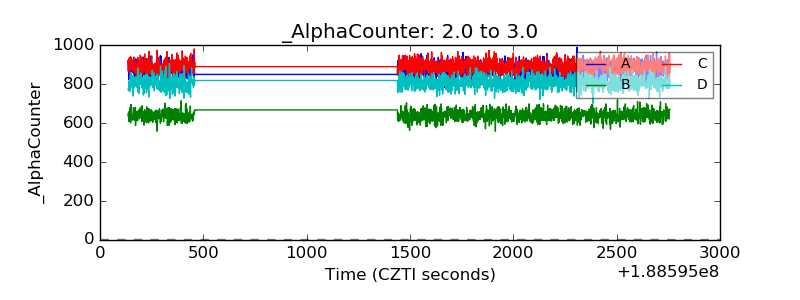 |
| _CPM_Rate | 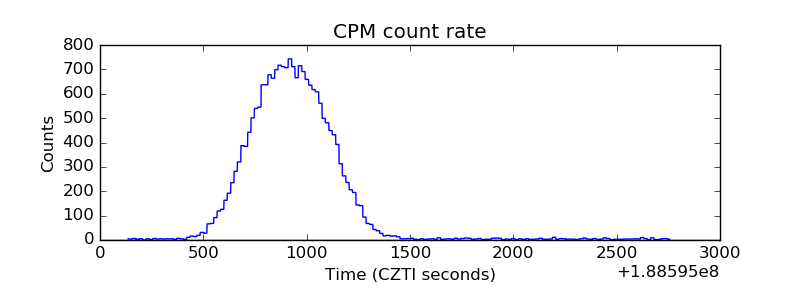 |
| CZT Counter | 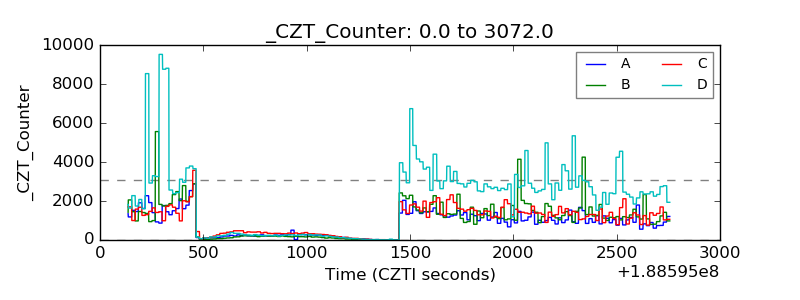 |
| +2.5 Volts monitor |  |
| +5 Volts monitor |  |
| _ROLL_ROT | 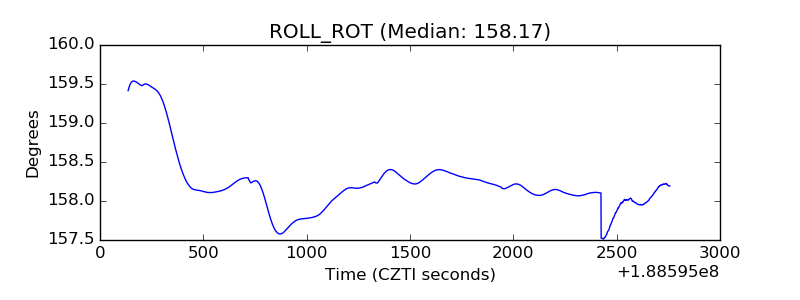 |
| _Roll_DEC | 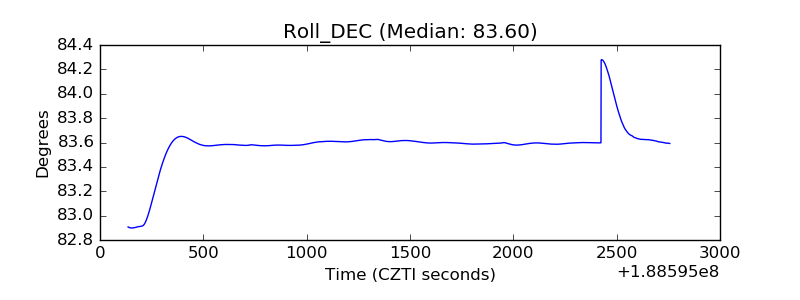 |
| _Roll_RA |  |
| Veto Counter | 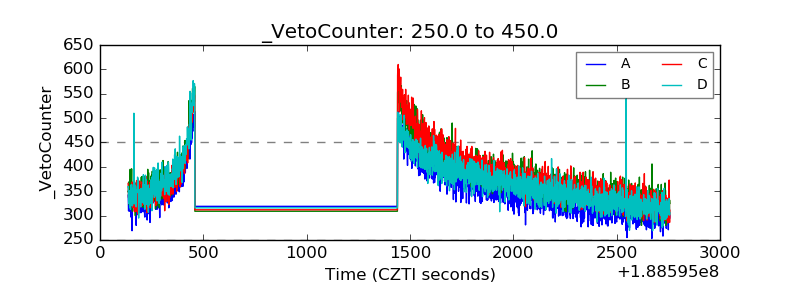 |