| Param | Original file | Final file |
|---|---|---|
| Filename | modeM0/AS1G04_003T02_9000000228_01285cztM0_level2.evt | modeM0/AS1G04_003T02_9000000228_01285cztM0_level2_quad_clean.evt |
| Size (bytes) | 1,210,106,880 | 90,541,440 |
| Size | 1.1 GB | 86.3 MB |
| Events in quadrant A | 6,897,667 | 606,850 |
| Events in quadrant B | 7,578,417 | 608,435 |
| Events in quadrant C | 7,320,304 | 602,058 |
| Events in quadrant D | 14,450,086 | 498,379 |
| Mode M0 | |||
|---|---|---|---|
| Quadrant | BADHDUFLAG | Total packets | Discarded packets |
| A | 0 | 24845 | 2 |
| B | 0 | 26813 | 1 |
| C | 0 | 26048 | 1 |
| D | 0 | 47439 | 1 |
| Mode SS | |||
|---|---|---|---|
| Quadrant | BADHDUFLAG | Total packets | Discarded packets |
| A | 0 | 124 | 0 |
| B | 0 | 124 | 0 |
| C | 0 | 124 | 0 |
| D | 0 | 124 | 0 |
| Mode M9 | |||
|---|---|---|---|
| Quadrant | BADHDUFLAG | Total packets | Discarded packets |
| A | 0 | 11 | 0 |
| B | 0 | 11 | 0 |
| C | 0 | 11 | 0 |
| D | 0 | 11 | 0 |
| Quadrant | Total seconds | Saturated seconds | Saturation percentage |
|---|---|---|---|
| A | 6092 | 1 | 0.016415% |
| B | 6092 | 13 | 0.213395% |
| C | 6092 | 10 | 0.164150% |
| D | 6092 | 1819 | 29.858831% |
Noise dominated data is calculated using 1-second bins in cleaned event files. If a bin has >2000 counts, and if more than 50% of those come from <1% of pixels, then it is considered to be noise-dominated and hence unusable.
| Quadrant | # 1 sec bins | Bins with >0 counts | Bins with >2000 counts | High rate bins dominated by noise | Noise dominated (total time) | Noise dominated (detector-on time) | Marked lightcurve |
|---|---|---|---|---|---|---|---|
| A | 7212 | 6093 | 91 | 91 | 1.26% | 1.49% | 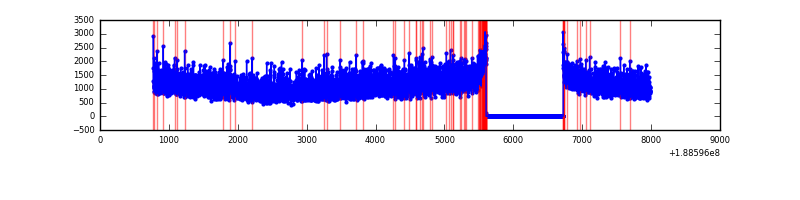 |
| B | 7212 | 6092 | 204 | 204 | 2.83% | 3.35% | 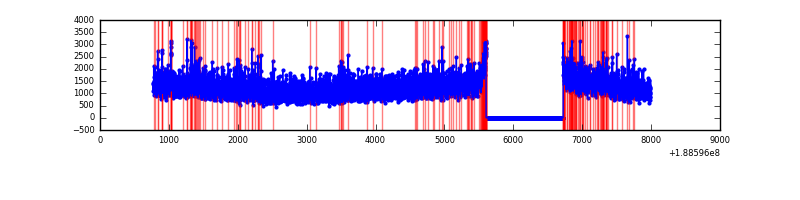 |
| C | 7212 | 6092 | 149 | 149 | 2.07% | 2.45% |  |
| D | 7212 | 6092 | 4113 | 4113 | 57.03% | 67.51% | 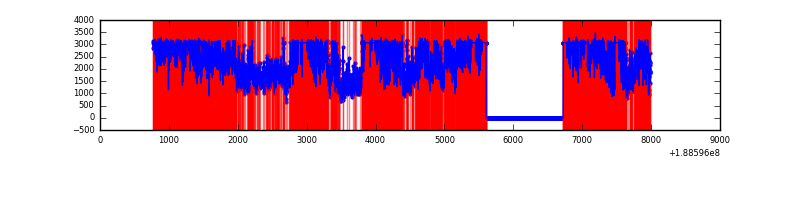 |
Top three noisy pixels from each quadrant. If the there are fewer than three noisy pixels in the level2.evt file, extra rows are filled as -1
| Pixel properties | Quadrant properties | ||||||
|---|---|---|---|---|---|---|---|
| Quadrant | DetID | PixID | Counts | Sigma | Mean | Median | Sigma |
| A | 12 | 243 | 25895 | 56.15 | 1789 | 1799 | 429.2 |
| A | 11 | 79 | 6818 | 11.7 | 1789 | 1799 | 429.2 |
| A | 13 | 9 | 6008 | 9.81 | 1789 | 1799 | 429.2 |
| B | 8 | 4 | 129997 | 289.39 | 1897 | 1901 | 442.6 |
| B | 6 | 53 | 129408 | 288.06 | 1897 | 1901 | 442.6 |
| B | 12 | 52 | 42999 | 92.85 | 1897 | 1901 | 442.6 |
| C | 15 | 241 | 304067 | 629.18 | 1736 | 1799 | 480.4 |
| C | 8 | 208 | 181632 | 374.33 | 1736 | 1799 | 480.4 |
| C | 3 | 79 | 24669 | 47.6 | 1736 | 1799 | 480.4 |
| D | 13 | 169 | 5661430 | 12441.03 | 1486 | 1541 | 454.9 |
| D | 10 | 84 | 2588680 | 5686.8 | 1486 | 1541 | 454.9 |
| D | 12 | 22 | 205668 | 448.69 | 1486 | 1541 | 454.9 |
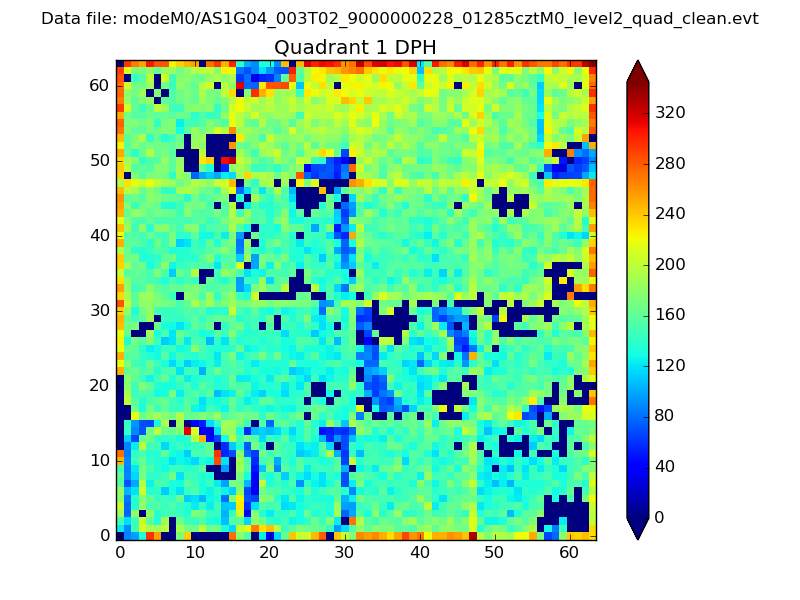
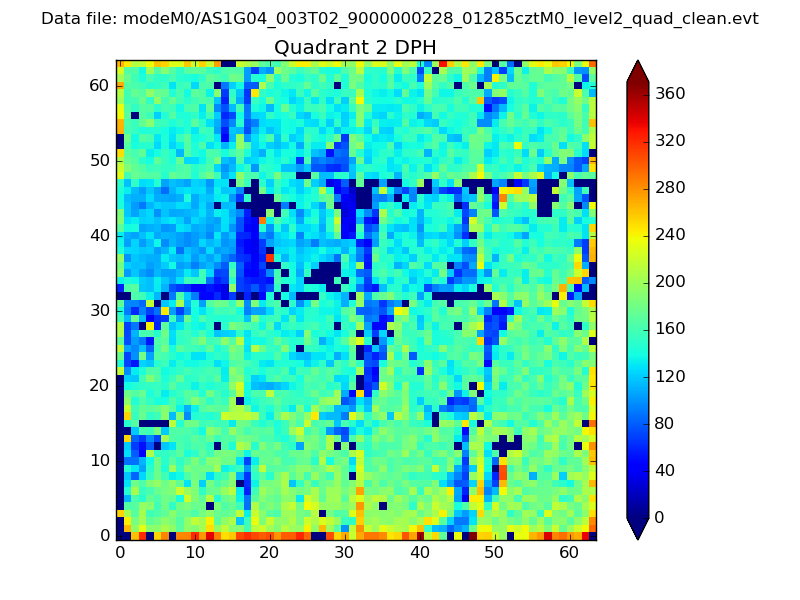
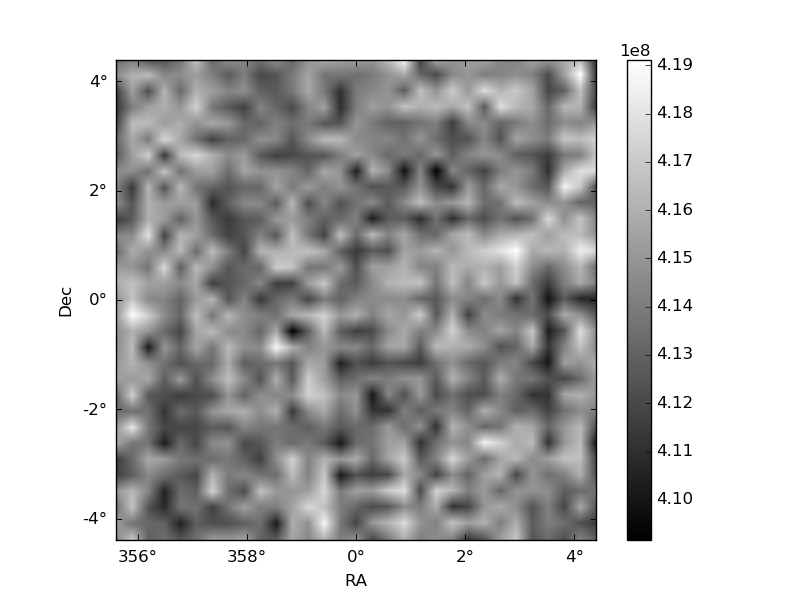
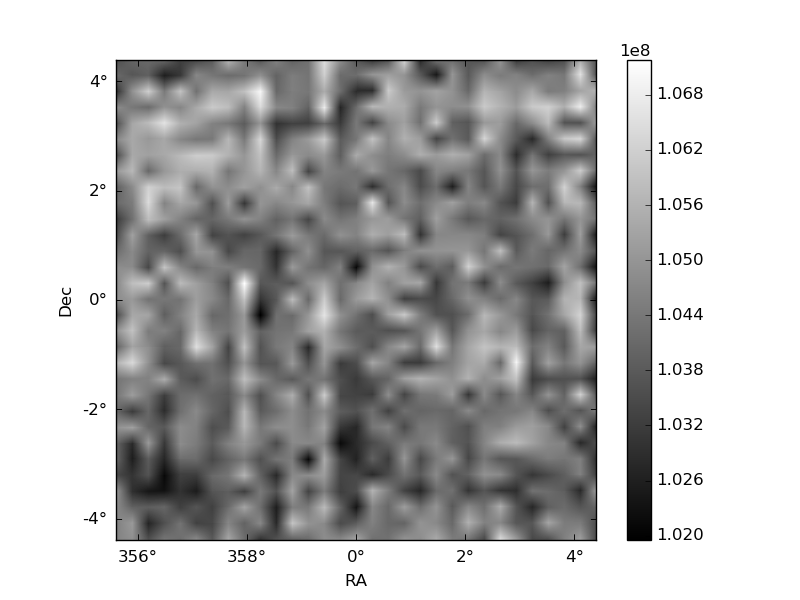
Histogram calculated using DETX and DETY for each event in the final _common_clean file
| Quadrant A | 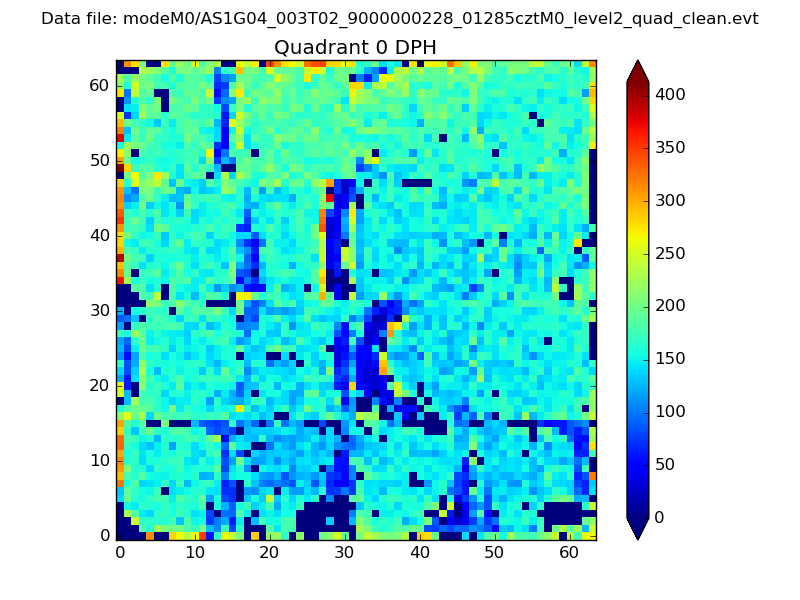 |
 |
Quadrant B |
|---|---|---|---|
| Quadrant D | 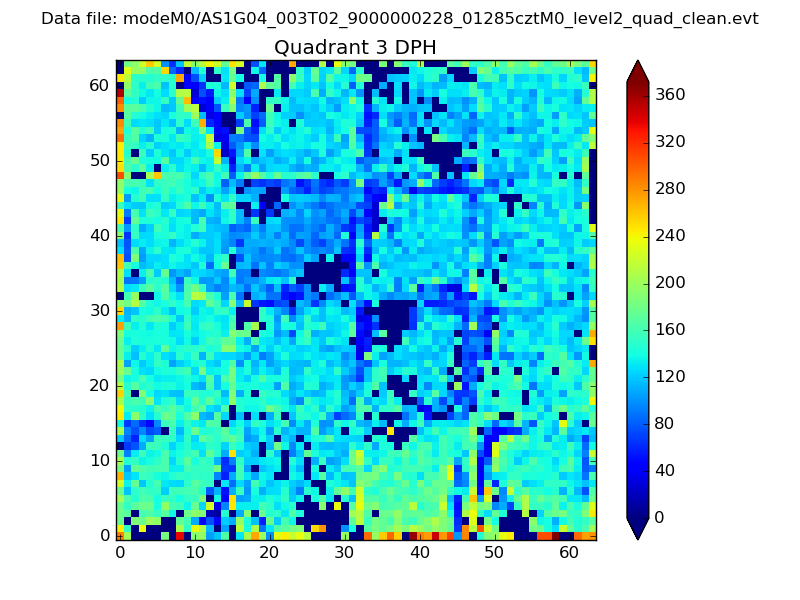 |
 |
Quadrant C |
| Plot type | Count rate plots | Images |
|---|---|---|
| Comparison with Poisson distribution Blue bars denote a histogram of data divided into 1 sec bins. Red curve is a Poisson curve with rate = median count rate of data. |
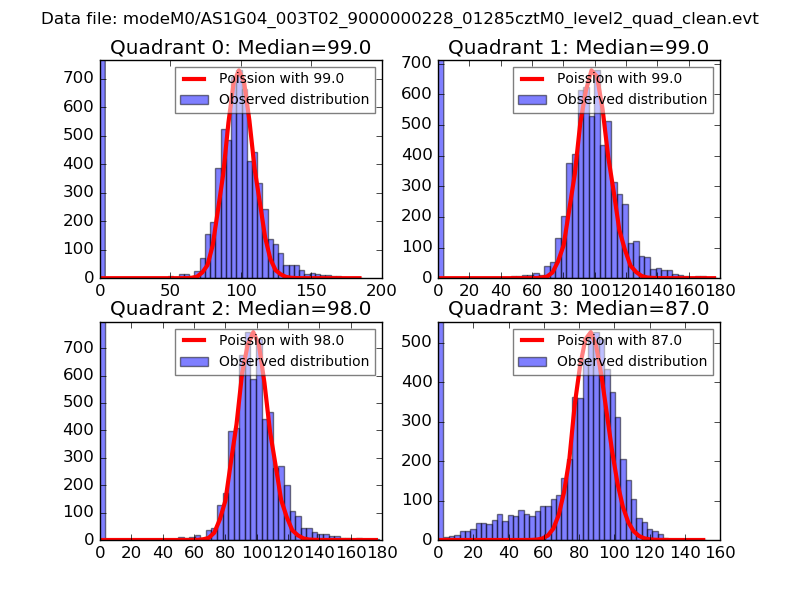 |
 |
| Quadrant-wise count rates Data is divided into 100 sec bins |
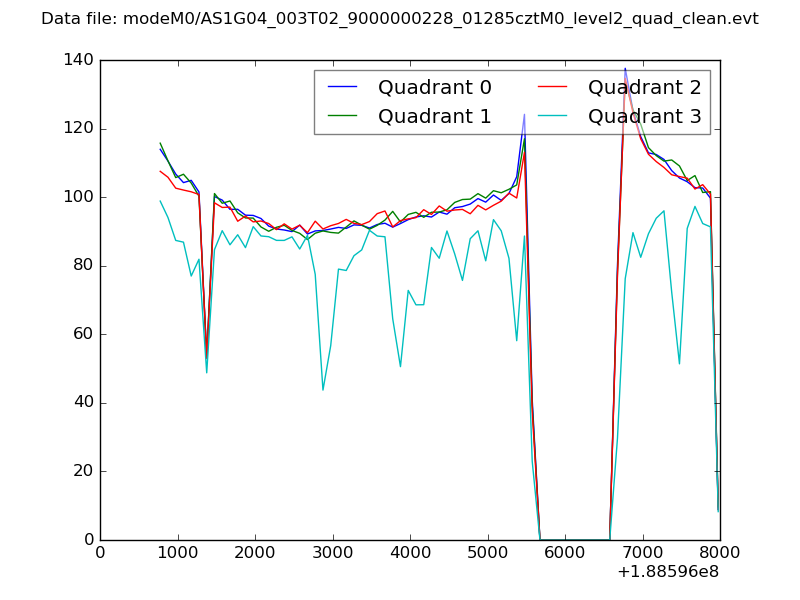 |
|
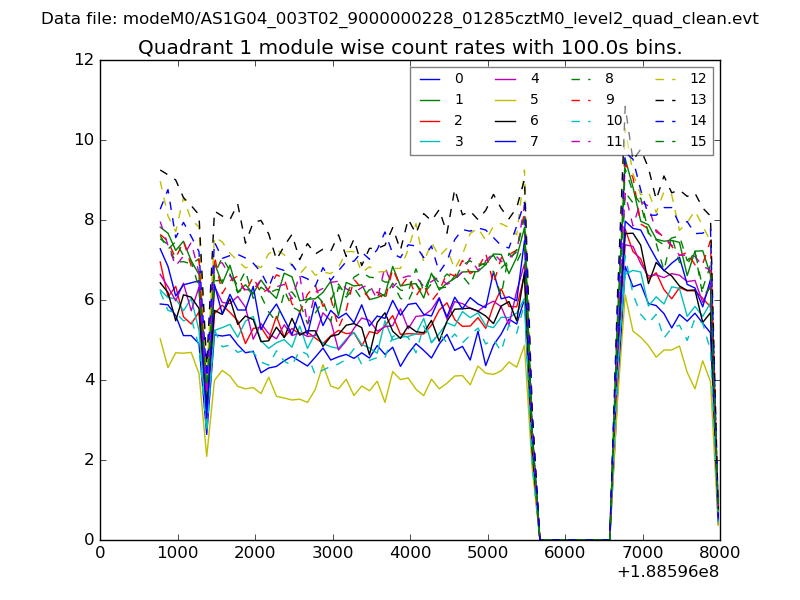
| Module-wise count rates for Quadrant A Data is divided into 100 sec bins |
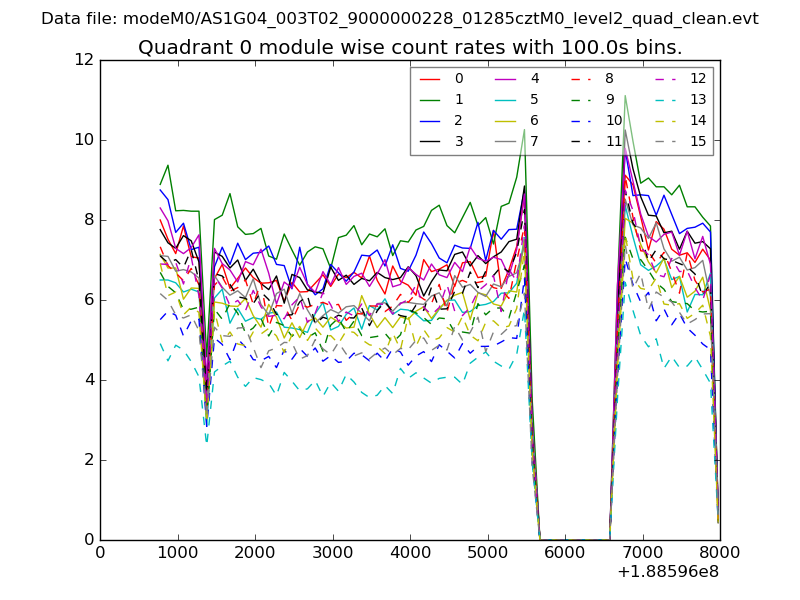 |
 |
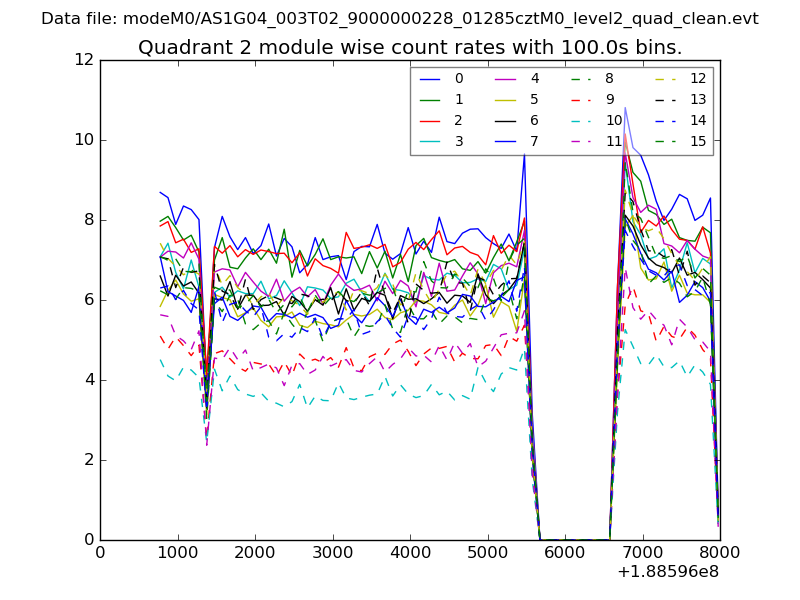
| Module-wise count rates for Quadrant B Data is divided into 100 sec bins |
 |
 |
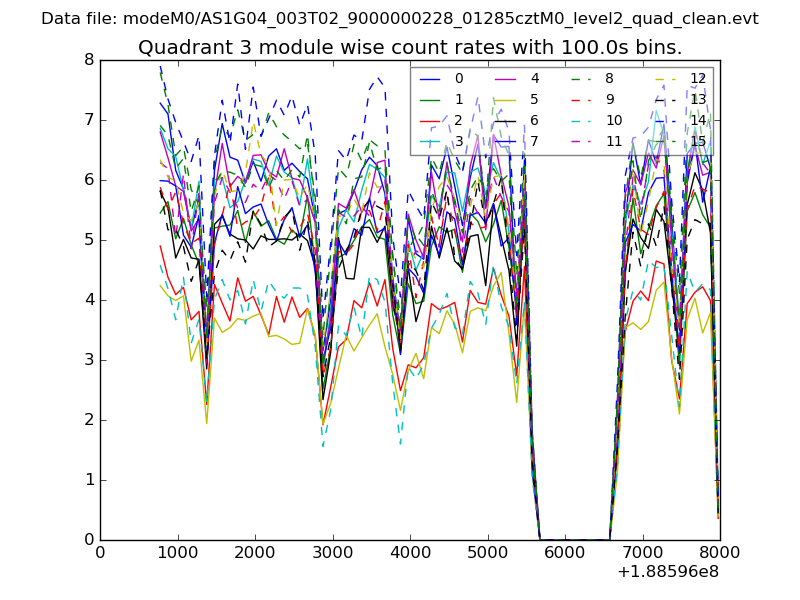
| Module-wise count rates for Quadrant C Data is divided into 100 sec bins |
 |
 |
| Module-wise count rates for Quadrant D Data is divided into 100 sec bins |
 |
 |
| Parameter | Plot |
|---|---|
| CZT HV Monitor | 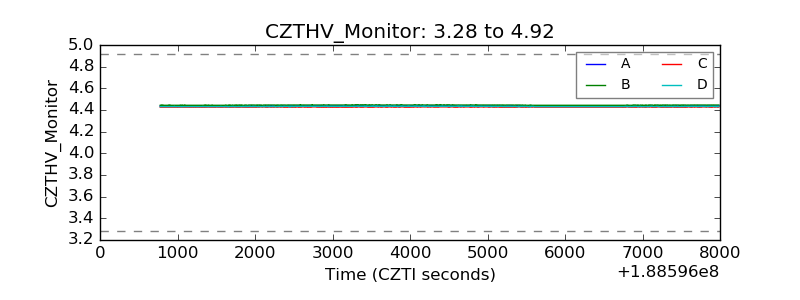 |
| D_VDD | 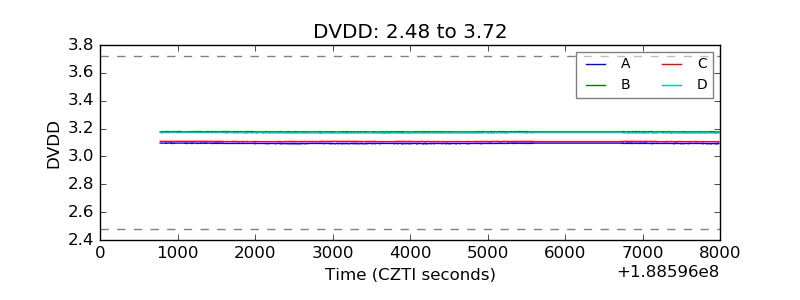 |
| Temperature 1 | 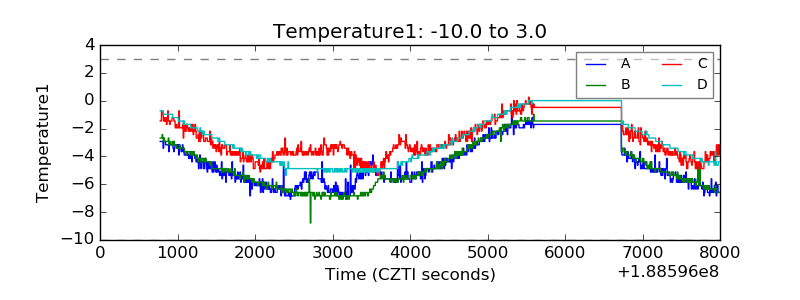 |
| Veto HV Monitor | 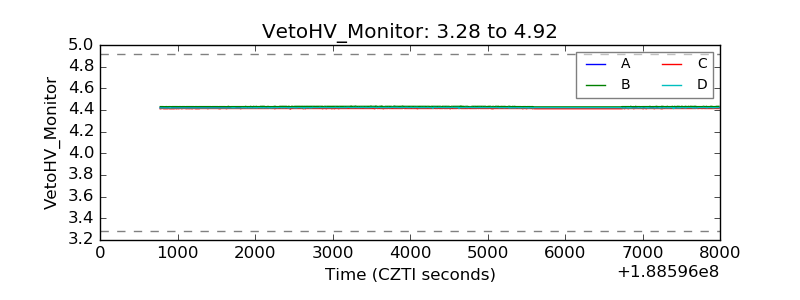 |
| Veto LLD | 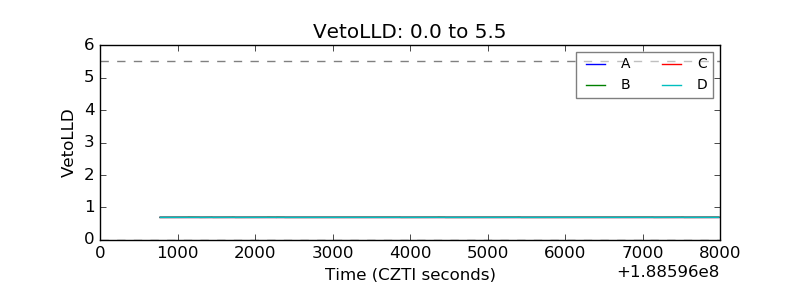 |
| Alpha Counter | 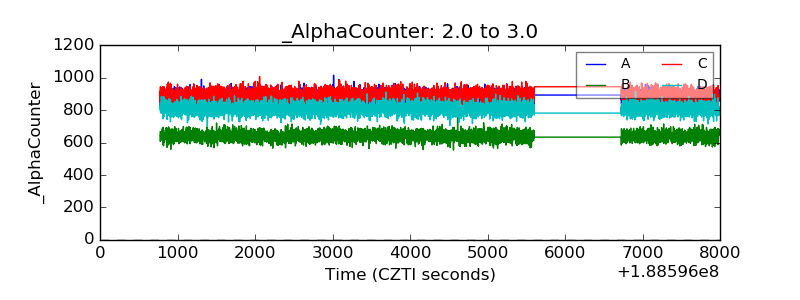 |
| _CPM_Rate | 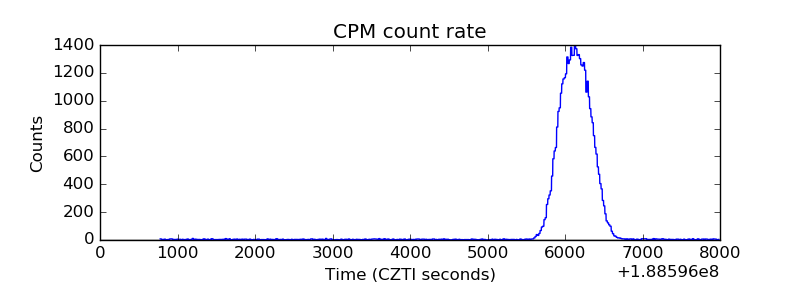 |
| CZT Counter | 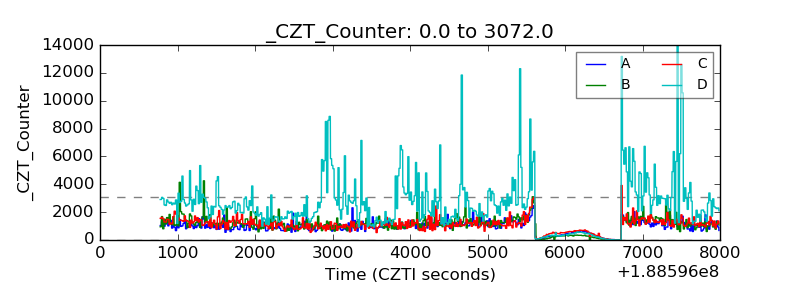 |
| +2.5 Volts monitor |  |
| +5 Volts monitor |  |
| _ROLL_ROT | 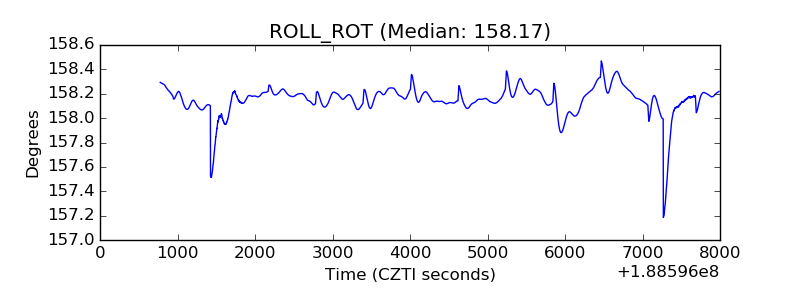 |
| _Roll_DEC | 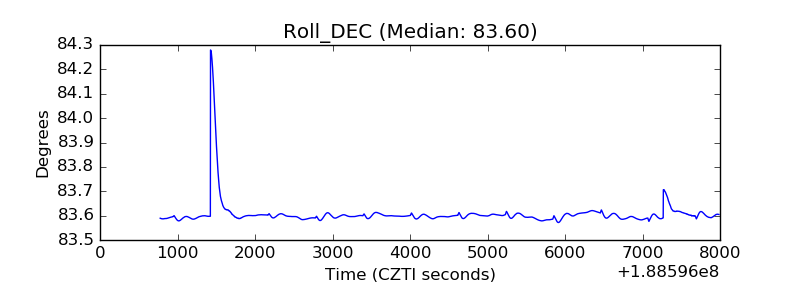 |
| _Roll_RA | 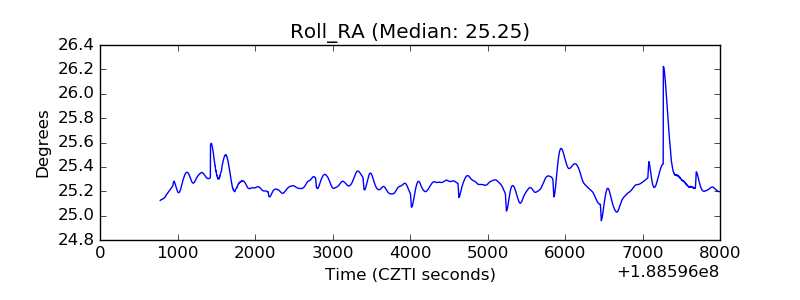 |
| Veto Counter | 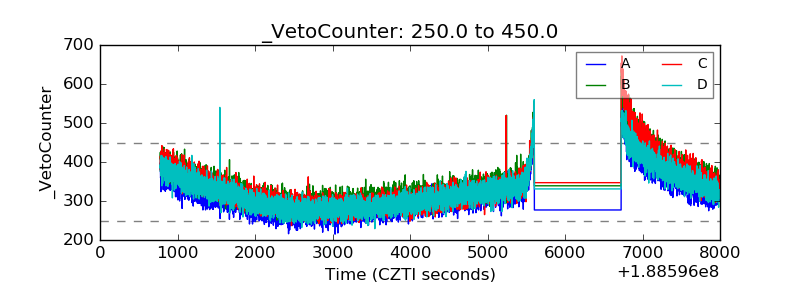 |