| Param | Original file | Final file |
|---|---|---|
| Filename | modeM0/AS1G04_003T02_9000000228_01286cztM0_level2.evt | modeM0/AS1G04_003T02_9000000228_01286cztM0_level2_quad_clean.evt |
| Size (bytes) | 1,221,272,640 | 98,660,160 |
| Size | 1.1 GB | 94.1 MB |
| Events in quadrant A | 7,191,629 | 656,964 |
| Events in quadrant B | 8,197,830 | 663,901 |
| Events in quadrant C | 7,532,697 | 654,881 |
| Events in quadrant D | 13,648,395 | 571,460 |
| Mode M0 | |||
|---|---|---|---|
| Quadrant | BADHDUFLAG | Total packets | Discarded packets |
| A | 0 | 25879 | 3 |
| B | 0 | 28809 | 2 |
| C | 0 | 26812 | 2 |
| D | 0 | 45119 | 2 |
| Mode SS | |||
|---|---|---|---|
| Quadrant | BADHDUFLAG | Total packets | Discarded packets |
| A | 0 | 128 | 0 |
| B | 0 | 128 | 0 |
| C | 0 | 128 | 0 |
| D | 0 | 128 | 0 |
| Mode M9 | |||
|---|---|---|---|
| Quadrant | BADHDUFLAG | Total packets | Discarded packets |
| A | 0 | 16 | 0 |
| B | 0 | 16 | 0 |
| C | 0 | 16 | 0 |
| D | 0 | 17 | 0 |
| Quadrant | Total seconds | Saturated seconds | Saturation percentage |
|---|---|---|---|
| A | 6309 | 2 | 0.031701% |
| B | 6309 | 27 | 0.427960% |
| C | 6309 | 15 | 0.237756% |
| D | 6309 | 1051 | 16.658741% |
Noise dominated data is calculated using 1-second bins in cleaned event files. If a bin has >2000 counts, and if more than 50% of those come from <1% of pixels, then it is considered to be noise-dominated and hence unusable.
| Quadrant | # 1 sec bins | Bins with >0 counts | Bins with >2000 counts | High rate bins dominated by noise | Noise dominated (total time) | Noise dominated (detector-on time) | Marked lightcurve |
|---|---|---|---|---|---|---|---|
| A | 7514 | 6310 | 112 | 112 | 1.49% | 1.77% | 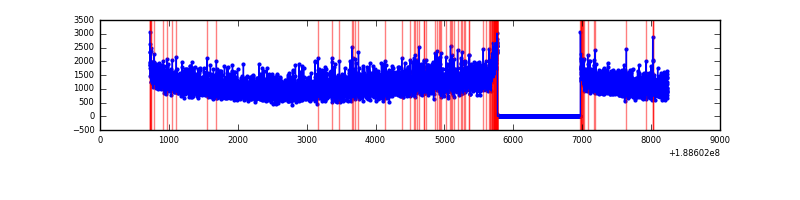 |
| B | 7514 | 6310 | 365 | 365 | 4.86% | 5.78% | 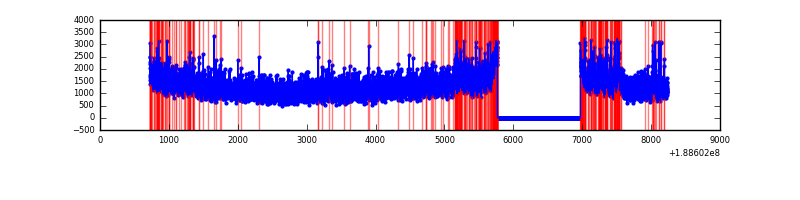 |
| C | 7514 | 6309 | 190 | 190 | 2.53% | 3.01% | 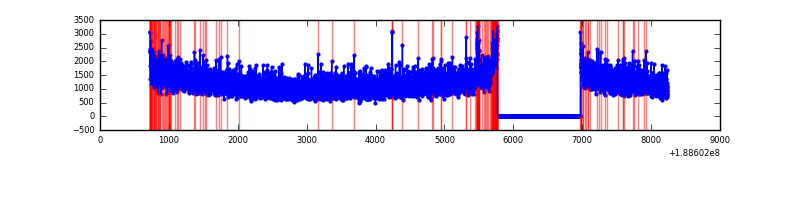 |
| D | 7514 | 6309 | 3536 | 3536 | 47.06% | 56.05% | 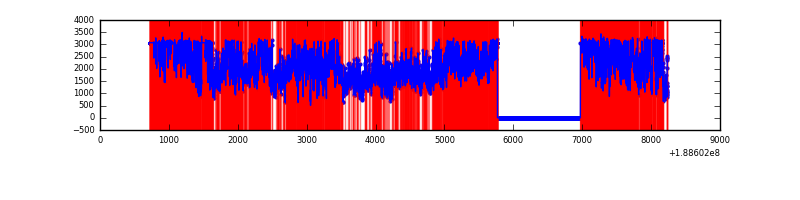 |
Top three noisy pixels from each quadrant. If the there are fewer than three noisy pixels in the level2.evt file, extra rows are filled as -1
| Pixel properties | Quadrant properties | ||||||
|---|---|---|---|---|---|---|---|
| Quadrant | DetID | PixID | Counts | Sigma | Mean | Median | Sigma |
| A | 12 | 243 | 8488 | 14.9 | 1870 | 1883 | 443.3 |
| A | 11 | 79 | 7565 | 12.82 | 1870 | 1883 | 443.3 |
| A | 3 | 111 | 6247 | 9.84 | 1870 | 1883 | 443.3 |
| B | 8 | 4 | 383584 | 825.19 | 1989 | 1994 | 462.4 |
| B | 12 | 52 | 143940 | 306.96 | 1989 | 1994 | 462.4 |
| B | 6 | 53 | 39527 | 81.17 | 1989 | 1994 | 462.4 |
| C | 15 | 241 | 311192 | 621.08 | 1810 | 1876 | 498.0 |
| C | 9 | 52 | 54730 | 106.13 | 1810 | 1876 | 498.0 |
| C | 8 | 208 | 43466 | 83.51 | 1810 | 1876 | 498.0 |
| D | 13 | 169 | 7011443 | 14074.31 | 1628 | 1685 | 498.1 |
| D | 12 | 22 | 224583 | 447.54 | 1628 | 1685 | 498.1 |
| D | 10 | 84 | 155338 | 308.51 | 1628 | 1685 | 498.1 |
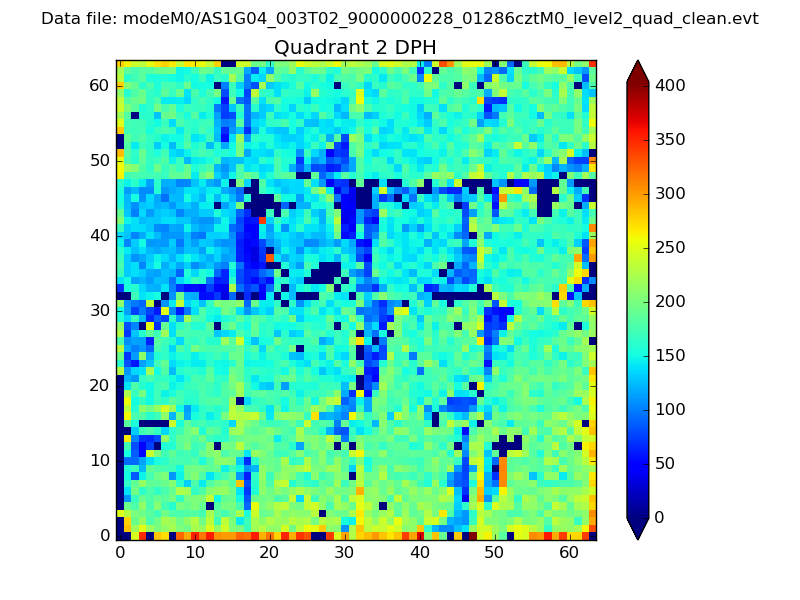
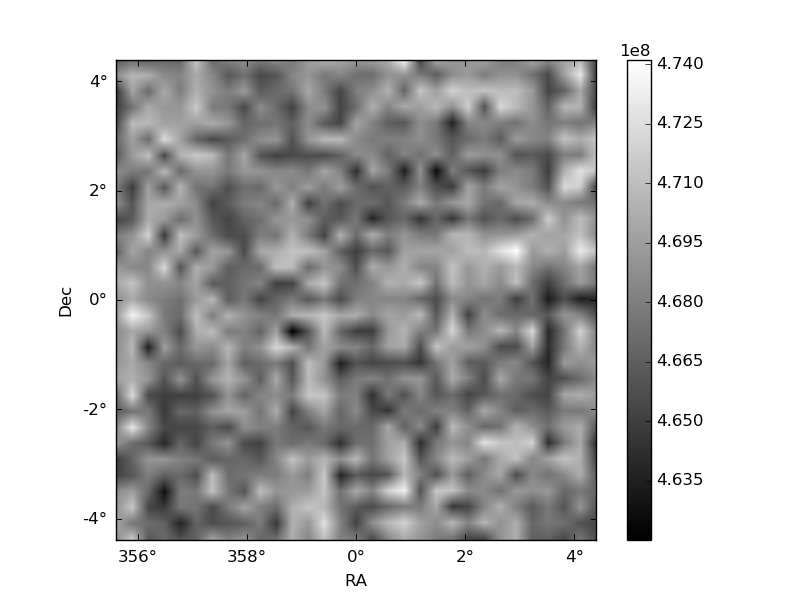
Histogram calculated using DETX and DETY for each event in the final _common_clean file
| Quadrant A | 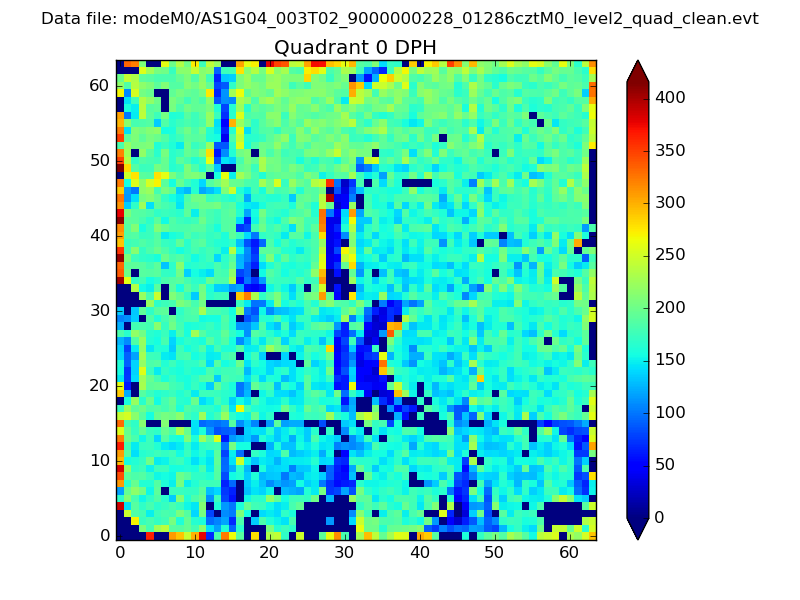 |
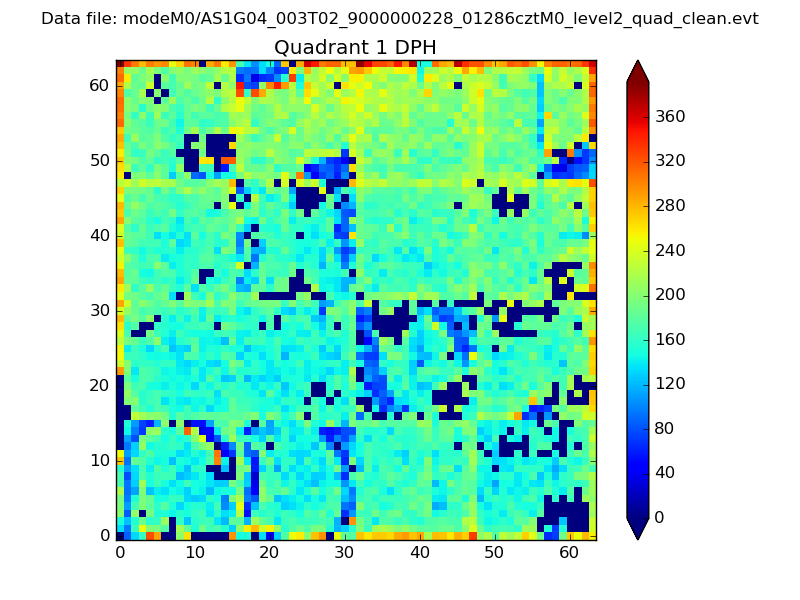 |
Quadrant B |
|---|---|---|---|
| Quadrant D | 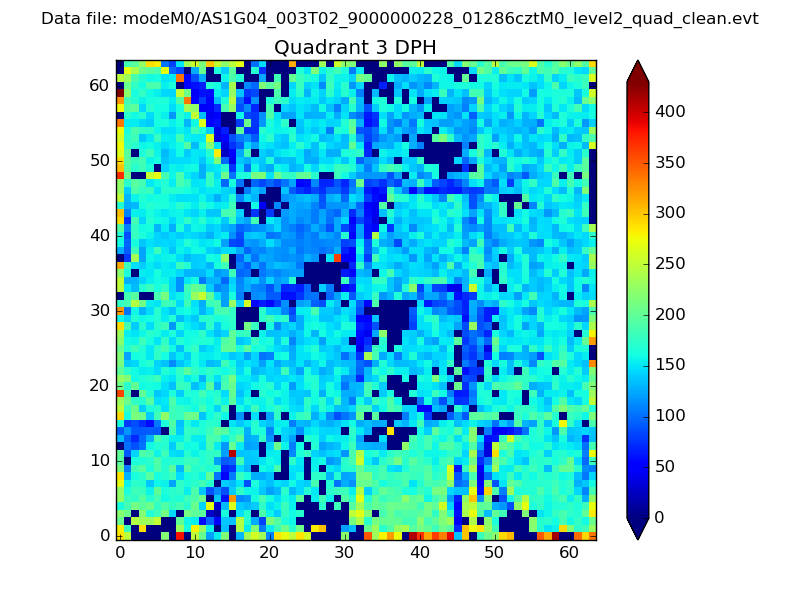 |
 |
Quadrant C |
| Plot type | Count rate plots | Images |
|---|---|---|
| Comparison with Poisson distribution Blue bars denote a histogram of data divided into 1 sec bins. Red curve is a Poisson curve with rate = median count rate of data. |
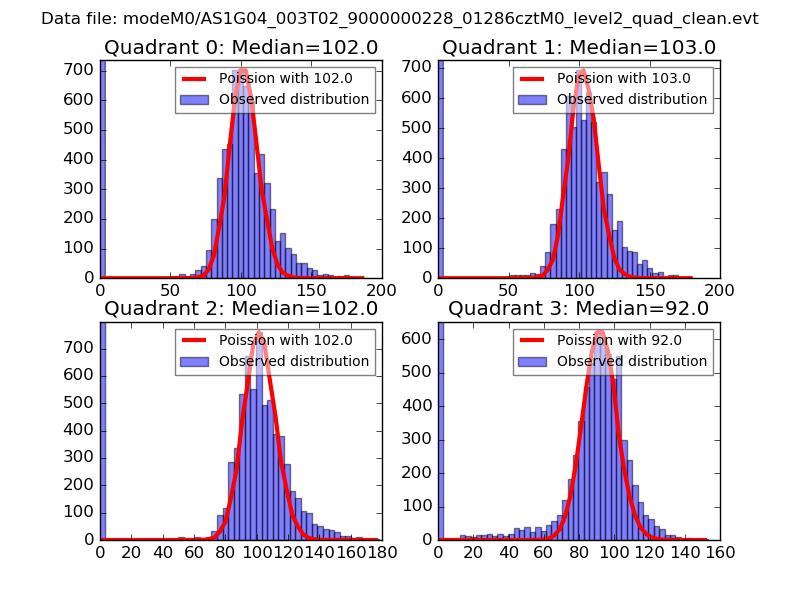 |
 |
| Quadrant-wise count rates Data is divided into 100 sec bins |
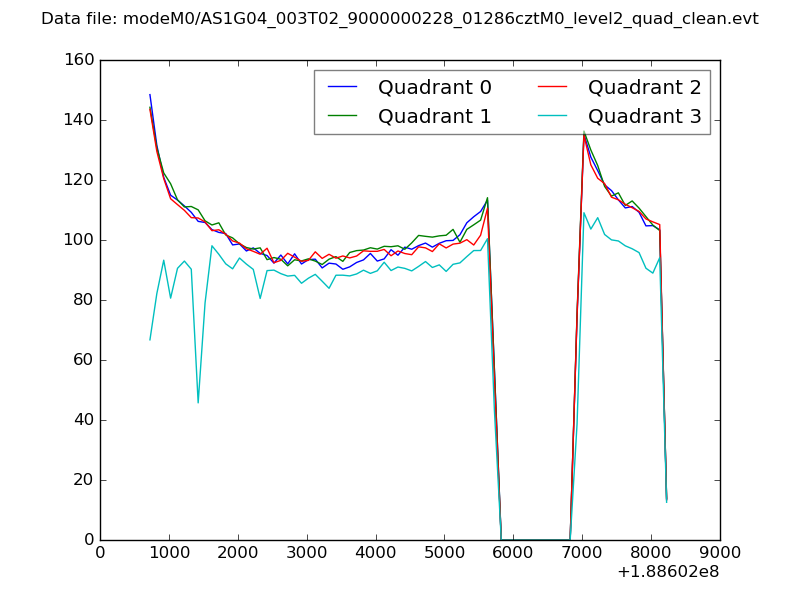 |
|
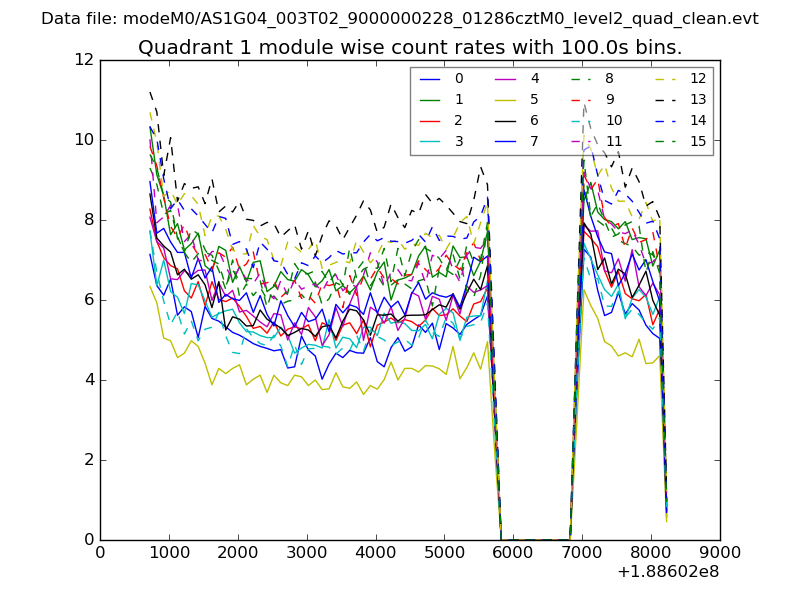
| Module-wise count rates for Quadrant A Data is divided into 100 sec bins |
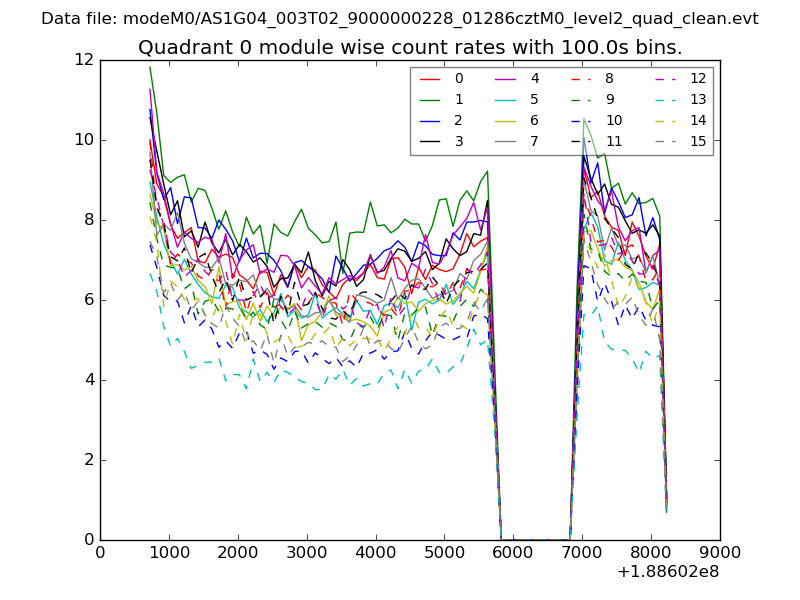 |
 |
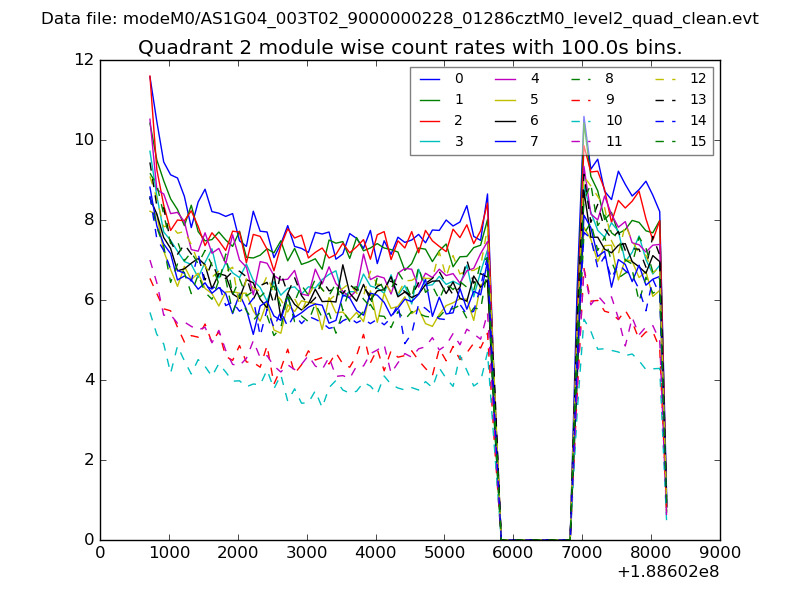
| Module-wise count rates for Quadrant B Data is divided into 100 sec bins |
 |
 |
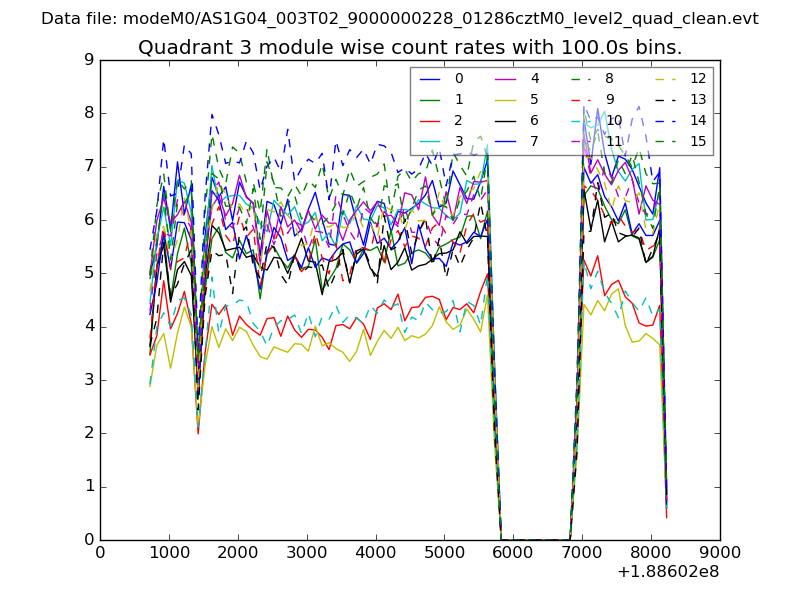
| Module-wise count rates for Quadrant C Data is divided into 100 sec bins |
 |
 |
| Module-wise count rates for Quadrant D Data is divided into 100 sec bins |
 |
 |
| Parameter | Plot |
|---|---|
| CZT HV Monitor | 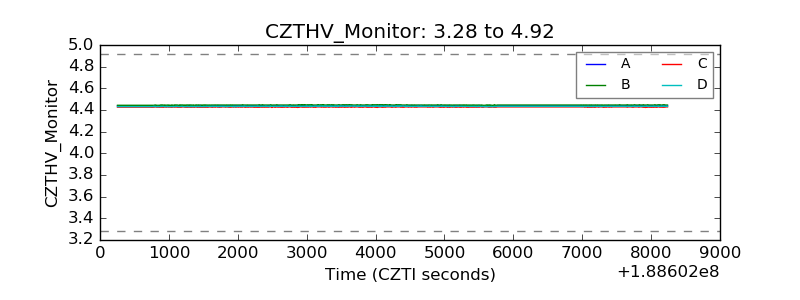 |
| D_VDD |  |
| Temperature 1 | 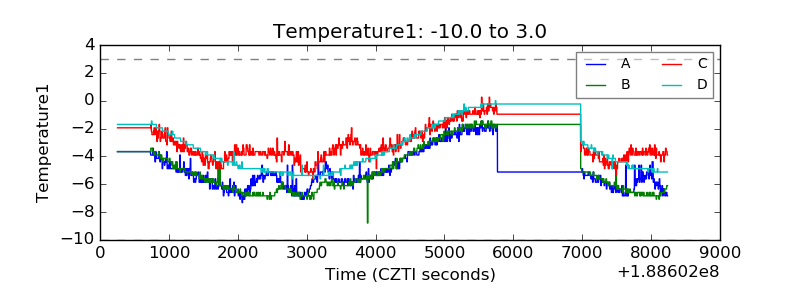 |
| Veto HV Monitor | 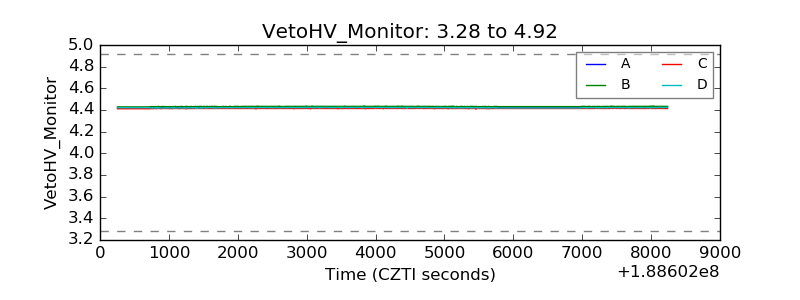 |
| Veto LLD | 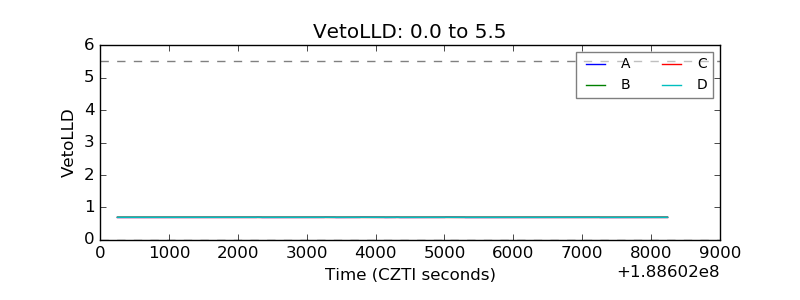 |
| Alpha Counter | 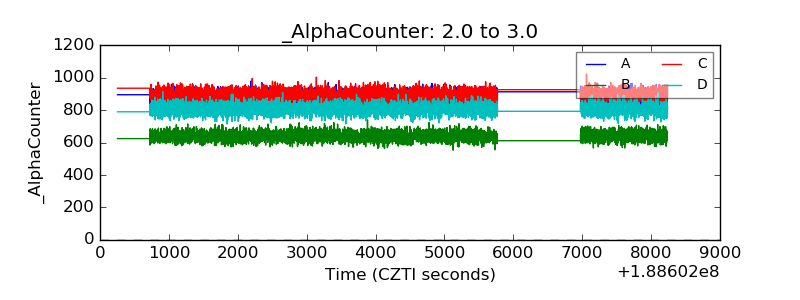 |
| _CPM_Rate | 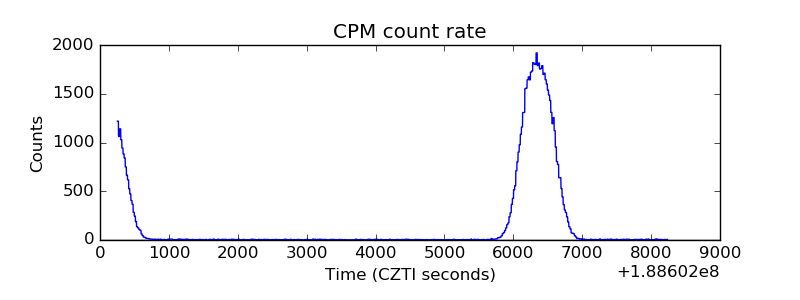 |
| CZT Counter | 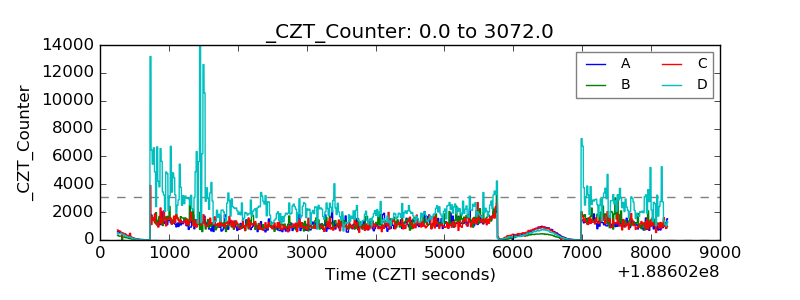 |
| +2.5 Volts monitor |  |
| +5 Volts monitor |  |
| _ROLL_ROT | 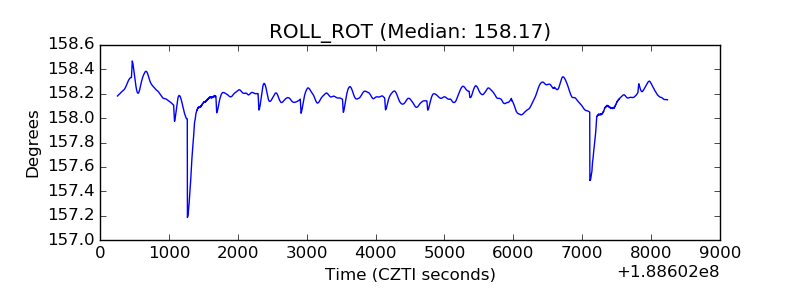 |
| _Roll_DEC | 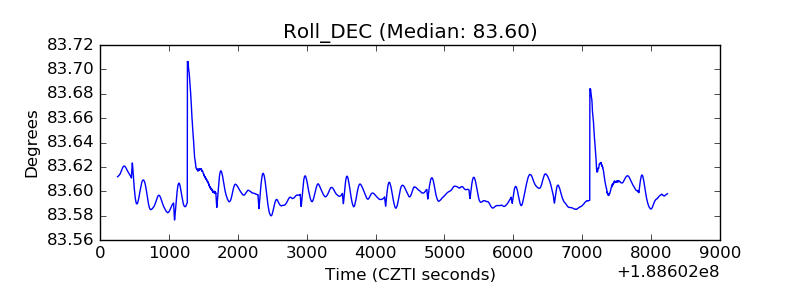 |
| _Roll_RA | 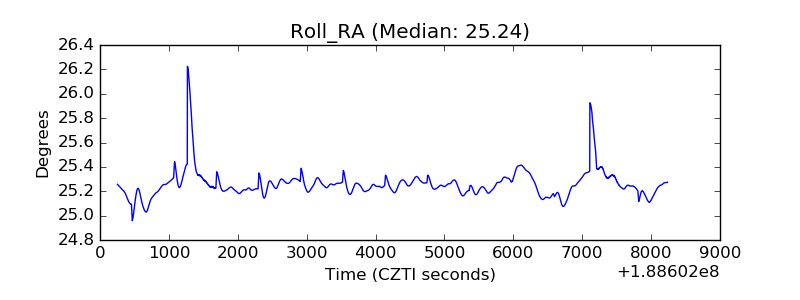 |
| Veto Counter | 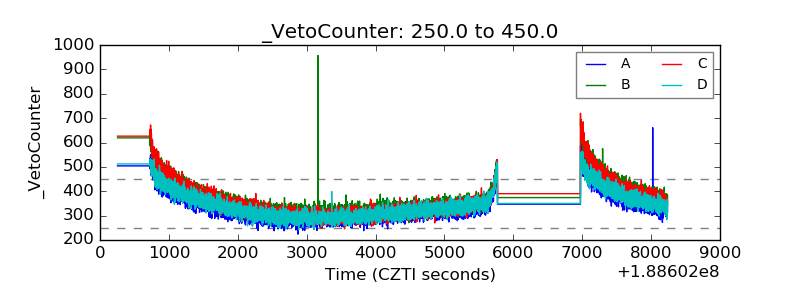 |