| Param | Original file | Final file |
|---|---|---|
| Filename | modeM0/AS1G04_003T02_9000000228_01287cztM0_level2.evt | modeM0/AS1G04_003T02_9000000228_01287cztM0_level2_quad_clean.evt |
| Size (bytes) | 541,987,200 | 47,304,000 |
| Size | 516.9 MB | 45.1 MB |
| Events in quadrant A | 3,163,536 | 311,071 |
| Events in quadrant B | 3,799,031 | 313,813 |
| Events in quadrant C | 3,276,824 | 313,285 |
| Events in quadrant D | 5,973,204 | 278,686 |
| Mode M0 | |||
|---|---|---|---|
| Quadrant | BADHDUFLAG | Total packets | Discarded packets |
| A | 0 | 11563 | 0 |
| B | 0 | 13448 | 0 |
| C | 0 | 11869 | 0 |
| D | 0 | 19907 | 0 |
| Mode SS | |||
|---|---|---|---|
| Quadrant | BADHDUFLAG | Total packets | Discarded packets |
| A | 0 | 60 | 0 |
| B | 0 | 60 | 0 |
| C | 0 | 60 | 0 |
| D | 0 | 60 | 0 |
| Quadrant | Total seconds | Saturated seconds | Saturation percentage |
|---|---|---|---|
| A | 3021 | 0 | 0.000000% |
| B | 3021 | 32 | 1.059252% |
| C | 3021 | 0 | 0.000000% |
| D | 3021 | 411 | 13.604767% |
Noise dominated data is calculated using 1-second bins in cleaned event files. If a bin has >2000 counts, and if more than 50% of those come from <1% of pixels, then it is considered to be noise-dominated and hence unusable.
| Quadrant | # 1 sec bins | Bins with >0 counts | Bins with >2000 counts | High rate bins dominated by noise | Noise dominated (total time) | Noise dominated (detector-on time) | Marked lightcurve |
|---|---|---|---|---|---|---|---|
| A | 3021 | 3021 | 21 | 21 | 0.70% | 0.70% | 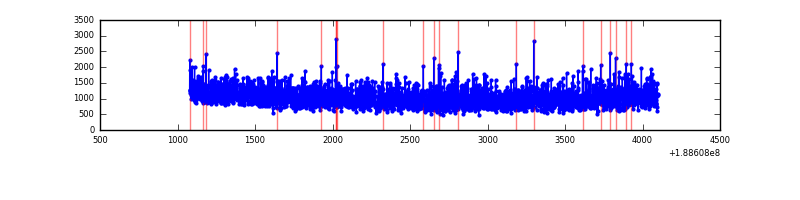 |
| B | 3021 | 3021 | 170 | 170 | 5.63% | 5.63% | 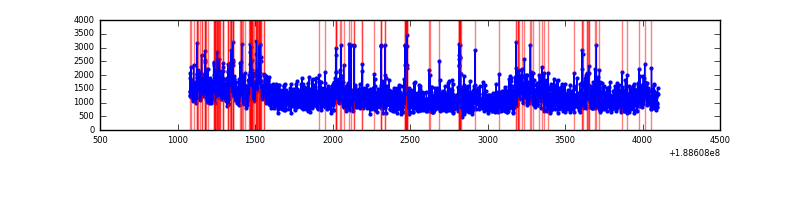 |
| C | 3021 | 3021 | 20 | 20 | 0.66% | 0.66% | 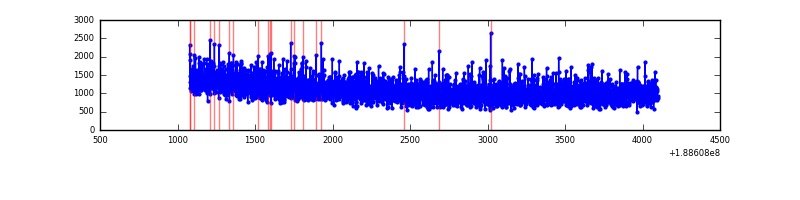 |
| D | 3021 | 3021 | 1340 | 1340 | 44.36% | 44.36% | 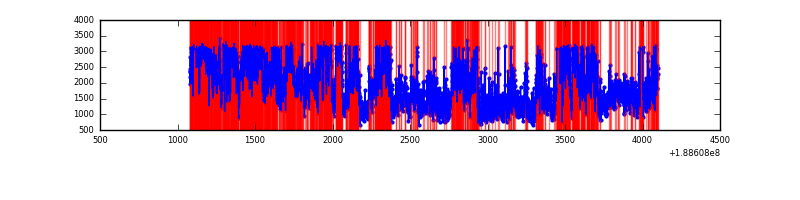 |
Top three noisy pixels from each quadrant. If the there are fewer than three noisy pixels in the level2.evt file, extra rows are filled as -1
| Pixel properties | Quadrant properties | ||||||
|---|---|---|---|---|---|---|---|
| Quadrant | DetID | PixID | Counts | Sigma | Mean | Median | Sigma |
| A | 13 | 9 | 4548 | 19.03 | 822 | 828 | 195.5 |
| A | 11 | 79 | 3306 | 12.68 | 822 | 828 | 195.5 |
| A | 12 | 243 | 3079 | 11.52 | 822 | 828 | 195.5 |
| B | 8 | 4 | 322648 | 1568.07 | 883 | 886 | 205.2 |
| B | 5 | 191 | 96528 | 466.1 | 883 | 886 | 205.2 |
| B | 6 | 53 | 19609 | 91.24 | 883 | 886 | 205.2 |
| C | 15 | 241 | 145726 | 660.15 | 796 | 823 | 219.5 |
| C | 3 | 111 | 8875 | 36.68 | 796 | 823 | 219.5 |
| C | 3 | 79 | 7050 | 28.37 | 796 | 823 | 219.5 |
| D | 13 | 169 | 3155821 | 14313.09 | 715 | 740 | 220.4 |
| D | 13 | 252 | 66333 | 297.56 | 715 | 740 | 220.4 |
| D | 1 | 83 | 31331 | 138.78 | 715 | 740 | 220.4 |
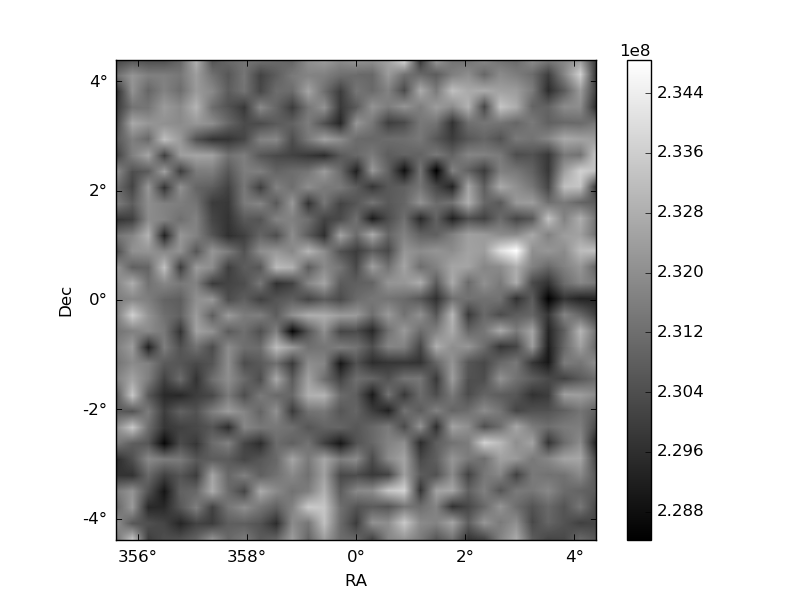
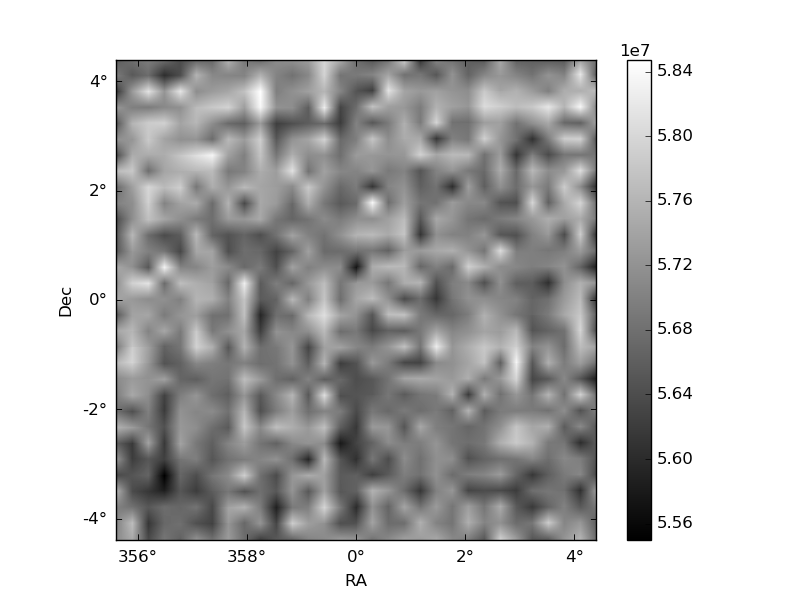
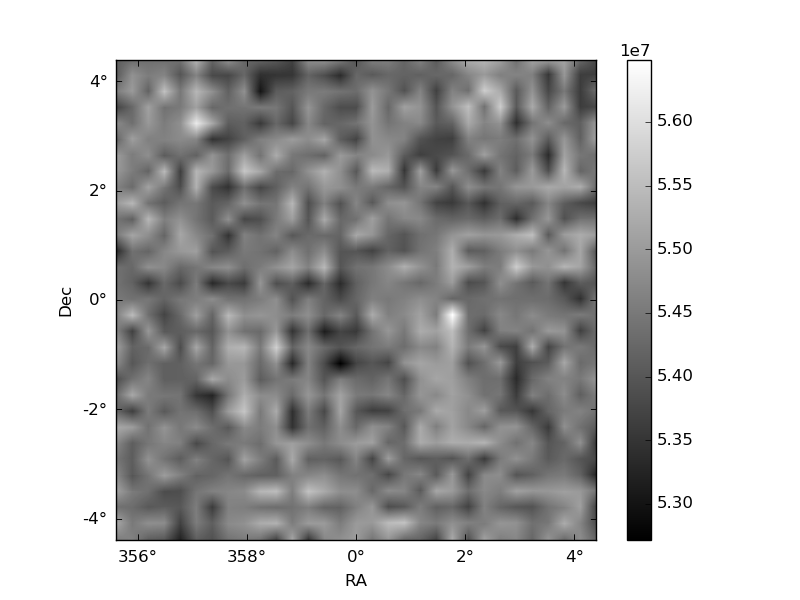
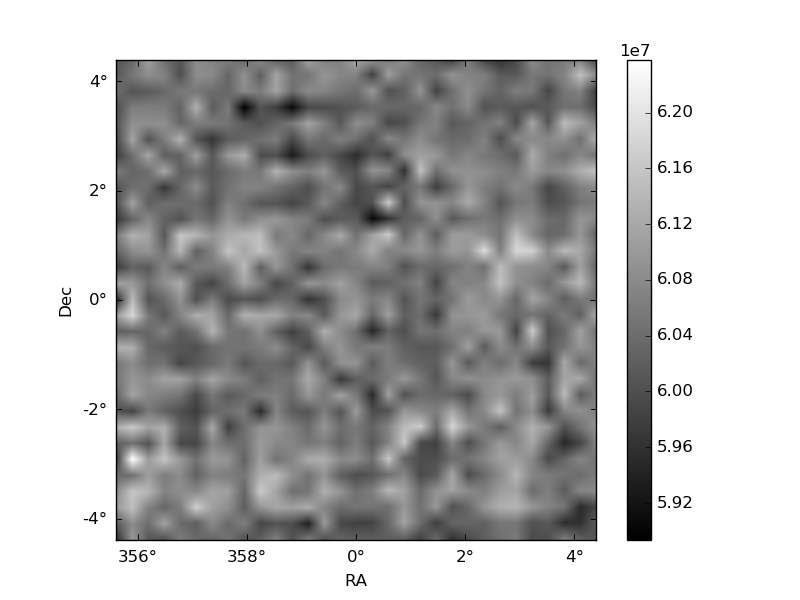
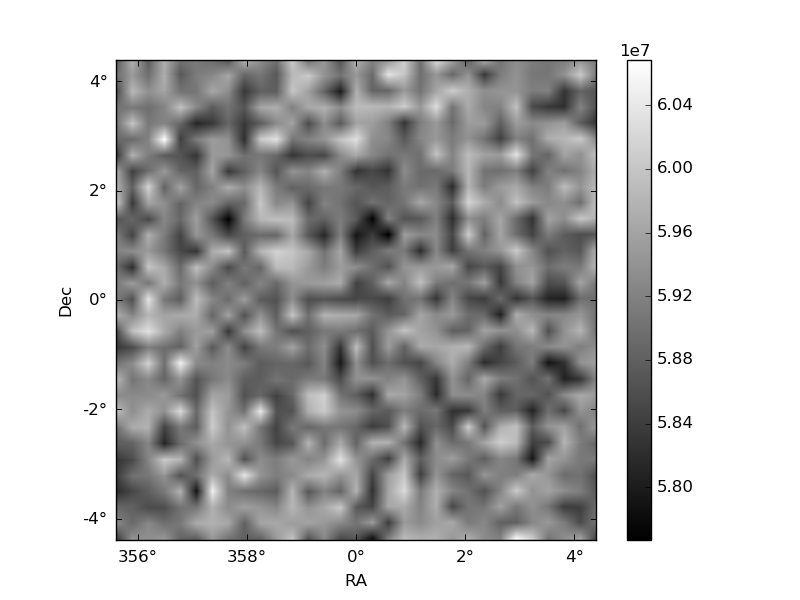
Histogram calculated using DETX and DETY for each event in the final _common_clean file
| Quadrant A | 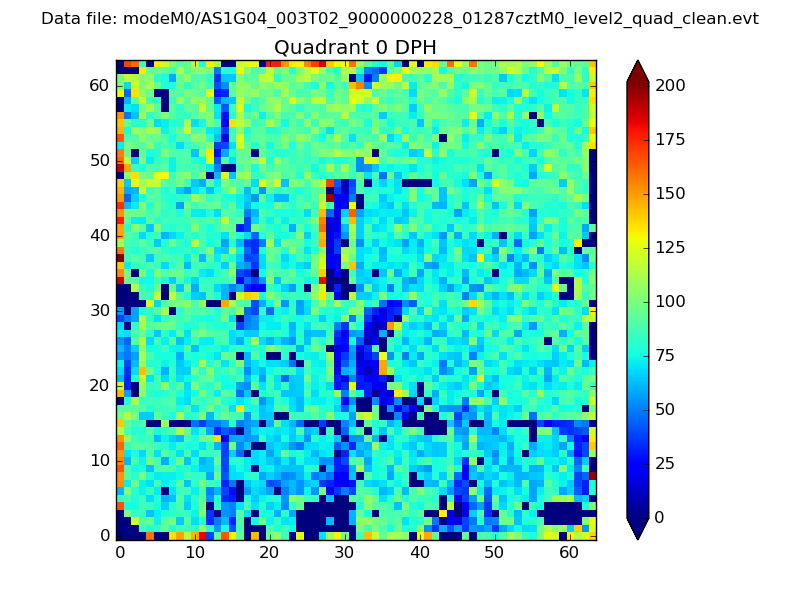 |
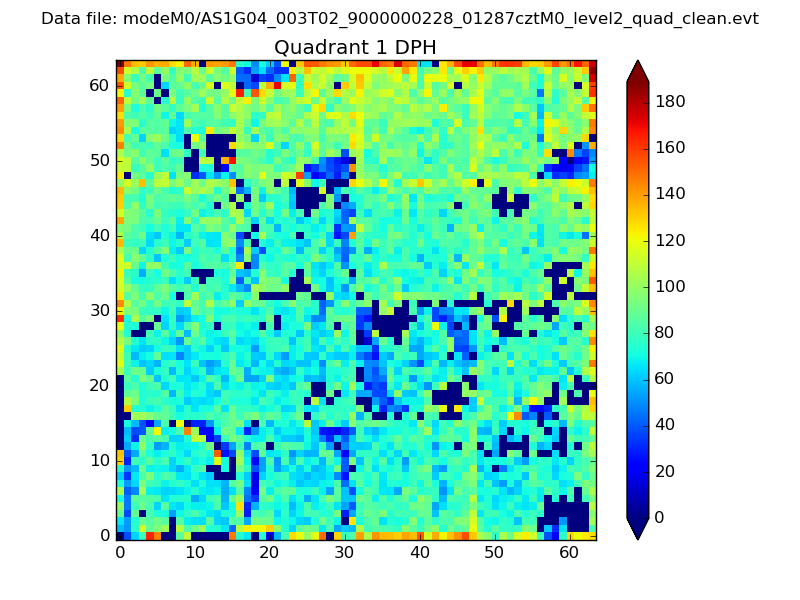 |
Quadrant B |
|---|---|---|---|
| Quadrant D | 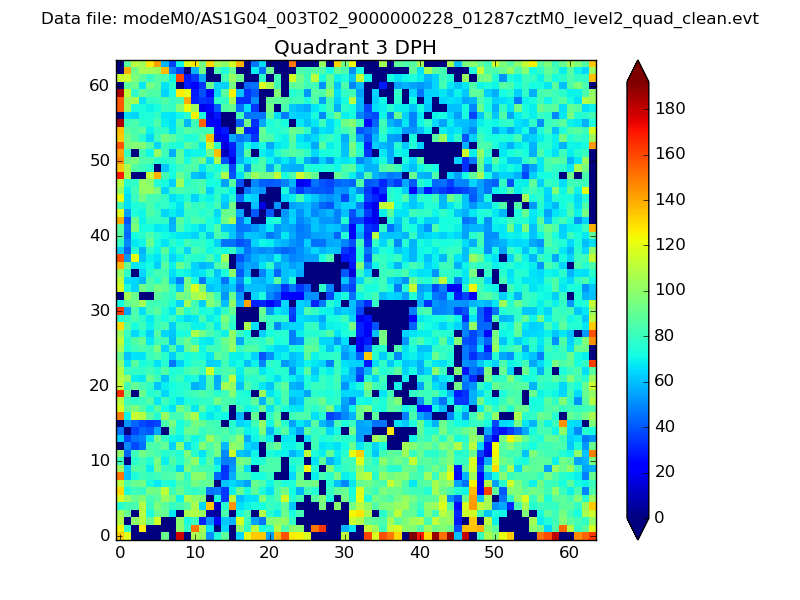 |
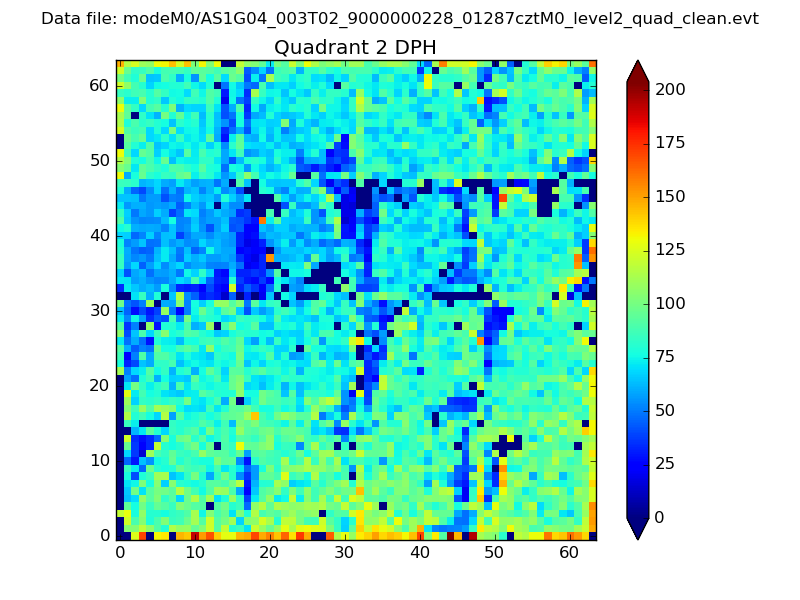 |
Quadrant C |
| Plot type | Count rate plots | Images |
|---|---|---|
| Comparison with Poisson distribution Blue bars denote a histogram of data divided into 1 sec bins. Red curve is a Poisson curve with rate = median count rate of data. |
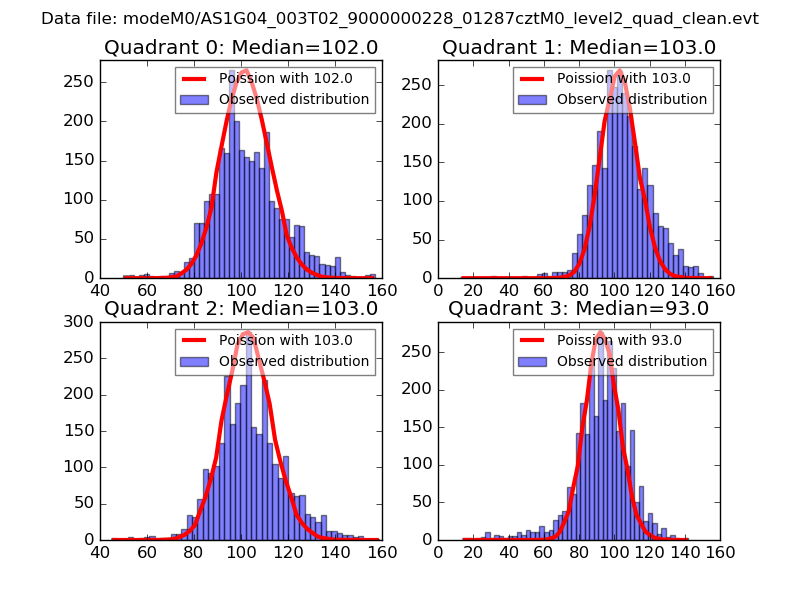 |
 |
| Quadrant-wise count rates Data is divided into 100 sec bins |
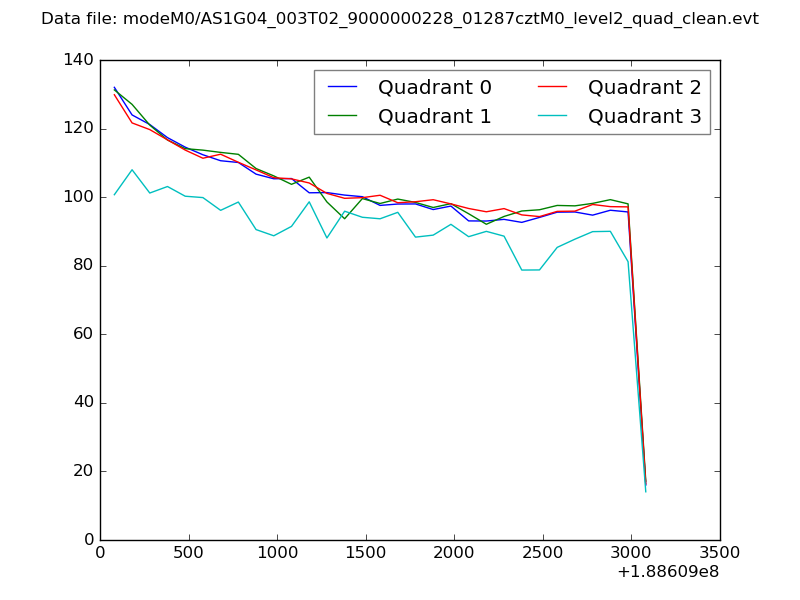 |
|
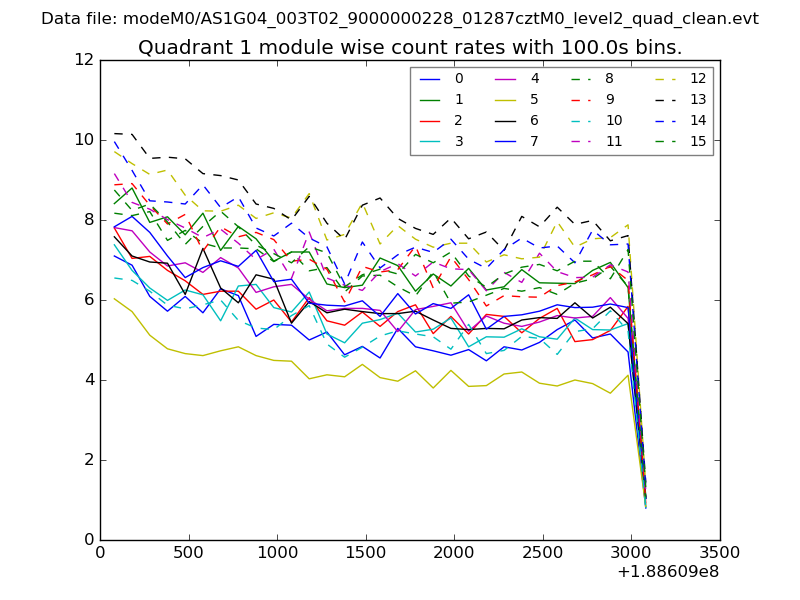
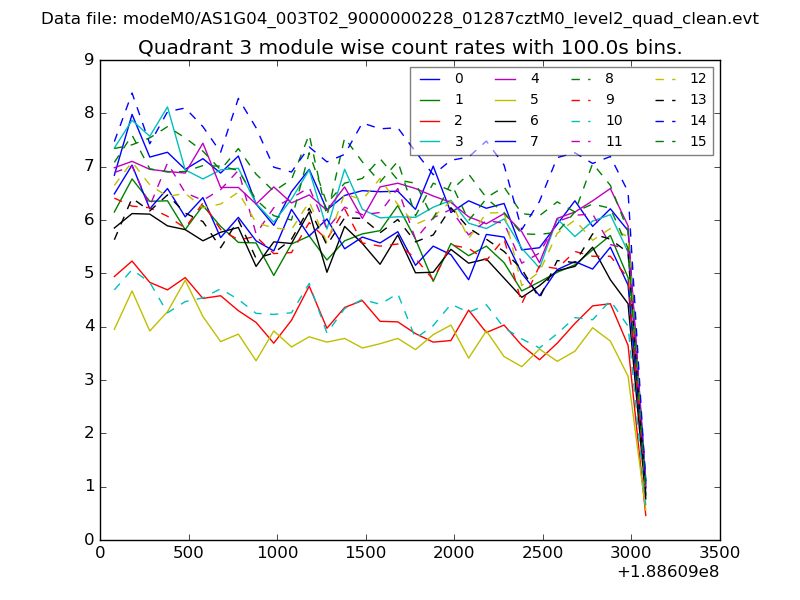
| Module-wise count rates for Quadrant A Data is divided into 100 sec bins |
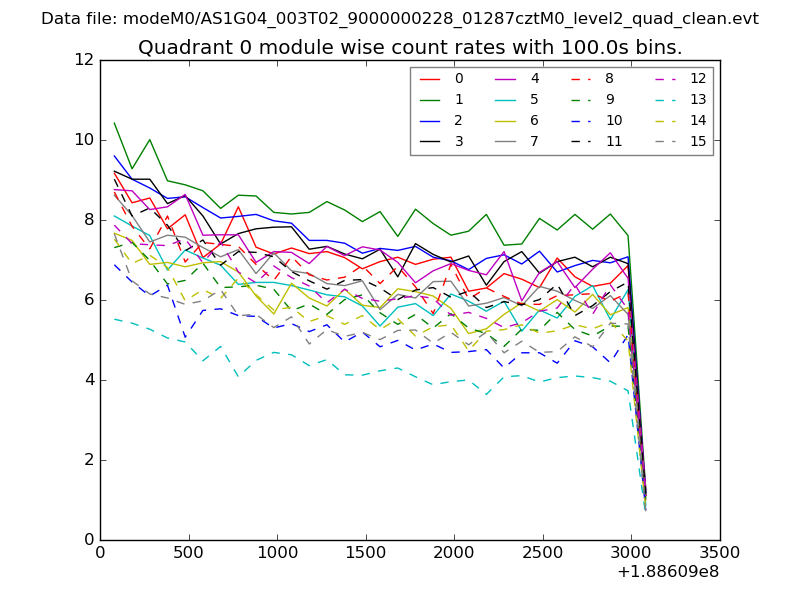 |
 |
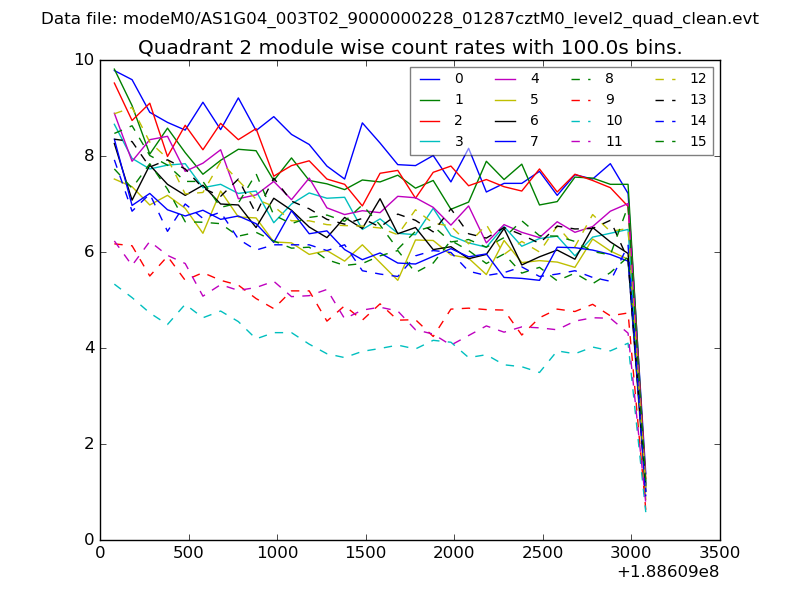
| Module-wise count rates for Quadrant B Data is divided into 100 sec bins |
 |
 |
| Module-wise count rates for Quadrant C Data is divided into 100 sec bins |
 |
 |
| Module-wise count rates for Quadrant D Data is divided into 100 sec bins |
 |
 |
| Parameter | Plot |
|---|---|
| CZT HV Monitor | 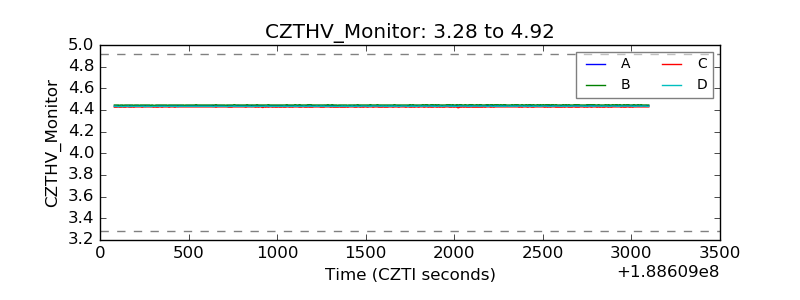 |
| D_VDD | 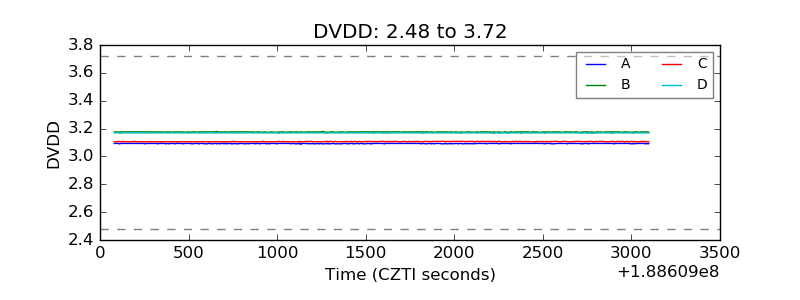 |
| Temperature 1 | 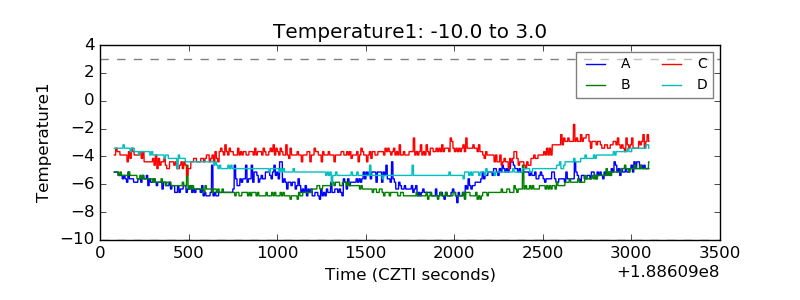 |
| Veto HV Monitor | 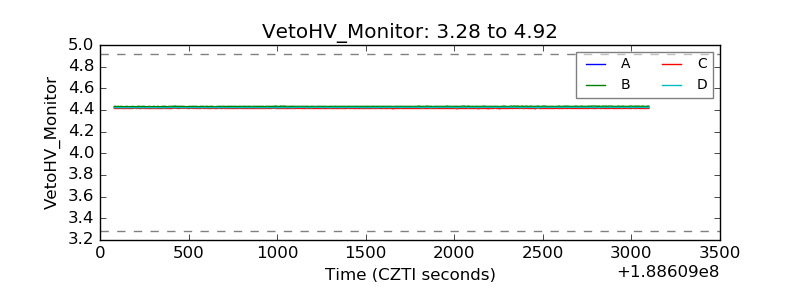 |
| Veto LLD | 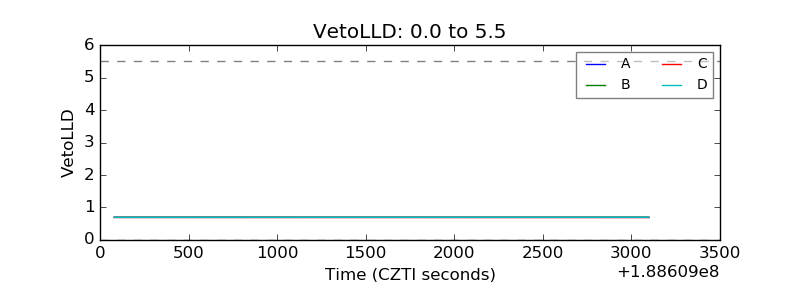 |
| Alpha Counter | 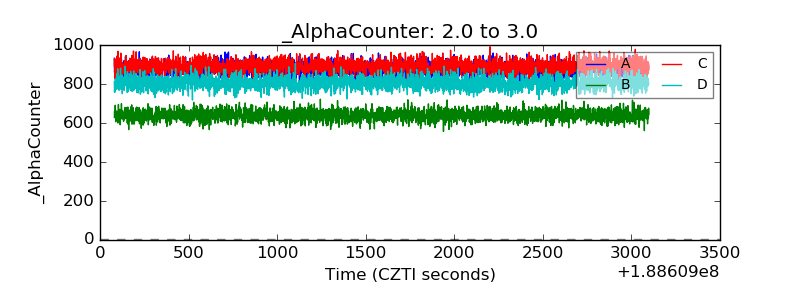 |
| _CPM_Rate | 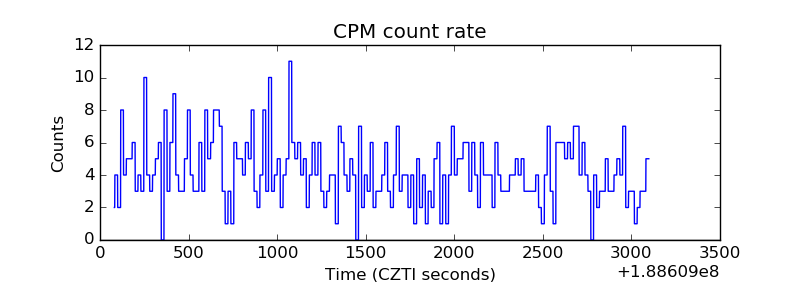 |
| CZT Counter | 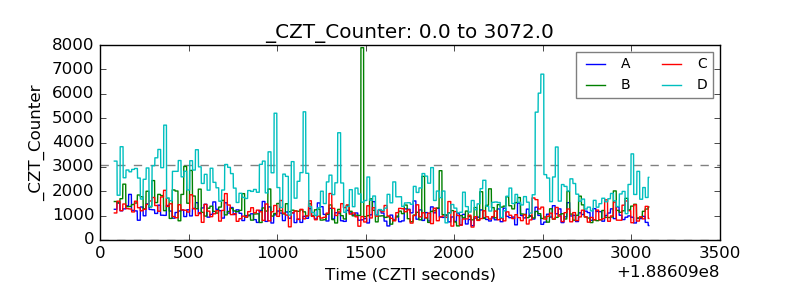 |
| +2.5 Volts monitor | 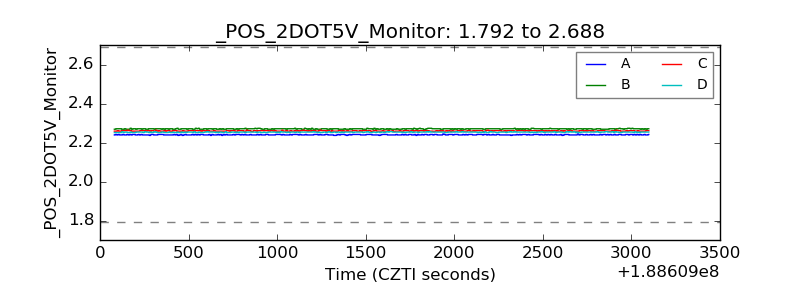 |
| +5 Volts monitor | 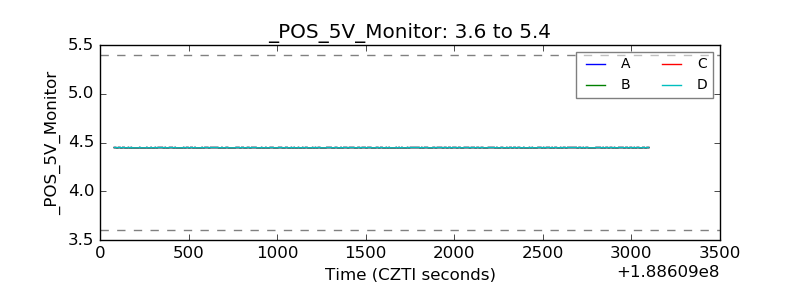 |
| _ROLL_ROT | 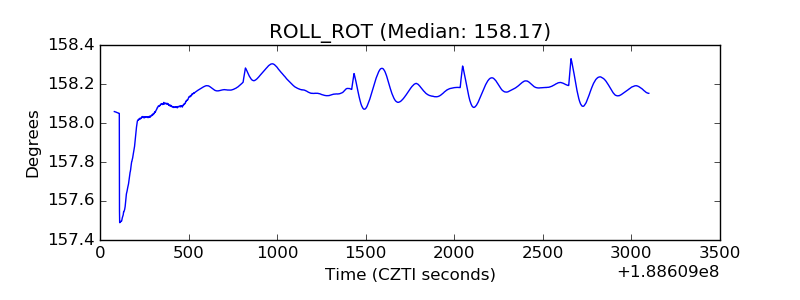 |
| _Roll_DEC | 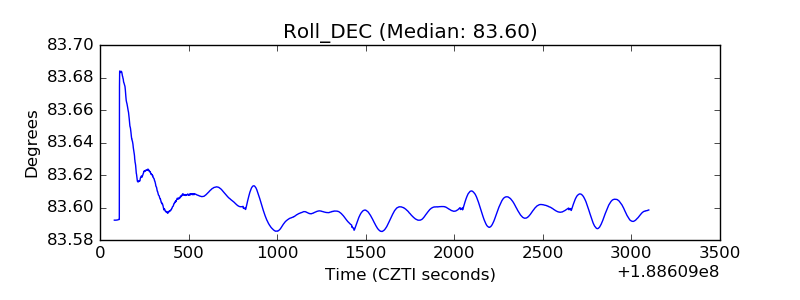 |
| _Roll_RA | 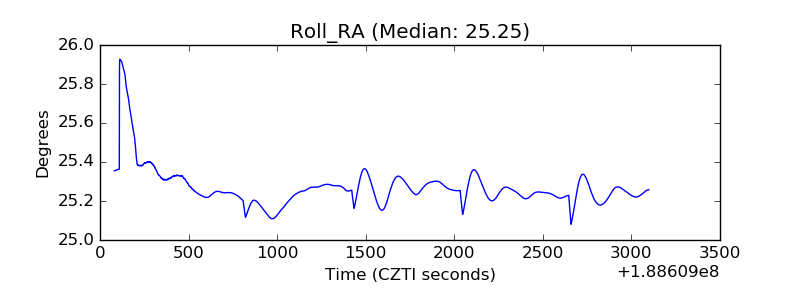 |
| Veto Counter | 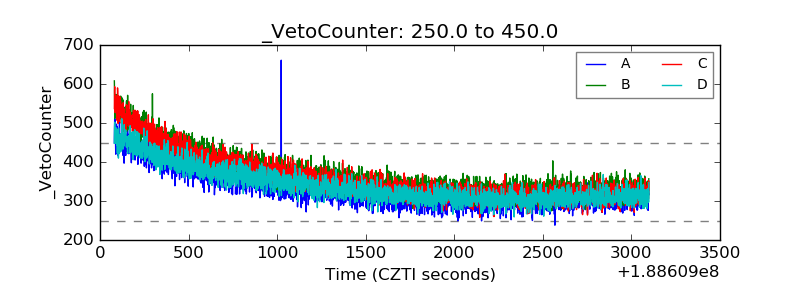 |