| Param | Original file | Final file |
|---|---|---|
| Filename | modeM0/AS1G04_002T02_9000000230_01288cztM0_level2.evt | modeM0/AS1G04_002T02_9000000230_01288cztM0_level2_quad_clean.evt |
| Size (bytes) | 1,243,693,440 | 93,493,440 |
| Size | 1.2 GB | 89.2 MB |
| Events in quadrant A | 7,073,693 | 637,728 |
| Events in quadrant B | 8,259,789 | 646,894 |
| Events in quadrant C | 7,193,285 | 626,286 |
| Events in quadrant D | 14,734,238 | 491,181 |
| Mode M9 | |||
|---|---|---|---|
| Quadrant | BADHDUFLAG | Total packets | Discarded packets |
| A | 0 | 13 | 0 |
| B | 0 | 13 | 0 |
| C | 0 | 13 | 0 |
| D | 0 | 13 | 0 |
| Mode M0 | |||
|---|---|---|---|
| Quadrant | BADHDUFLAG | Total packets | Discarded packets |
| A | 0 | 25351 | 2 |
| B | 0 | 28889 | 1 |
| C | 0 | 25775 | 1 |
| D | 0 | 48409 | 1 |
| Mode SS | |||
|---|---|---|---|
| Quadrant | BADHDUFLAG | Total packets | Discarded packets |
| A | 0 | 124 | 0 |
| B | 0 | 124 | 0 |
| C | 0 | 124 | 0 |
| D | 0 | 124 | 0 |
| Quadrant | Total seconds | Saturated seconds | Saturation percentage |
|---|---|---|---|
| A | 6134 | 11 | 0.179328% |
| B | 6134 | 52 | 0.847734% |
| C | 6134 | 49 | 0.798826% |
| D | 6134 | 2330 | 37.985002% |
Noise dominated data is calculated using 1-second bins in cleaned event files. If a bin has >2000 counts, and if more than 50% of those come from <1% of pixels, then it is considered to be noise-dominated and hence unusable.
| Quadrant | # 1 sec bins | Bins with >0 counts | Bins with >2000 counts | High rate bins dominated by noise | Noise dominated (total time) | Noise dominated (detector-on time) | Marked lightcurve |
|---|---|---|---|---|---|---|---|
| A | 7429 | 6135 | 160 | 160 | 2.15% | 2.61% | 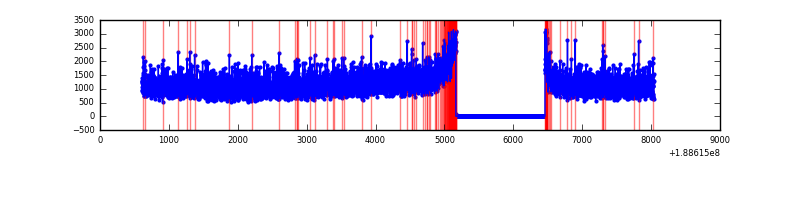 |
| B | 7429 | 6135 | 504 | 504 | 6.78% | 8.22% | 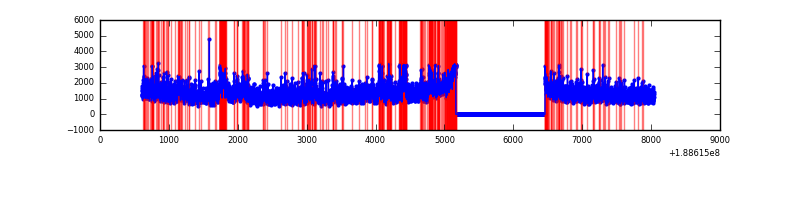 |
| C | 7429 | 6135 | 218 | 218 | 2.93% | 3.55% | 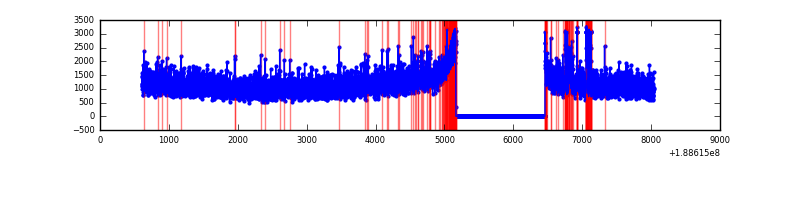 |
| D | 7429 | 6134 | 4184 | 4184 | 56.32% | 68.21% | 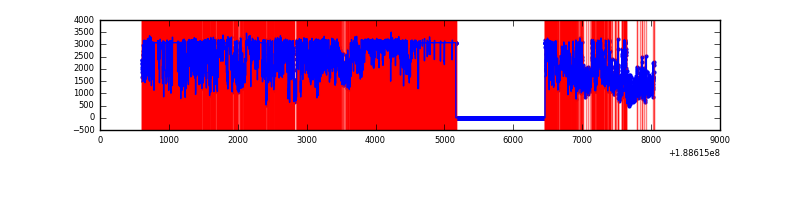 |
Top three noisy pixels from each quadrant. If the there are fewer than three noisy pixels in the level2.evt file, extra rows are filled as -1
| Pixel properties | Quadrant properties | ||||||
|---|---|---|---|---|---|---|---|
| Quadrant | DetID | PixID | Counts | Sigma | Mean | Median | Sigma |
| A | 15 | 233 | 21603 | 44.83 | 1838 | 1851 | 440.6 |
| A | 3 | 111 | 6040 | 9.51 | 1838 | 1851 | 440.6 |
| A | 11 | 79 | 5909 | 9.21 | 1838 | 1851 | 440.6 |
| B | 8 | 4 | 522835 | 1154.14 | 1928 | 1935 | 451.3 |
| B | 0 | 187 | 184022 | 403.44 | 1928 | 1935 | 451.3 |
| B | 10 | 213 | 66410 | 142.86 | 1928 | 1935 | 451.3 |
| C | 15 | 241 | 299838 | 632.35 | 1707 | 1763 | 471.4 |
| C | 9 | 54 | 150093 | 314.67 | 1707 | 1763 | 471.4 |
| C | 8 | 208 | 30665 | 61.31 | 1707 | 1763 | 471.4 |
| D | 13 | 169 | 7433542 | 17141.76 | 1404 | 1450 | 433.6 |
| D | 12 | 22 | 1600439 | 3687.99 | 1404 | 1450 | 433.6 |
| D | 10 | 84 | 224910 | 515.4 | 1404 | 1450 | 433.6 |
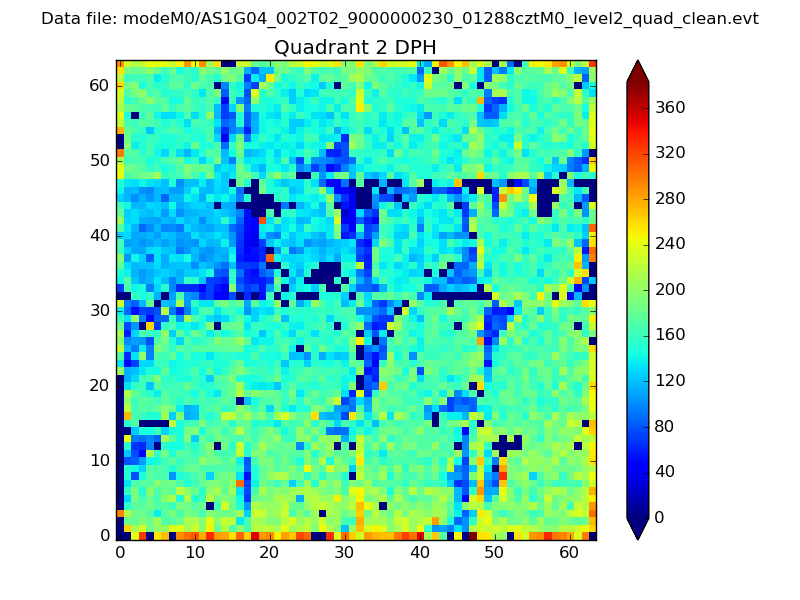
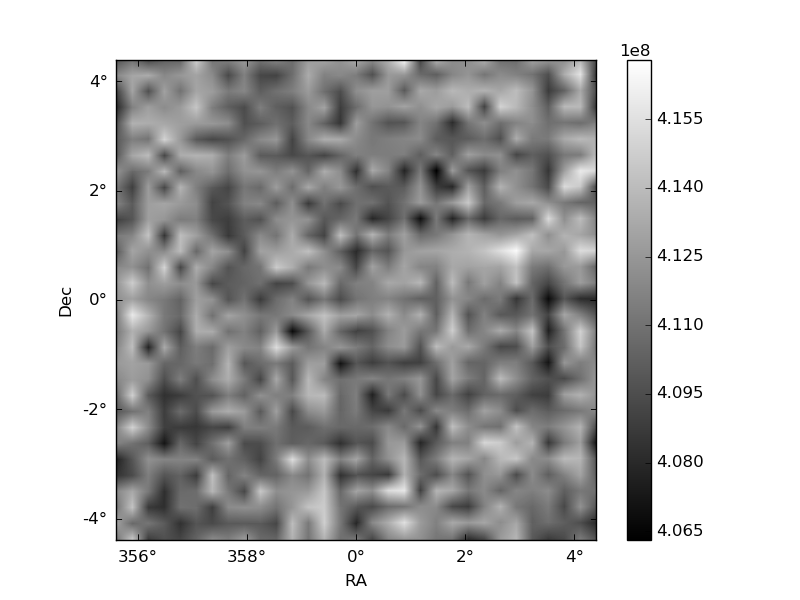
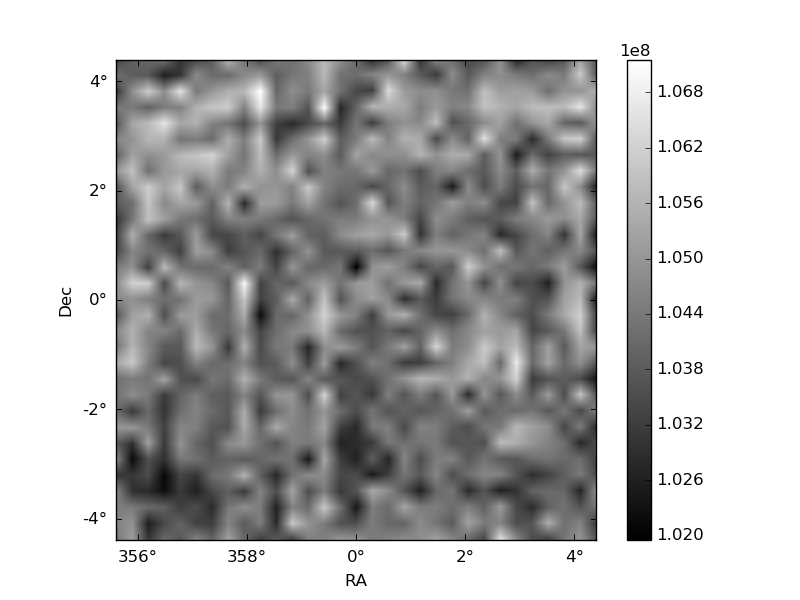
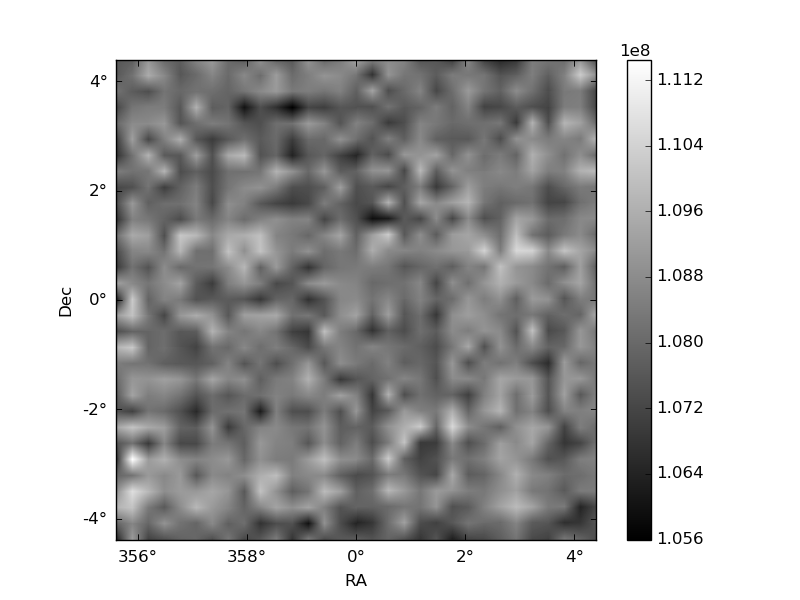
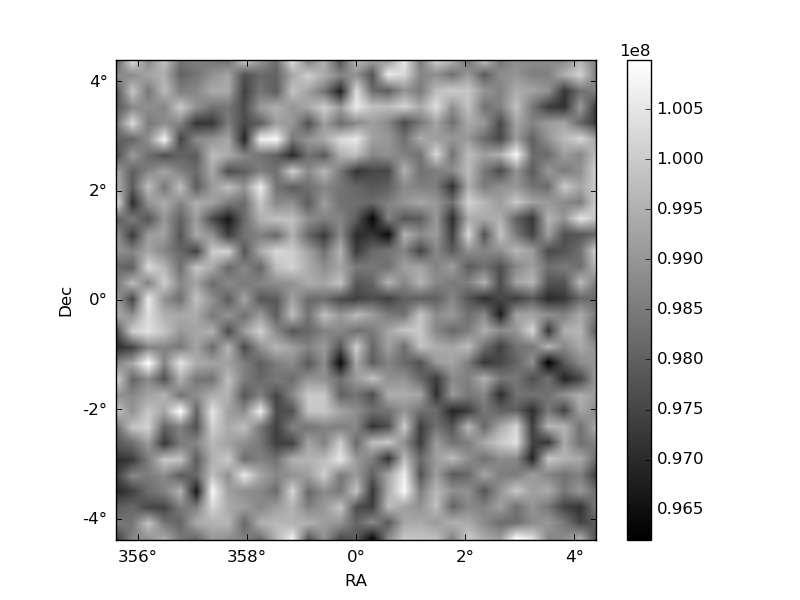
Histogram calculated using DETX and DETY for each event in the final _common_clean file
| Quadrant A | 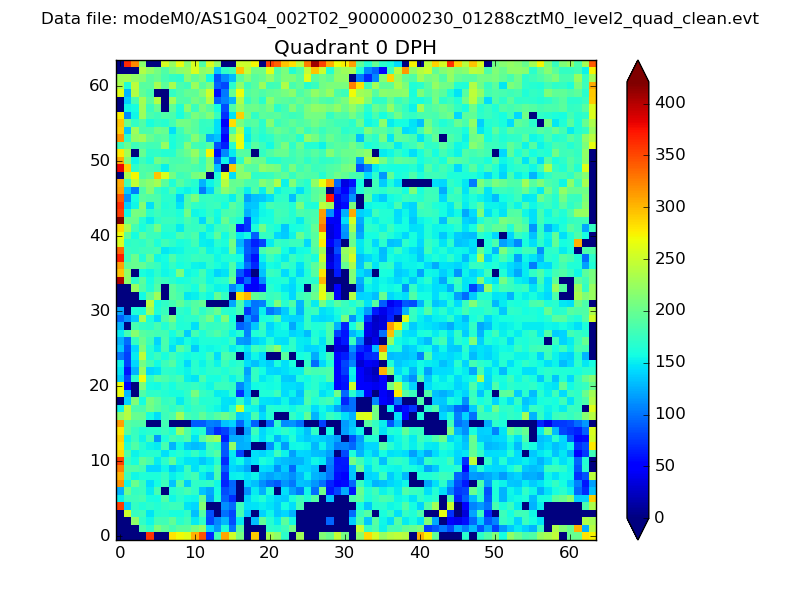 |
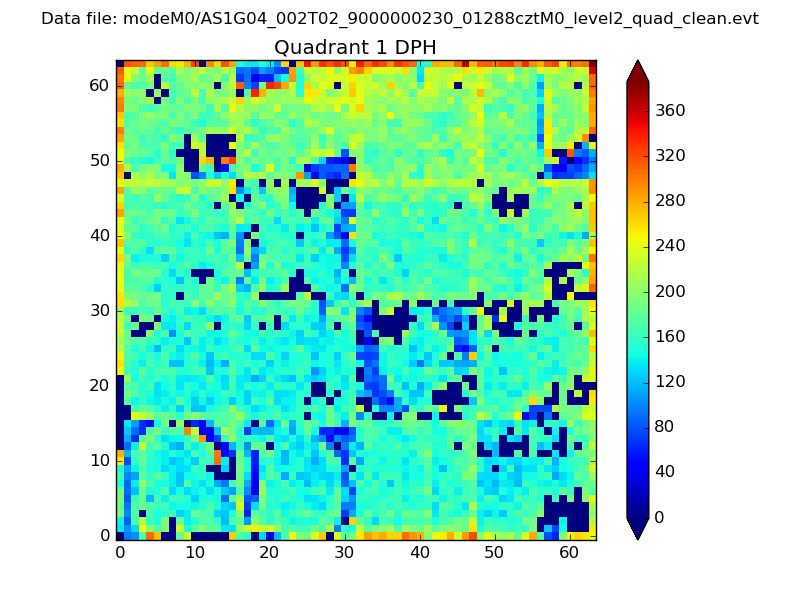 |
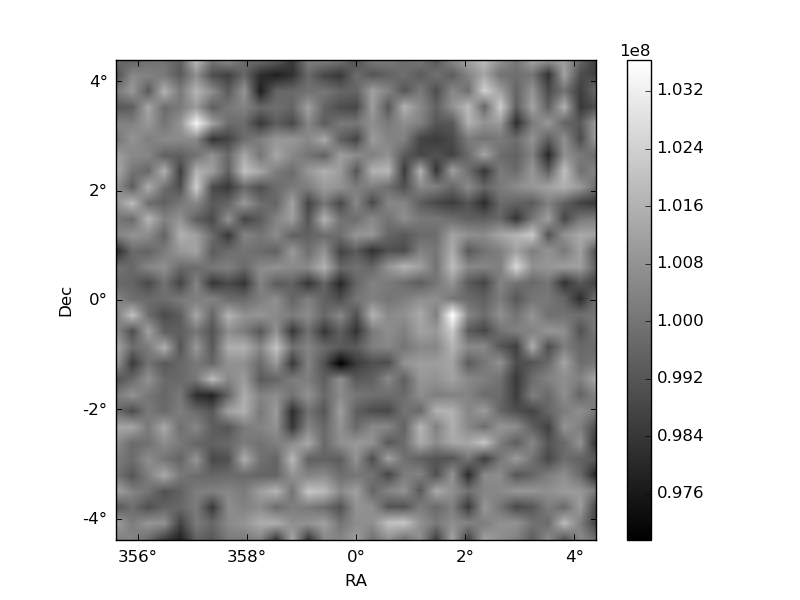
Quadrant B |
|---|---|---|---|
| Quadrant D | 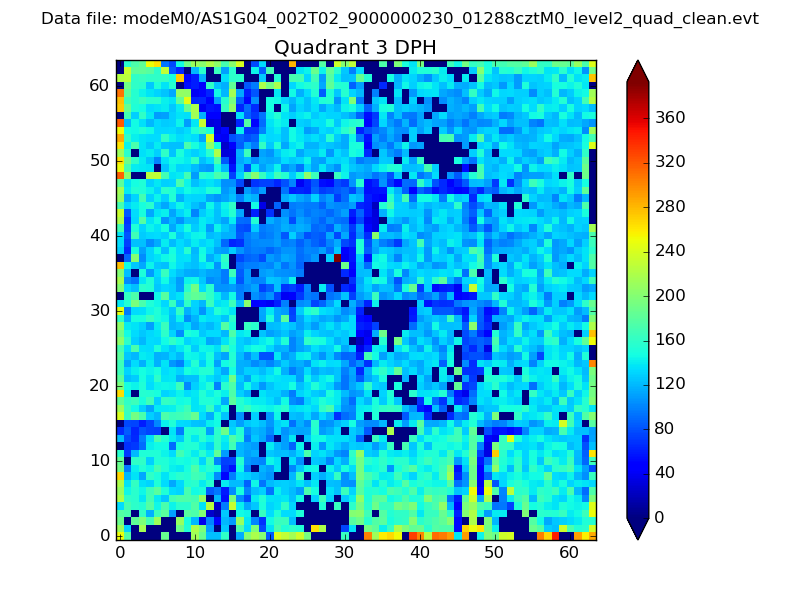 |
 |
Quadrant C |
| Plot type | Count rate plots | Images |
|---|---|---|
| Comparison with Poisson distribution Blue bars denote a histogram of data divided into 1 sec bins. Red curve is a Poisson curve with rate = median count rate of data. |
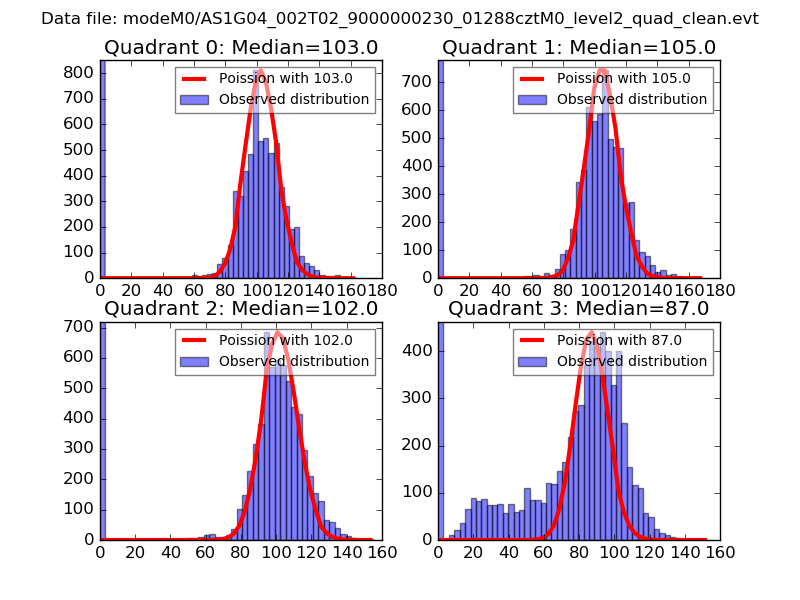 |
 |
| Quadrant-wise count rates Data is divided into 100 sec bins |
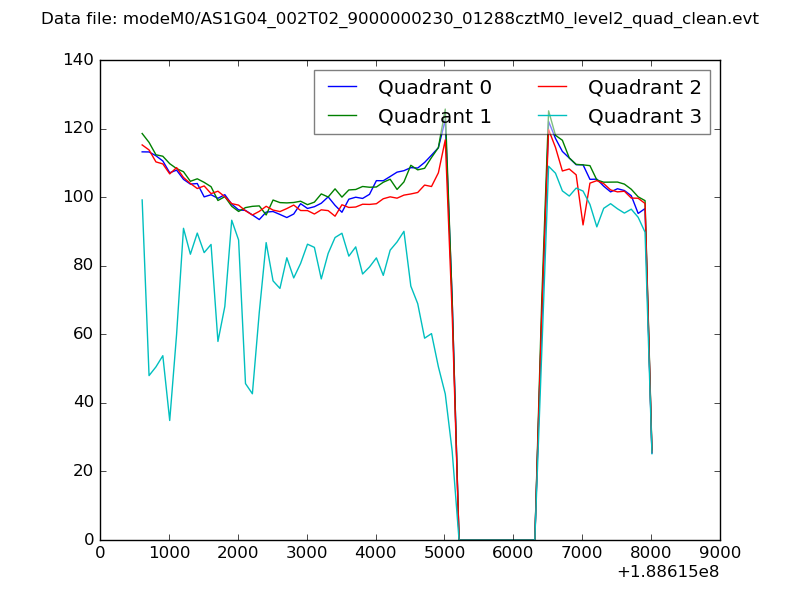 |
|
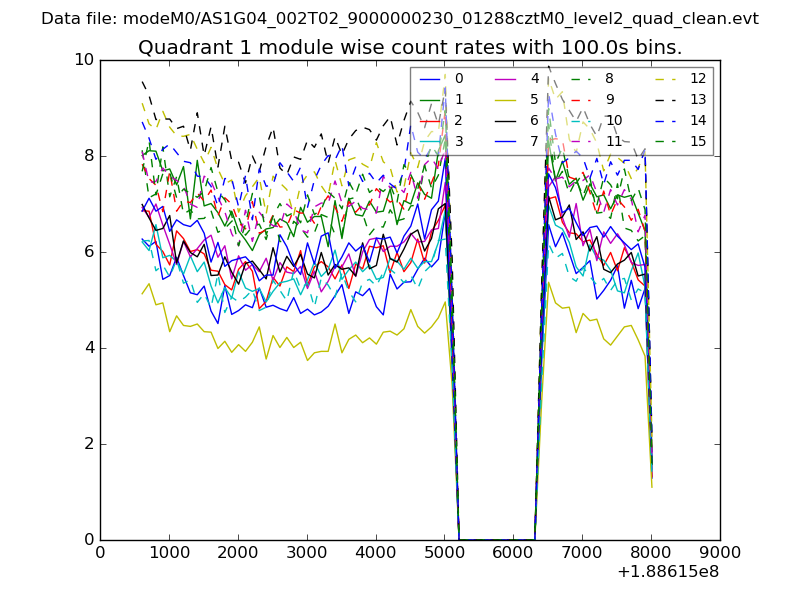
| Module-wise count rates for Quadrant A Data is divided into 100 sec bins |
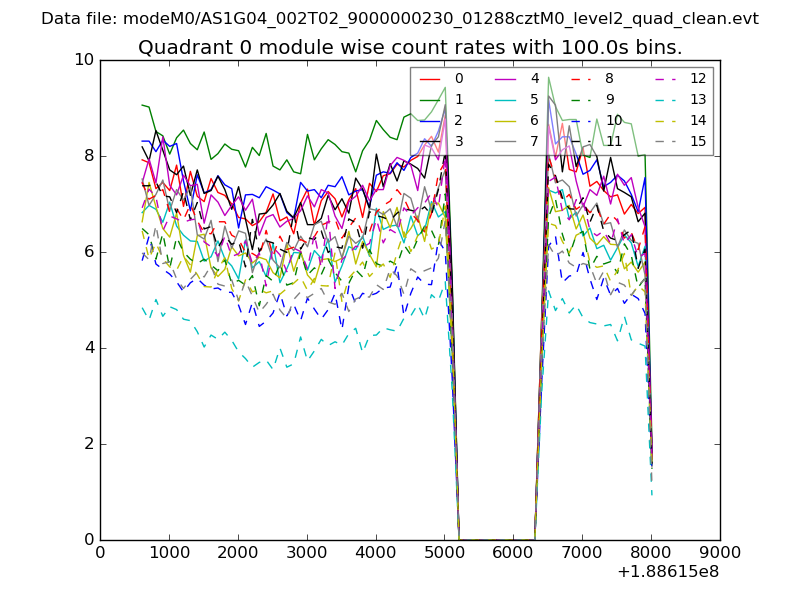 |
 |
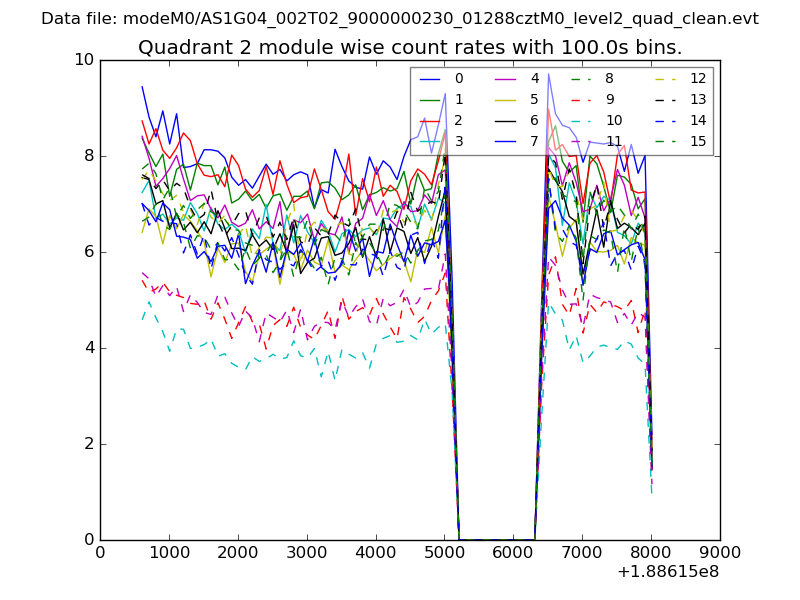
| Module-wise count rates for Quadrant B Data is divided into 100 sec bins |
 |
 |
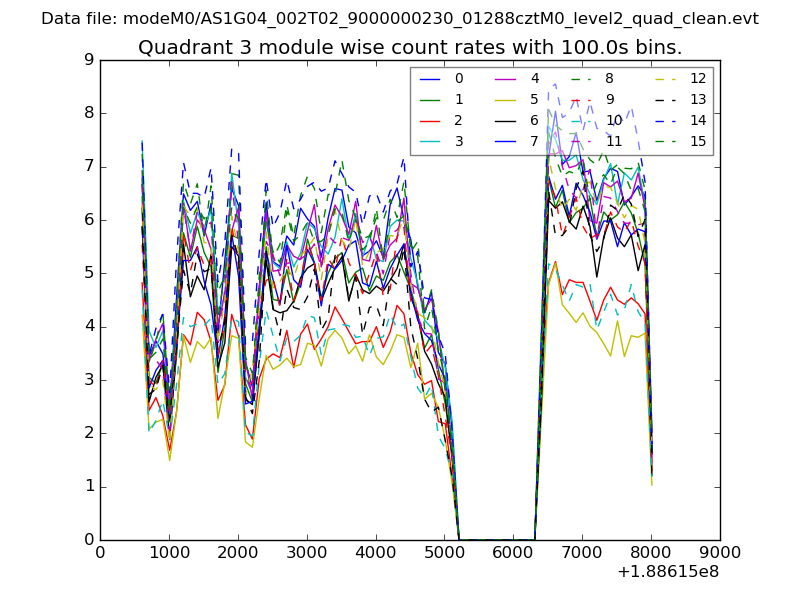
| Module-wise count rates for Quadrant C Data is divided into 100 sec bins |
 |
 |
| Module-wise count rates for Quadrant D Data is divided into 100 sec bins |
 |
 |
| Parameter | Plot |
|---|---|
| CZT HV Monitor | 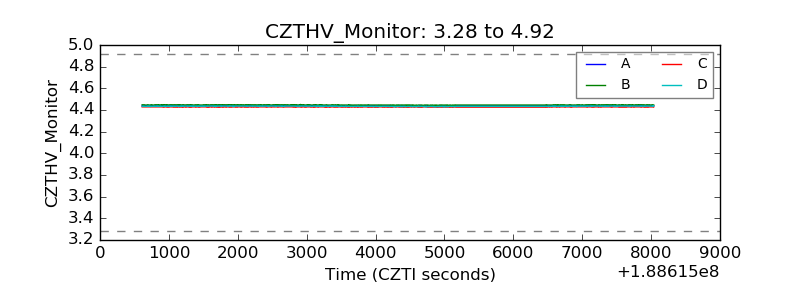 |
| D_VDD | 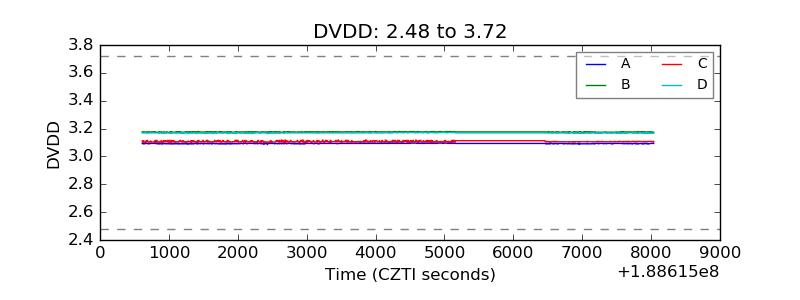 |
| Temperature 1 | 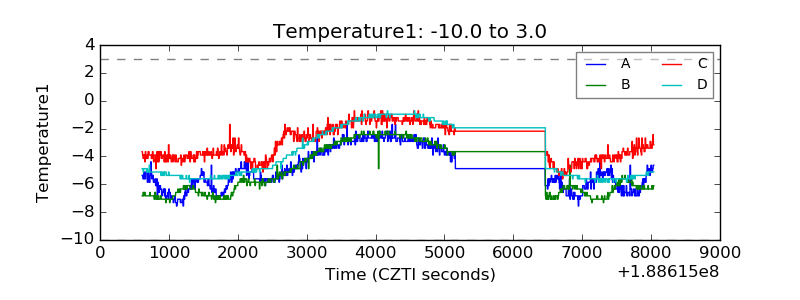 |
| Veto HV Monitor | 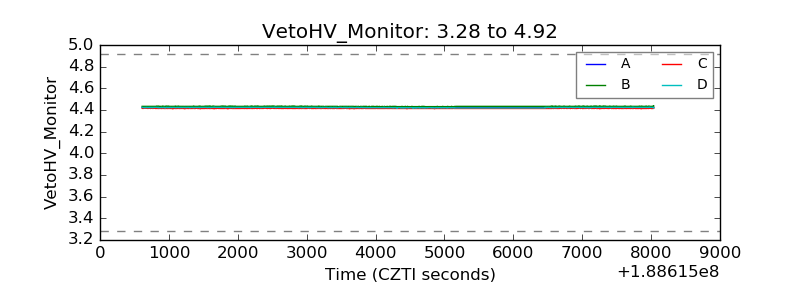 |
| Veto LLD | 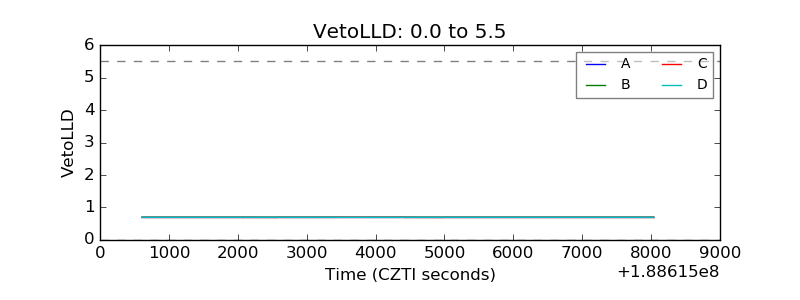 |
| Alpha Counter | 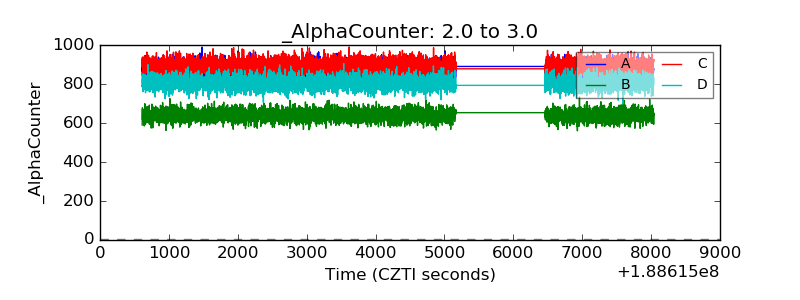 |
| _CPM_Rate | 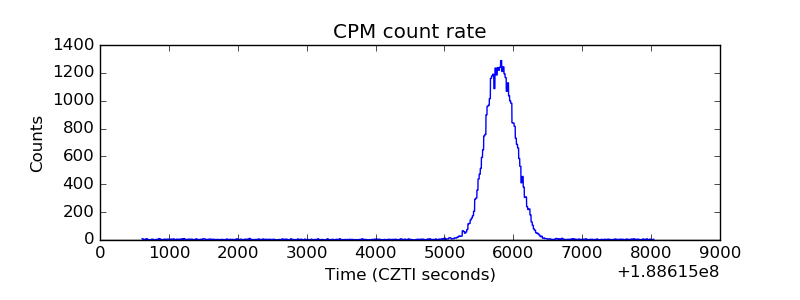 |
| CZT Counter | 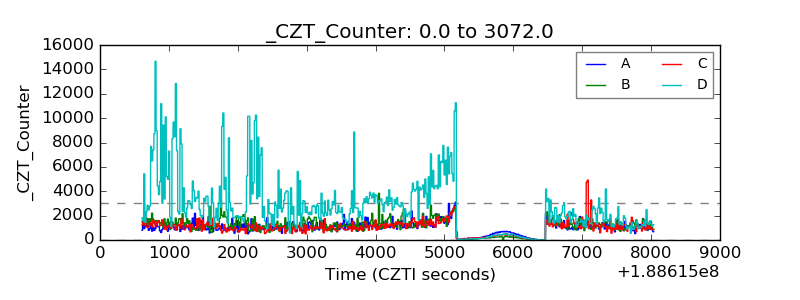 |
| +2.5 Volts monitor |  |
| +5 Volts monitor |  |
| _ROLL_ROT | 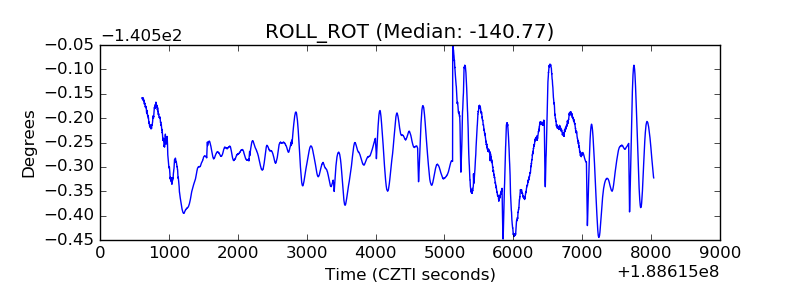 |
| _Roll_DEC | 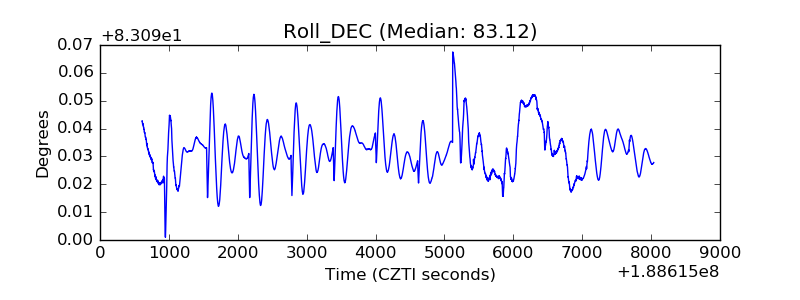 |
| _Roll_RA | 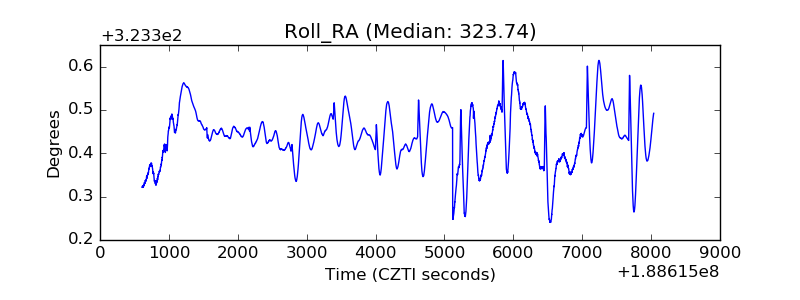 |
| Veto Counter | 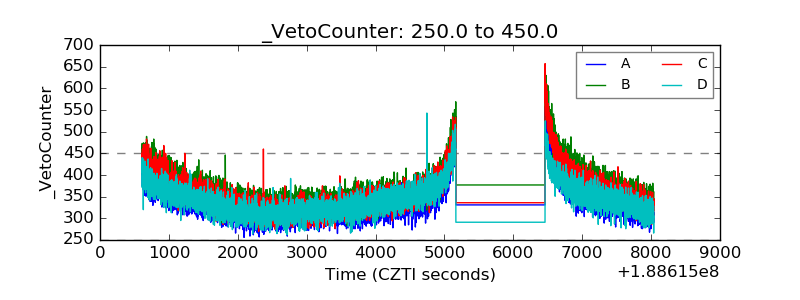 |