| Param | Original file | Final file |
|---|---|---|
| Filename | modeM0/AS1G04_002T02_9000000230_01289cztM0_level2.evt | modeM0/AS1G04_002T02_9000000230_01289cztM0_level2_quad_clean.evt |
| Size (bytes) | 1,177,770,240 | 91,615,680 |
| Size | 1.1 GB | 87.4 MB |
| Events in quadrant A | 7,156,284 | 611,457 |
| Events in quadrant B | 7,757,041 | 621,837 |
| Events in quadrant C | 6,993,644 | 599,159 |
| Events in quadrant D | 13,363,568 | 519,703 |
| Mode M9 | |||
|---|---|---|---|
| Quadrant | BADHDUFLAG | Total packets | Discarded packets |
| A | 0 | 13 | 0 |
| B | 0 | 13 | 0 |
| C | 0 | 13 | 0 |
| D | 0 | 13 | 0 |
| Mode M0 | |||
|---|---|---|---|
| Quadrant | BADHDUFLAG | Total packets | Discarded packets |
| A | 0 | 25566 | 2 |
| B | 0 | 27345 | 1 |
| C | 0 | 25094 | 1 |
| D | 0 | 44167 | 1 |
| Mode SS | |||
|---|---|---|---|
| Quadrant | BADHDUFLAG | Total packets | Discarded packets |
| A | 0 | 122 | 0 |
| B | 0 | 122 | 0 |
| C | 0 | 122 | 0 |
| D | 0 | 122 | 0 |
| Quadrant | Total seconds | Saturated seconds | Saturation percentage |
|---|---|---|---|
| A | 6038 | 61 | 1.010268% |
| B | 6038 | 26 | 0.430606% |
| C | 6038 | 37 | 0.612786% |
| D | 6038 | 1634 | 27.061941% |
Noise dominated data is calculated using 1-second bins in cleaned event files. If a bin has >2000 counts, and if more than 50% of those come from <1% of pixels, then it is considered to be noise-dominated and hence unusable.
| Quadrant | # 1 sec bins | Bins with >0 counts | Bins with >2000 counts | High rate bins dominated by noise | Noise dominated (total time) | Noise dominated (detector-on time) | Marked lightcurve |
|---|---|---|---|---|---|---|---|
| A | 7278 | 6039 | 259 | 259 | 3.56% | 4.29% | 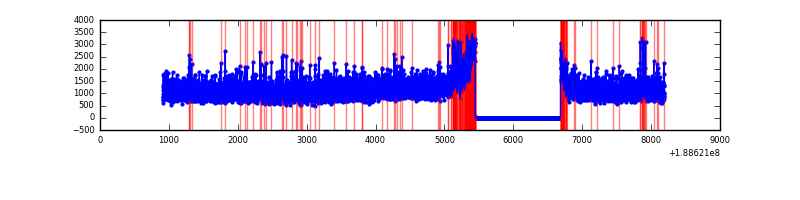 |
| B | 7278 | 6038 | 361 | 361 | 4.96% | 5.98% | 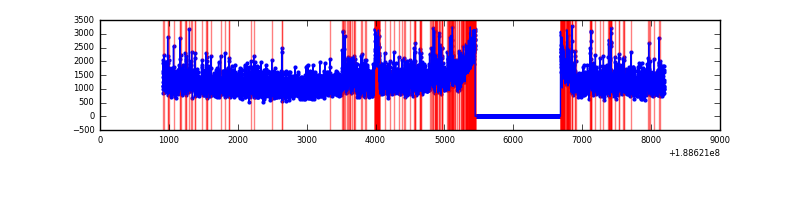 |
| C | 7278 | 6039 | 195 | 195 | 2.68% | 3.23% | 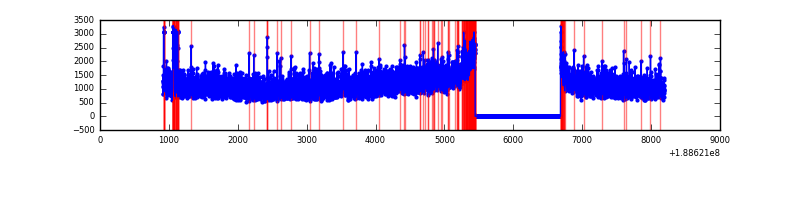 |
| D | 7278 | 6038 | 3495 | 3495 | 48.02% | 57.88% | 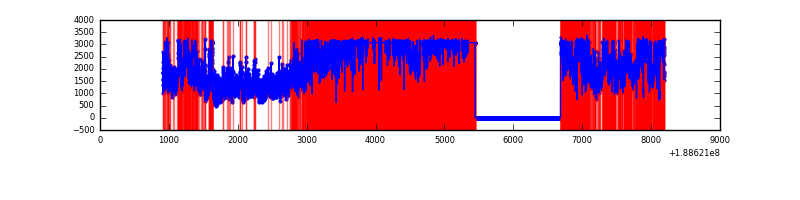 |
Top three noisy pixels from each quadrant. If the there are fewer than three noisy pixels in the level2.evt file, extra rows are filled as -1
| Pixel properties | Quadrant properties | ||||||
|---|---|---|---|---|---|---|---|
| Quadrant | DetID | PixID | Counts | Sigma | Mean | Median | Sigma |
| A | 4 | 32 | 194148 | 444.59 | 1812 | 1825 | 432.6 |
| A | 11 | 79 | 8069 | 14.43 | 1812 | 1825 | 432.6 |
| A | 3 | 111 | 5890 | 9.4 | 1812 | 1825 | 432.6 |
| B | 10 | 213 | 196476 | 439.73 | 1885 | 1894 | 442.5 |
| B | 12 | 52 | 132279 | 294.65 | 1885 | 1894 | 442.5 |
| B | 8 | 4 | 89759 | 198.56 | 1885 | 1894 | 442.5 |
| C | 15 | 241 | 267429 | 570.96 | 1678 | 1735 | 465.3 |
| C | 9 | 54 | 120236 | 254.65 | 1678 | 1735 | 465.3 |
| C | 3 | 111 | 19953 | 39.15 | 1678 | 1735 | 465.3 |
| D | 13 | 169 | 7142349 | 15437.06 | 1501 | 1553 | 462.6 |
| D | 1 | 83 | 272884 | 586.57 | 1501 | 1553 | 462.6 |
| D | 10 | 84 | 227870 | 489.25 | 1501 | 1553 | 462.6 |
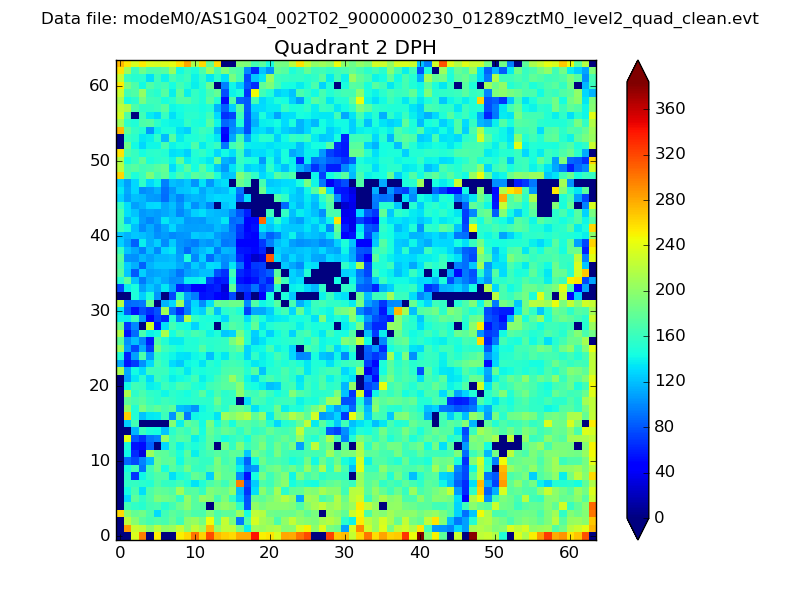
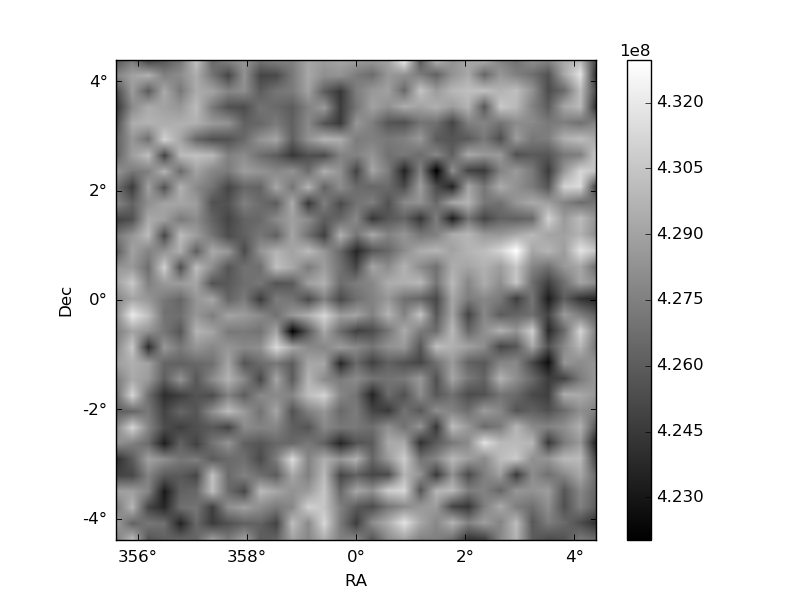
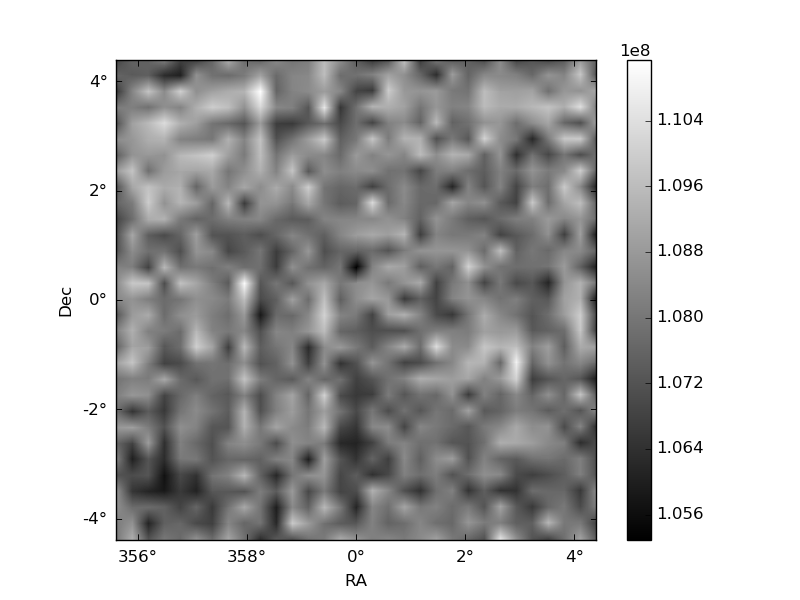
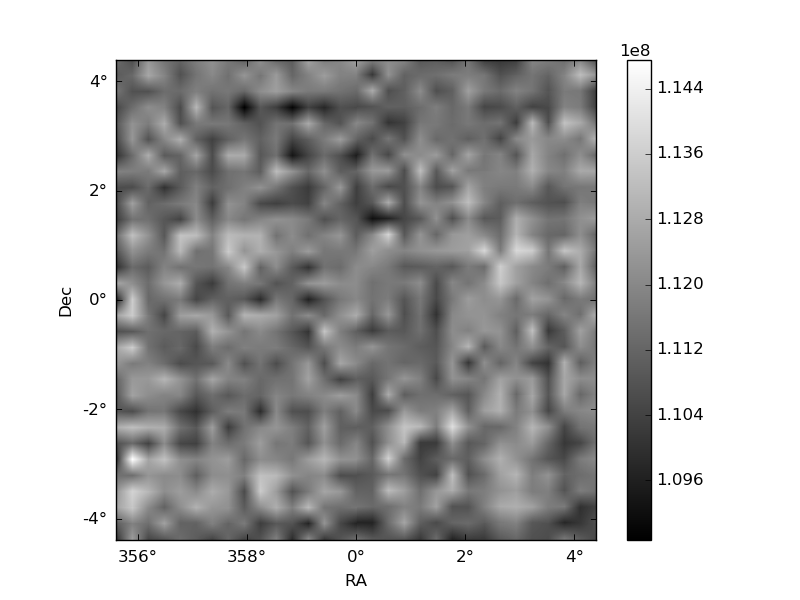
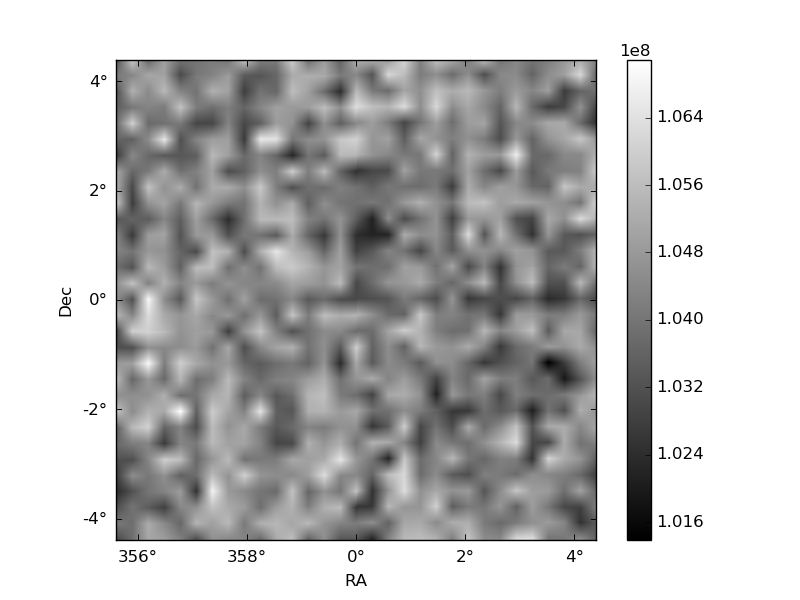
Histogram calculated using DETX and DETY for each event in the final _common_clean file
| Quadrant A | 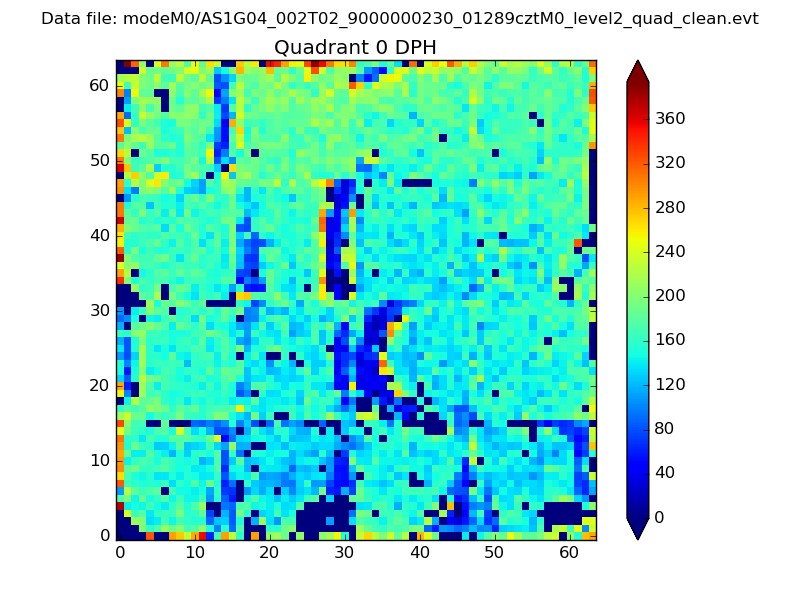 |
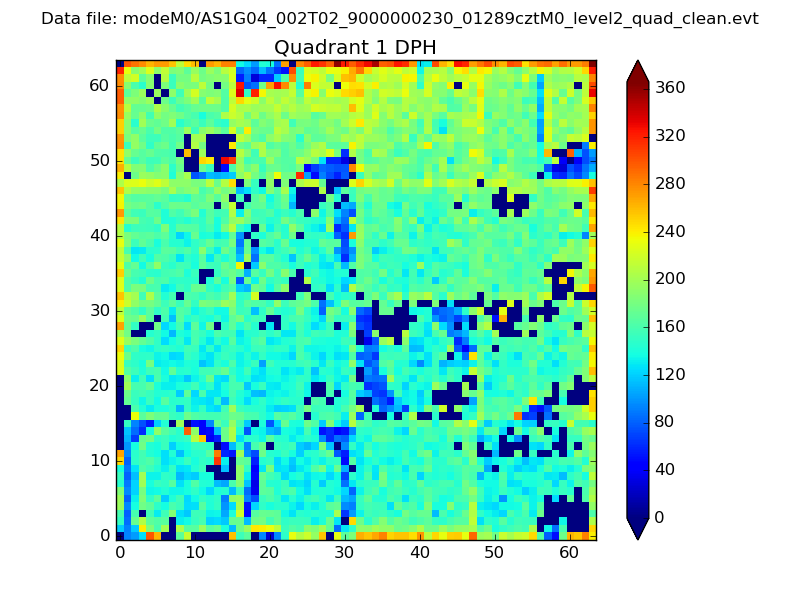 |
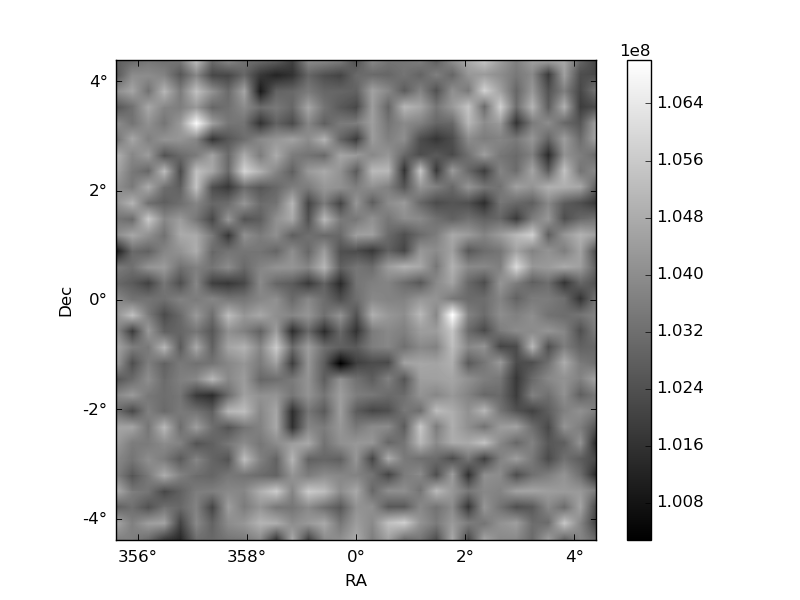
Quadrant B |
|---|---|---|---|
| Quadrant D | 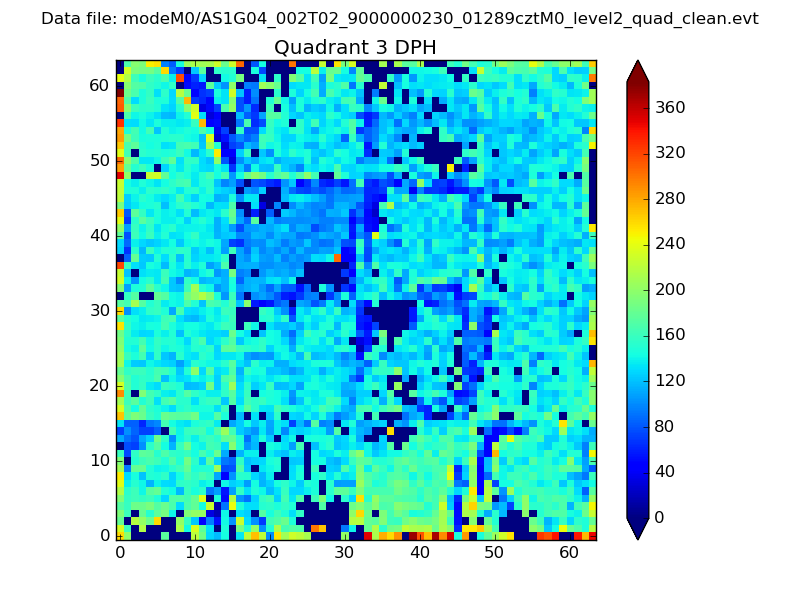 |
 |
Quadrant C |
| Plot type | Count rate plots | Images |
|---|---|---|
| Comparison with Poisson distribution Blue bars denote a histogram of data divided into 1 sec bins. Red curve is a Poisson curve with rate = median count rate of data. |
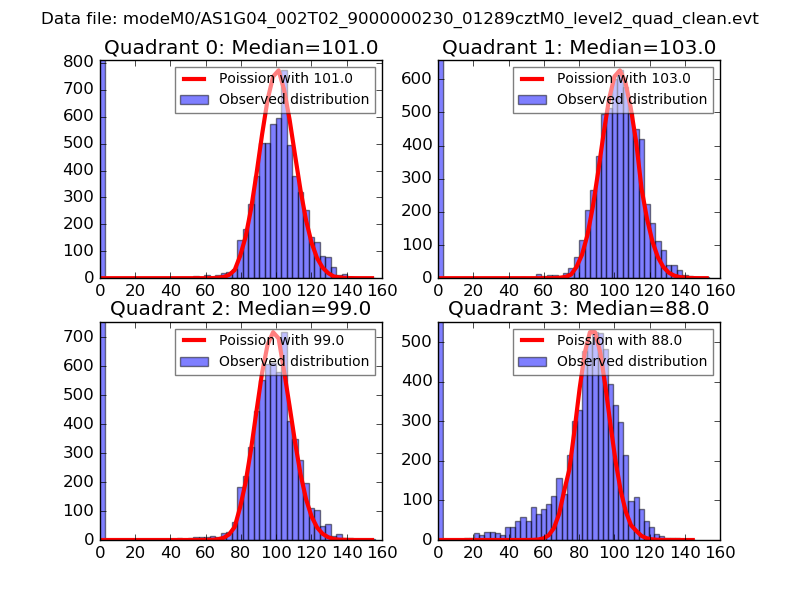 |
 |
| Quadrant-wise count rates Data is divided into 100 sec bins |
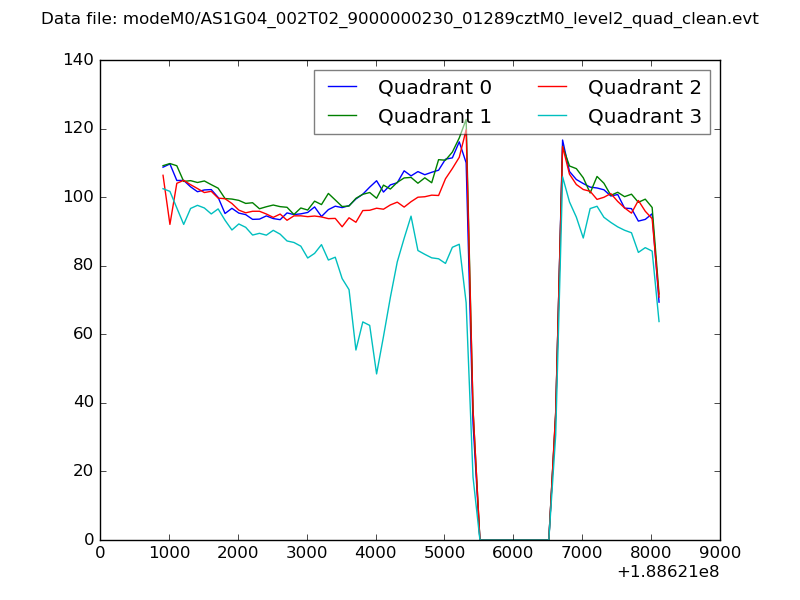 |
|
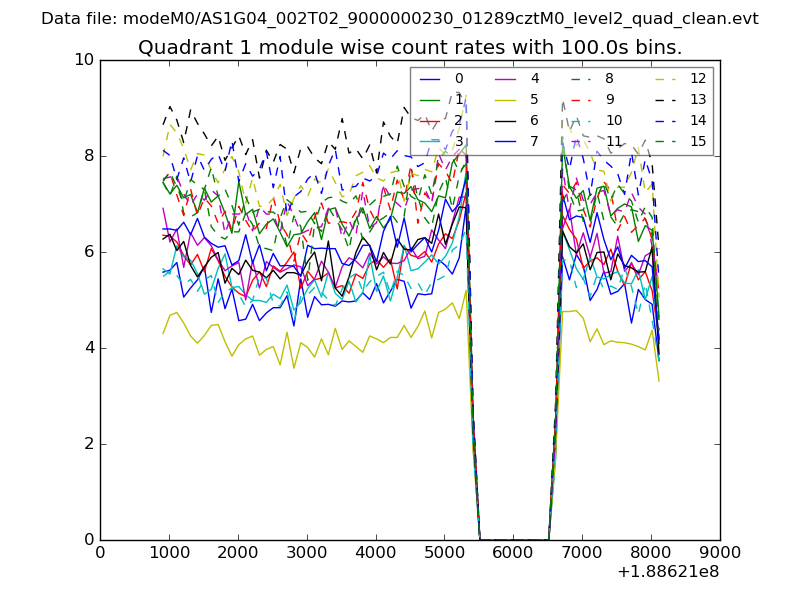
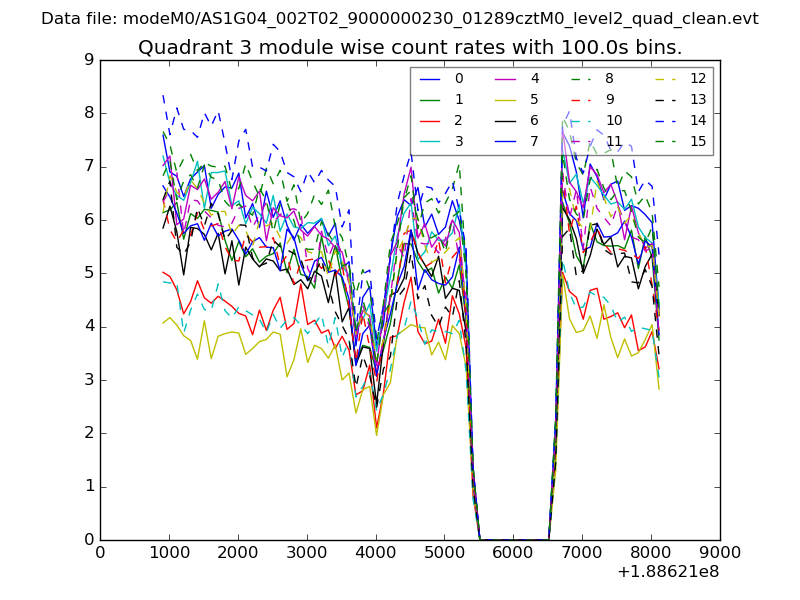
| Module-wise count rates for Quadrant A Data is divided into 100 sec bins |
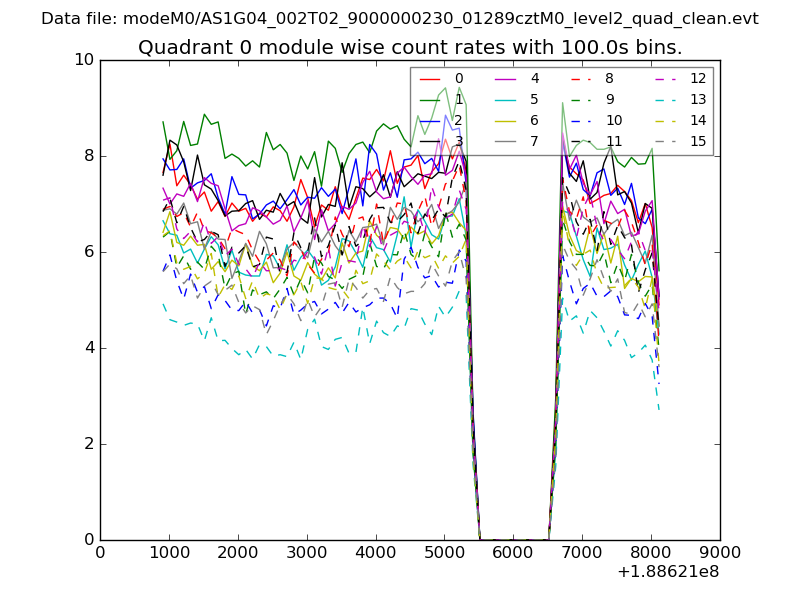 |
 |
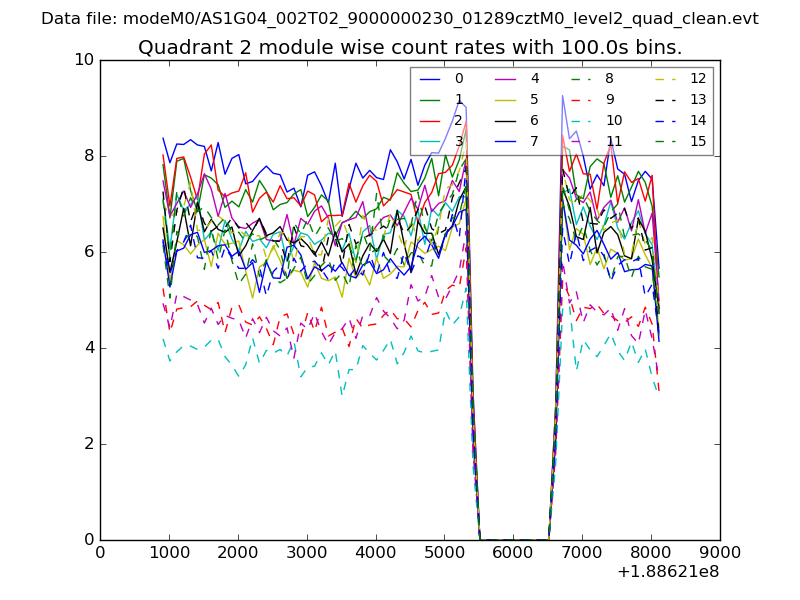
| Module-wise count rates for Quadrant B Data is divided into 100 sec bins |
 |
 |
| Module-wise count rates for Quadrant C Data is divided into 100 sec bins |
 |
 |
| Module-wise count rates for Quadrant D Data is divided into 100 sec bins |
 |
 |
| Parameter | Plot |
|---|---|
| CZT HV Monitor | 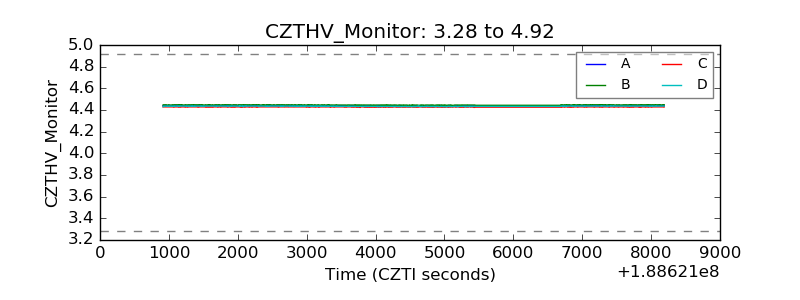 |
| D_VDD |  |
| Temperature 1 | 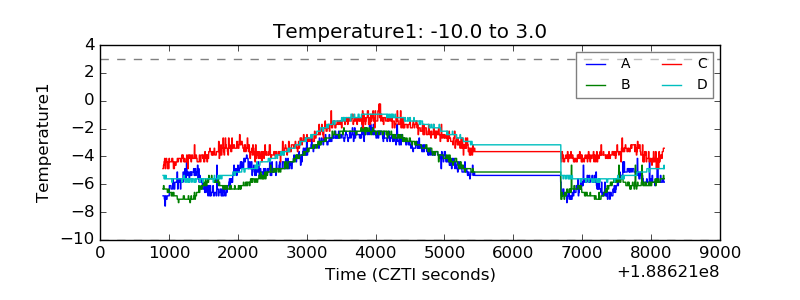 |
| Veto HV Monitor | 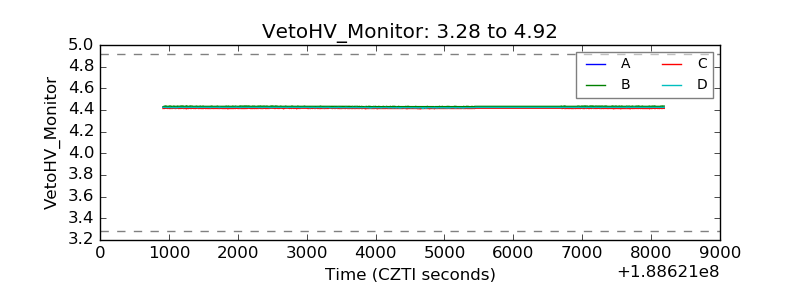 |
| Veto LLD | 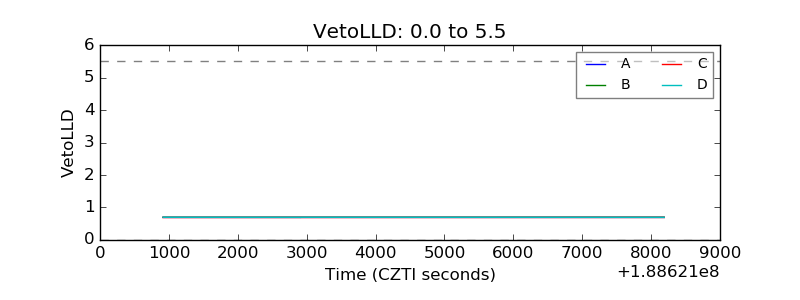 |
| Alpha Counter | 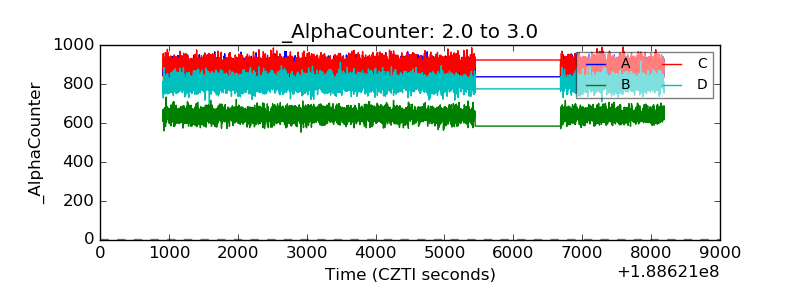 |
| _CPM_Rate | 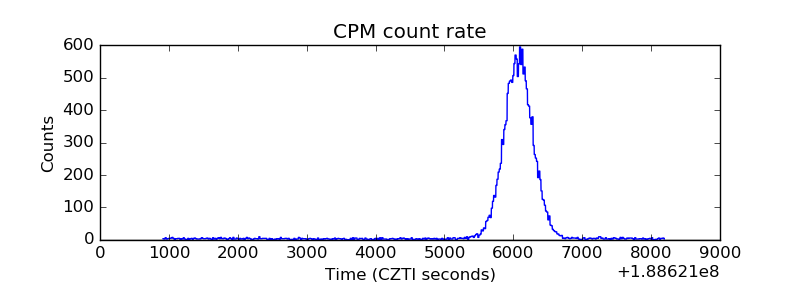 |
| CZT Counter | 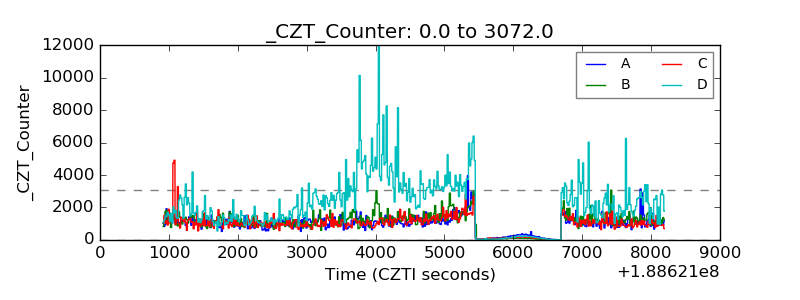 |
| +2.5 Volts monitor |  |
| +5 Volts monitor |  |
| _ROLL_ROT | 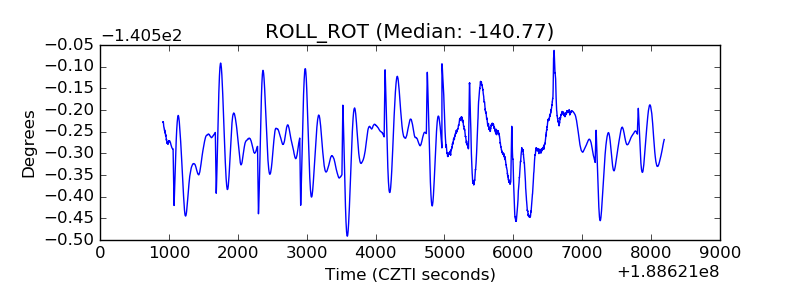 |
| _Roll_DEC | 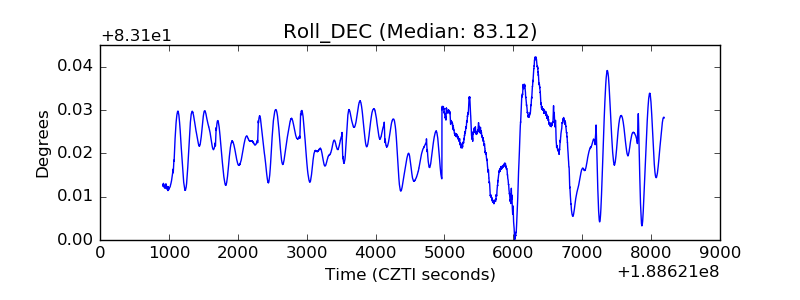 |
| _Roll_RA | 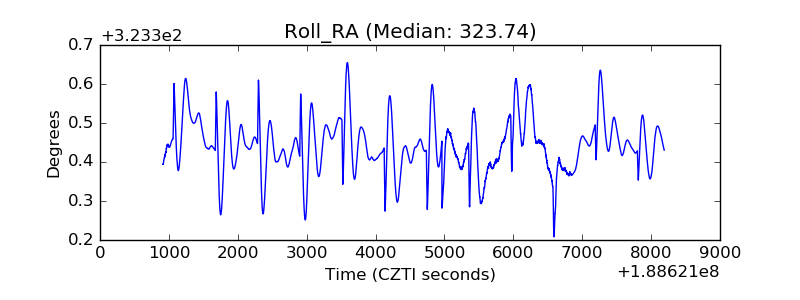 |
| Veto Counter | 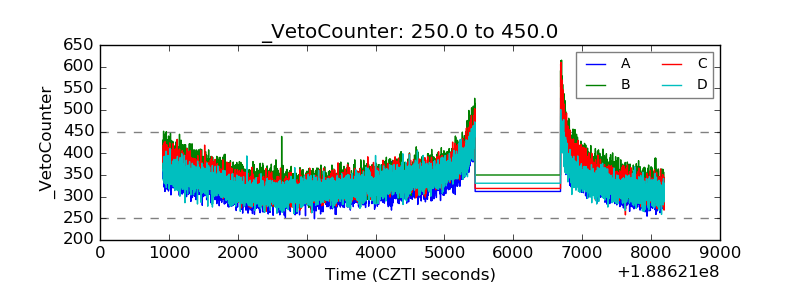 |