| Param | Original file | Final file |
|---|---|---|
| Filename | modeM0/AS1G04_002T02_9000000230_01290cztM0_level2.evt | modeM0/AS1G04_002T02_9000000230_01290cztM0_level2_quad_clean.evt |
| Size (bytes) | 1,243,647,360 | 86,941,440 |
| Size | 1.2 GB | 82.9 MB |
| Events in quadrant A | 7,144,968 | 592,772 |
| Events in quadrant B | 8,411,448 | 592,009 |
| Events in quadrant C | 6,915,319 | 576,875 |
| Events in quadrant D | 14,799,964 | 454,103 |
| Mode M9 | |||
|---|---|---|---|
| Quadrant | BADHDUFLAG | Total packets | Discarded packets |
| A | 0 | 10 | 0 |
| B | 0 | 10 | 0 |
| C | 0 | 10 | 0 |
| D | 0 | 10 | 0 |
| Mode M0 | |||
|---|---|---|---|
| Quadrant | BADHDUFLAG | Total packets | Discarded packets |
| A | 0 | 25454 | 2 |
| B | 0 | 29232 | 1 |
| C | 0 | 24791 | 1 |
| D | 0 | 48517 | 1 |
| Mode SS | |||
|---|---|---|---|
| Quadrant | BADHDUFLAG | Total packets | Discarded packets |
| A | 0 | 120 | 0 |
| B | 0 | 120 | 0 |
| C | 0 | 120 | 0 |
| D | 0 | 120 | 0 |
| Quadrant | Total seconds | Saturated seconds | Saturation percentage |
|---|---|---|---|
| A | 5956 | 32 | 0.537273% |
| B | 5956 | 112 | 1.880457% |
| C | 5956 | 9 | 0.151108% |
| D | 5956 | 2430 | 40.799194% |
Noise dominated data is calculated using 1-second bins in cleaned event files. If a bin has >2000 counts, and if more than 50% of those come from <1% of pixels, then it is considered to be noise-dominated and hence unusable.
| Quadrant | # 1 sec bins | Bins with >0 counts | Bins with >2000 counts | High rate bins dominated by noise | Noise dominated (total time) | Noise dominated (detector-on time) | Marked lightcurve |
|---|---|---|---|---|---|---|---|
| A | 6896 | 5956 | 233 | 233 | 3.38% | 3.91% | 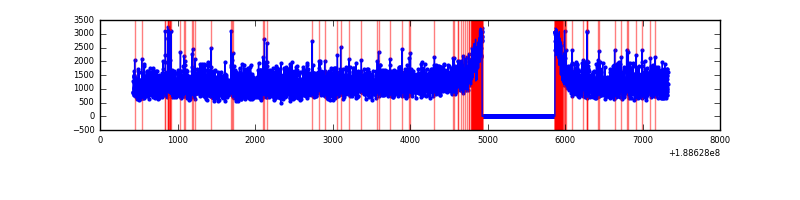 |
| B | 6896 | 5956 | 631 | 631 | 9.15% | 10.59% | 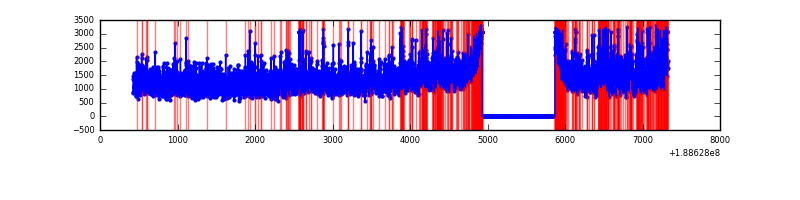 |
| C | 6896 | 5957 | 202 | 202 | 2.93% | 3.39% | 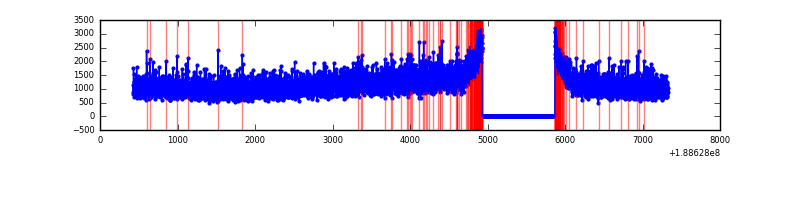 |
| D | 6896 | 5956 | 4334 | 4334 | 62.85% | 72.77% | 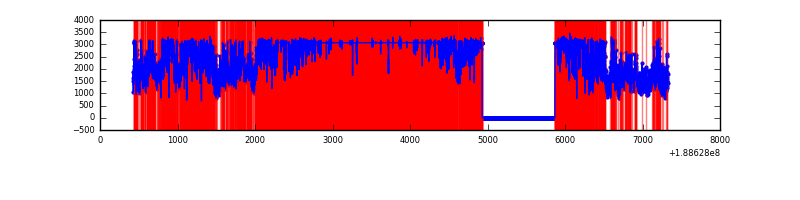 |
Top three noisy pixels from each quadrant. If the there are fewer than three noisy pixels in the level2.evt file, extra rows are filled as -1
| Pixel properties | Quadrant properties | ||||||
|---|---|---|---|---|---|---|---|
| Quadrant | DetID | PixID | Counts | Sigma | Mean | Median | Sigma |
| A | 4 | 32 | 93757 | 207.74 | 1834 | 1849 | 442.4 |
| A | 15 | 127 | 10123 | 18.7 | 1834 | 1849 | 442.4 |
| A | 11 | 79 | 8208 | 14.37 | 1834 | 1849 | 442.4 |
| B | 10 | 213 | 458964 | 1025.23 | 1896 | 1901 | 445.8 |
| B | 8 | 4 | 323878 | 722.22 | 1896 | 1901 | 445.8 |
| B | 12 | 52 | 129779 | 286.84 | 1896 | 1901 | 445.8 |
| C | 15 | 241 | 269063 | 567.4 | 1688 | 1738 | 471.1 |
| C | 3 | 79 | 25490 | 50.41 | 1688 | 1738 | 471.1 |
| C | 3 | 111 | 21969 | 42.94 | 1688 | 1738 | 471.1 |
| D | 13 | 169 | 8896154 | 20314.95 | 1418 | 1466 | 437.8 |
| D | 2 | 252 | 456854 | 1040.08 | 1418 | 1466 | 437.8 |
| D | 10 | 84 | 52986 | 117.67 | 1418 | 1466 | 437.8 |
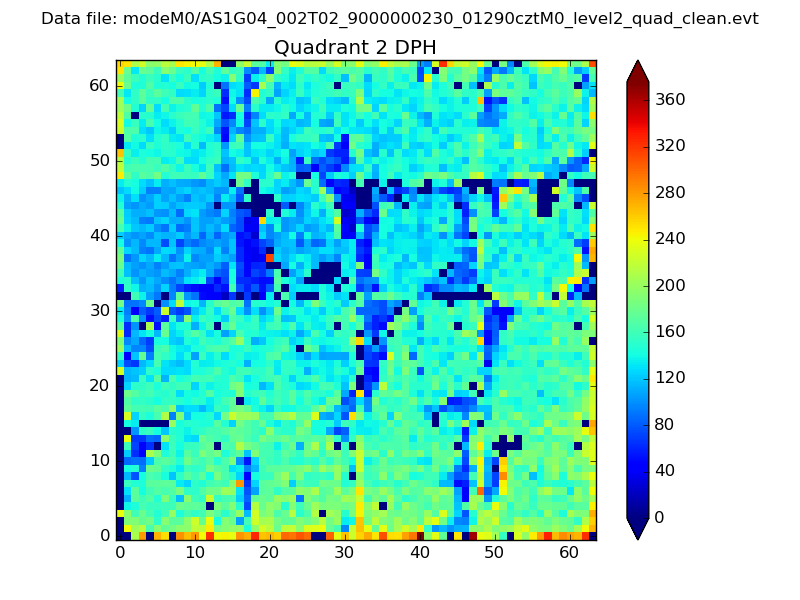
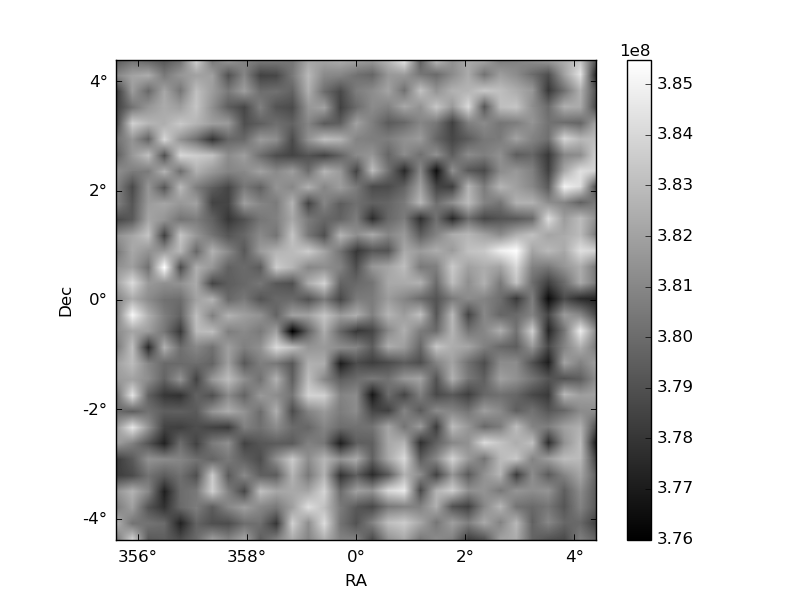
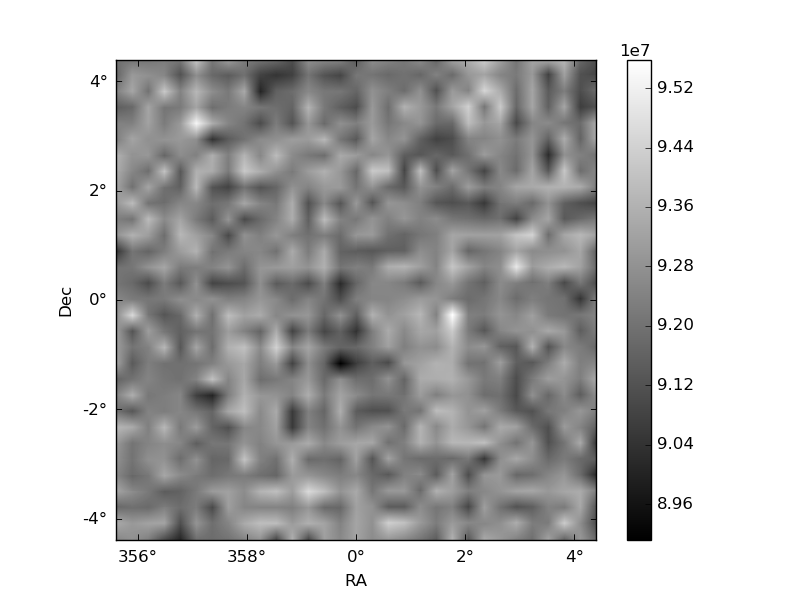
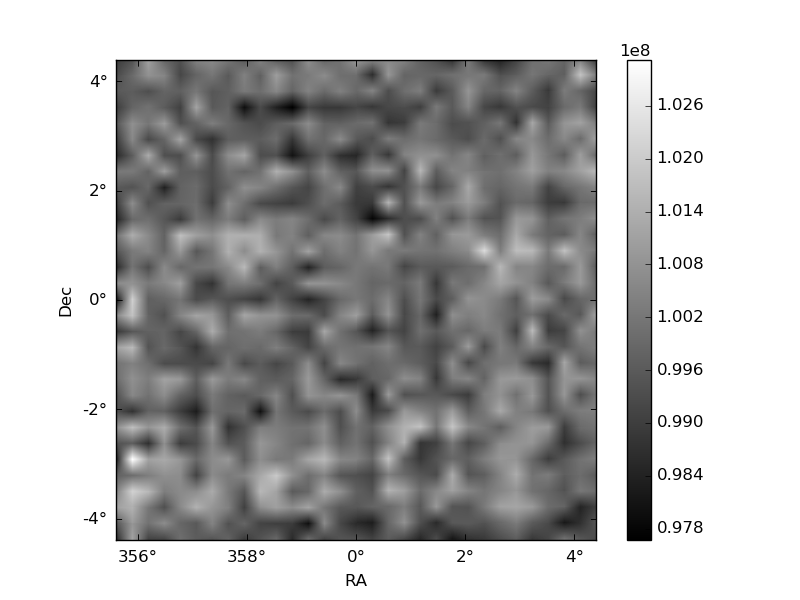
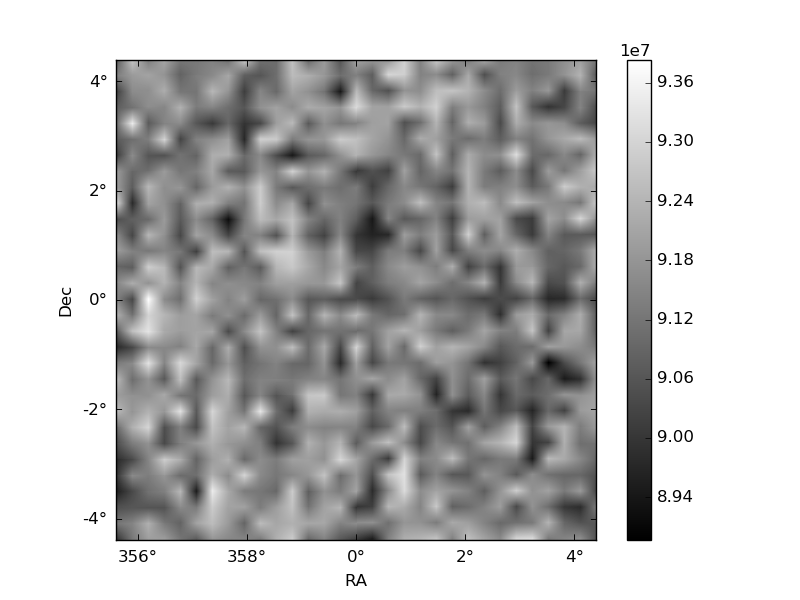
Histogram calculated using DETX and DETY for each event in the final _common_clean file
| Quadrant A | 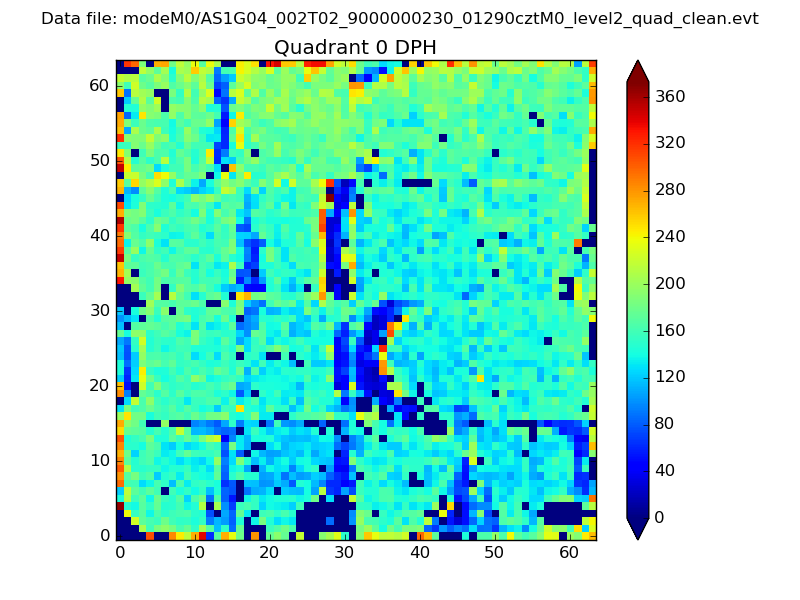 |
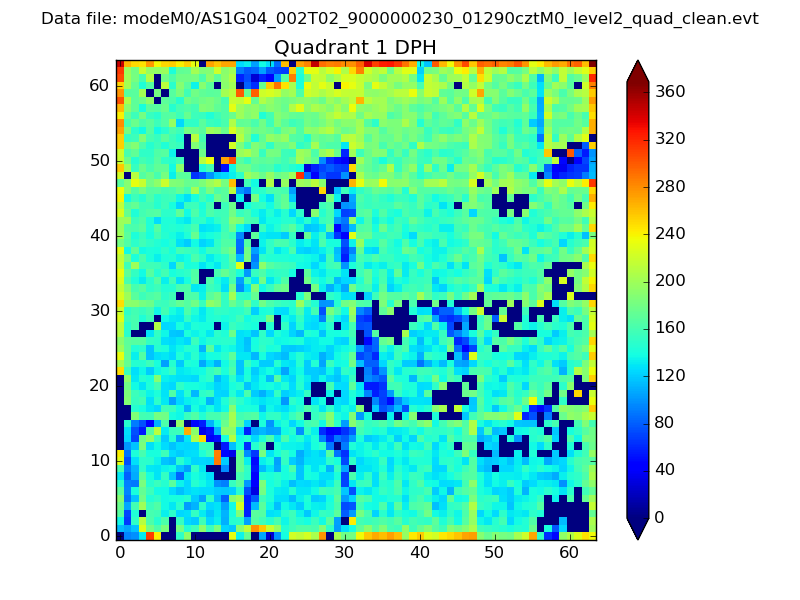 |
Quadrant B |
|---|---|---|---|
| Quadrant D | 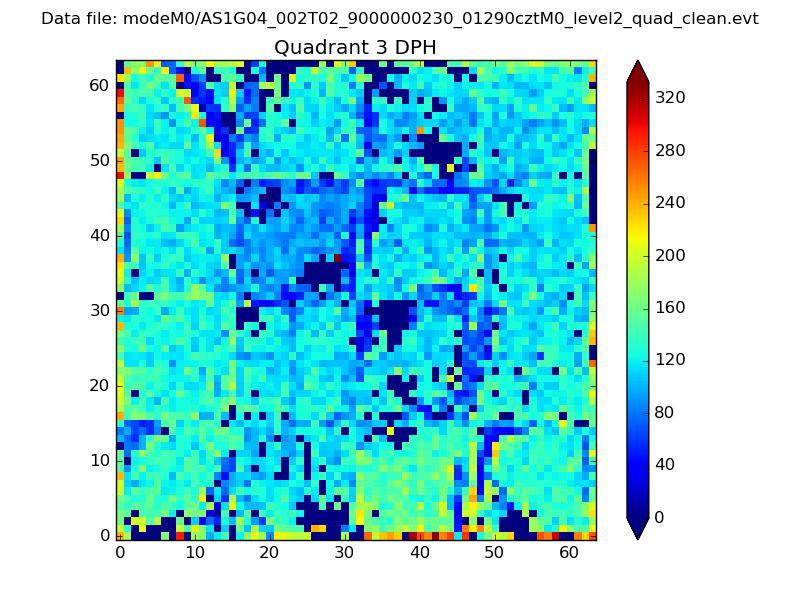 |
 |
Quadrant C |
| Plot type | Count rate plots | Images |
|---|---|---|
| Comparison with Poisson distribution Blue bars denote a histogram of data divided into 1 sec bins. Red curve is a Poisson curve with rate = median count rate of data. |
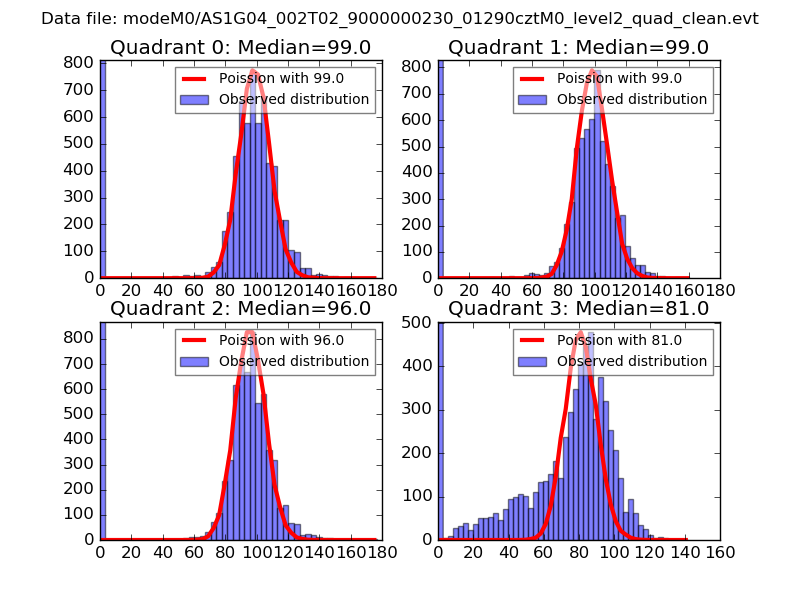 |
 |
| Quadrant-wise count rates Data is divided into 100 sec bins |
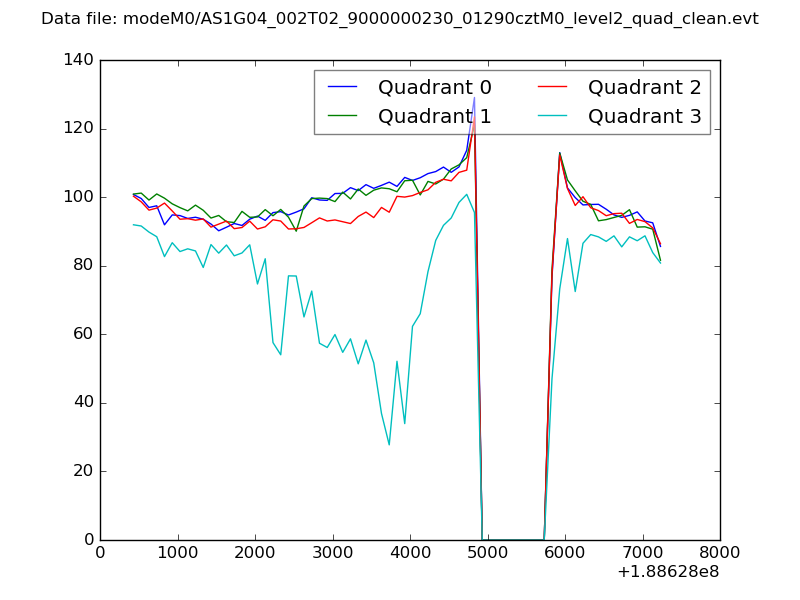 |
|
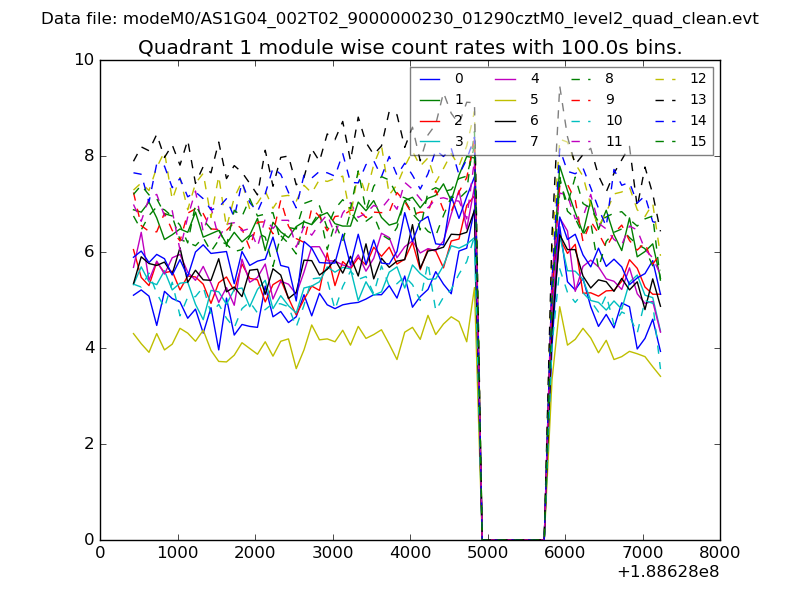
| Module-wise count rates for Quadrant A Data is divided into 100 sec bins |
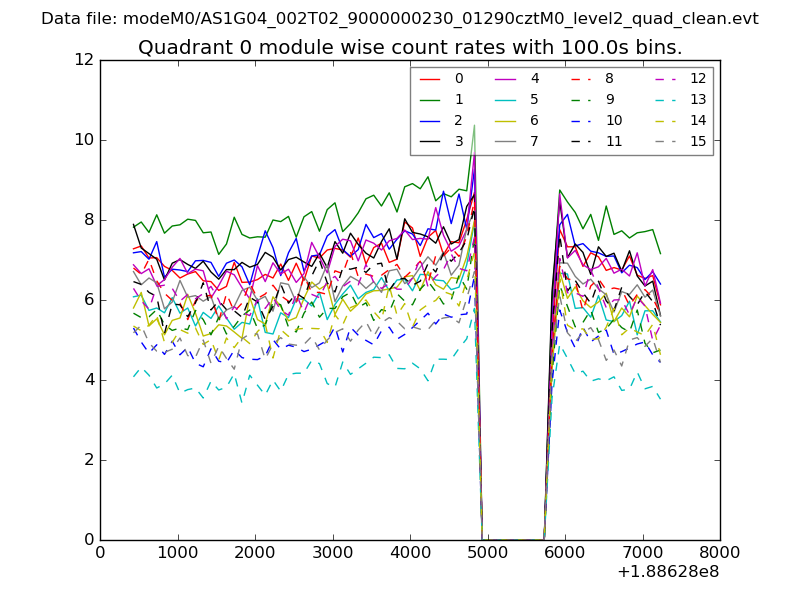 |
 |
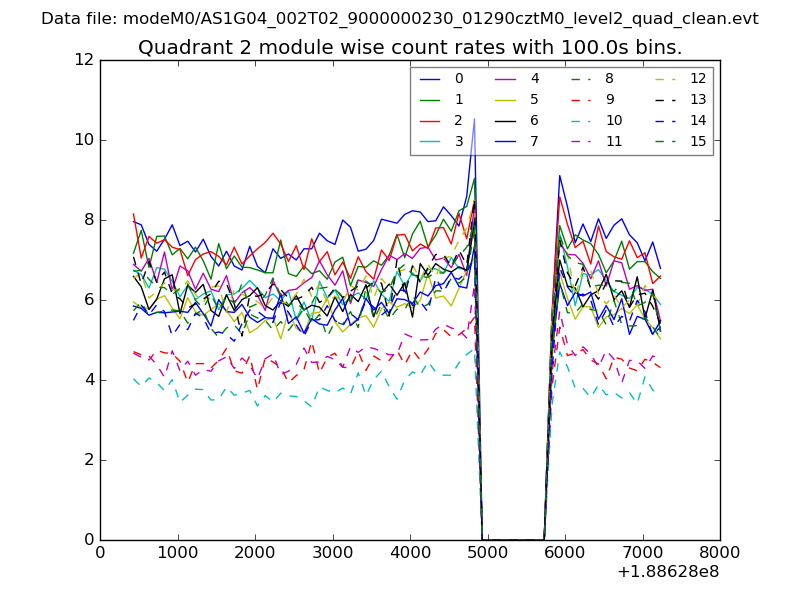
| Module-wise count rates for Quadrant B Data is divided into 100 sec bins |
 |
 |
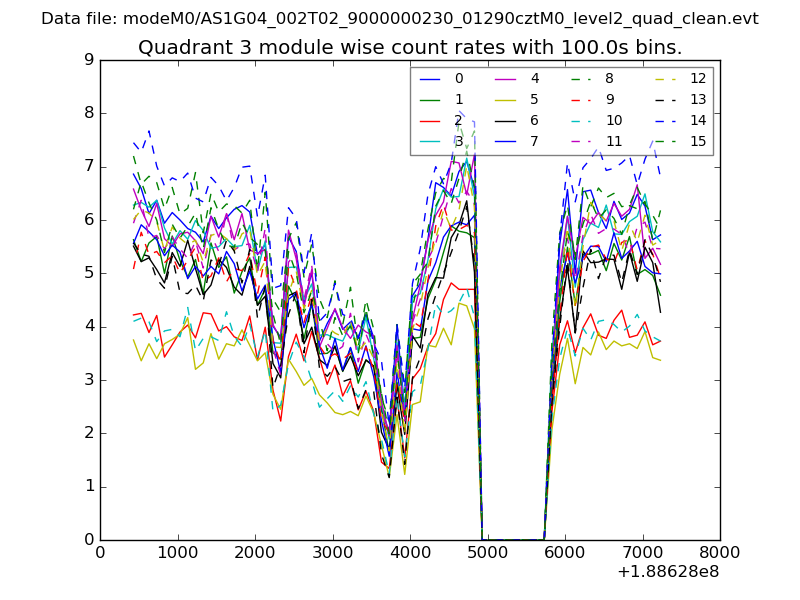
| Module-wise count rates for Quadrant C Data is divided into 100 sec bins |
 |
 |
| Module-wise count rates for Quadrant D Data is divided into 100 sec bins |
 |
 |
| Parameter | Plot |
|---|---|
| CZT HV Monitor | 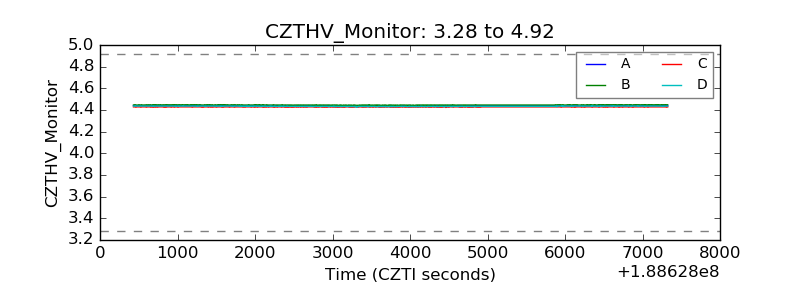 |
| D_VDD | 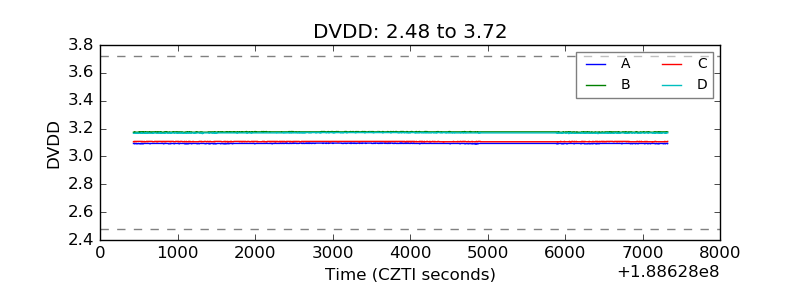 |
| Temperature 1 | 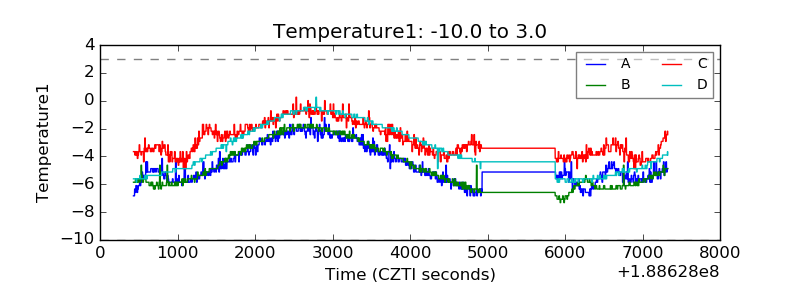 |
| Veto HV Monitor |  |
| Veto LLD | 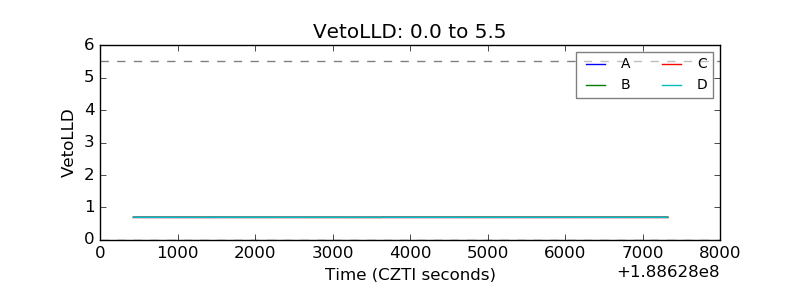 |
| Alpha Counter | 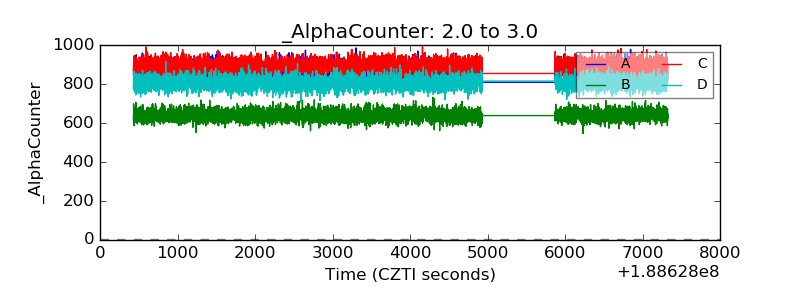 |
| _CPM_Rate | 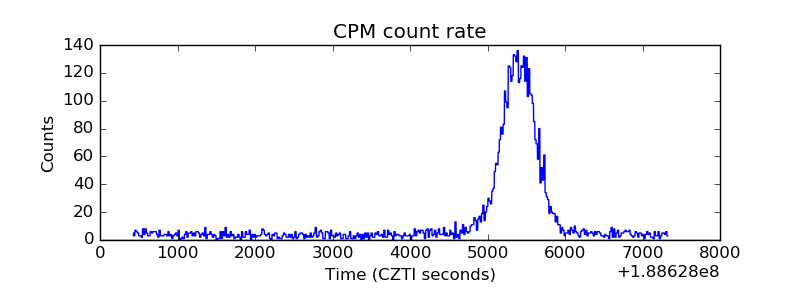 |
| CZT Counter | 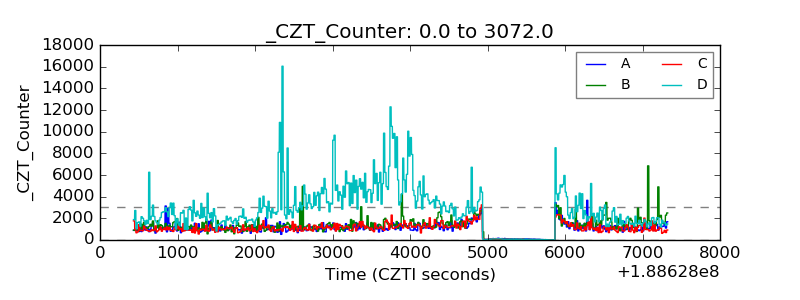 |
| +2.5 Volts monitor |  |
| +5 Volts monitor |  |
| _ROLL_ROT | 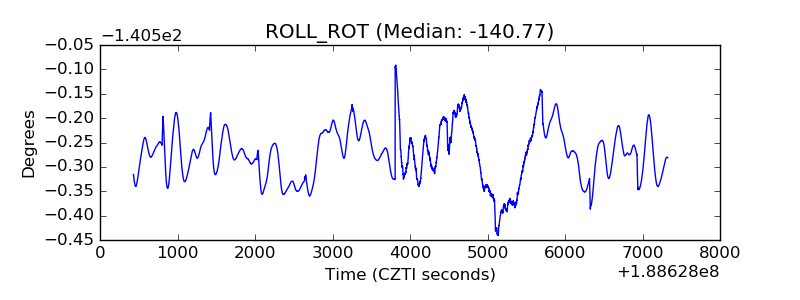 |
| _Roll_DEC | 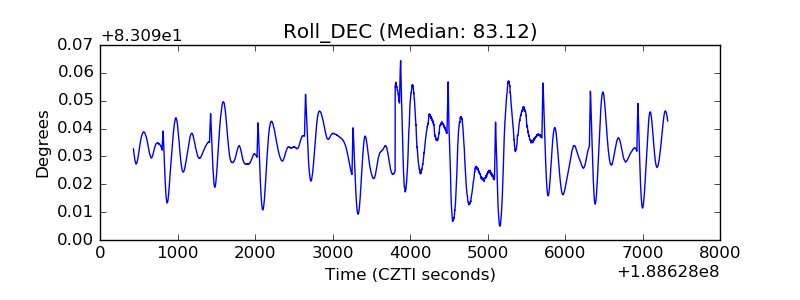 |
| _Roll_RA | 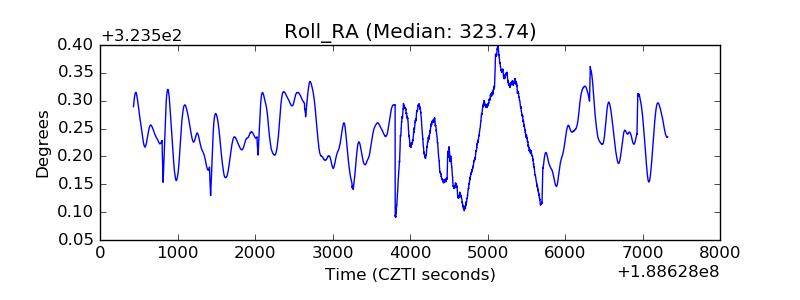 |
| Veto Counter | 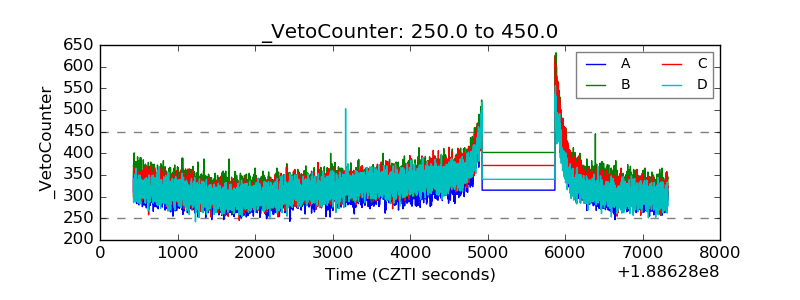 |