| Param | Original file | Final file |
|---|---|---|
| Filename | modeM0/AS1G04_002T02_9000000230_01291cztM0_level2.evt | modeM0/AS1G04_002T02_9000000230_01291cztM0_level2_quad_clean.evt |
| Size (bytes) | 1,378,189,440 | 94,276,800 |
| Size | 1.3 GB | 89.9 MB |
| Events in quadrant A | 8,012,715 | 632,158 |
| Events in quadrant B | 11,726,901 | 601,750 |
| Events in quadrant C | 7,813,192 | 609,778 |
| Events in quadrant D | 13,760,695 | 558,668 |
| Mode M9 | |||
|---|---|---|---|
| Quadrant | BADHDUFLAG | Total packets | Discarded packets |
| A | 0 | 6 | 0 |
| B | 0 | 6 | 0 |
| C | 0 | 6 | 0 |
| D | 0 | 6 | 0 |
| Mode M0 | |||
|---|---|---|---|
| Quadrant | BADHDUFLAG | Total packets | Discarded packets |
| A | 0 | 28418 | 2 |
| B | 0 | 39466 | 1 |
| C | 0 | 27824 | 1 |
| D | 0 | 45563 | 1 |
| Mode SS | |||
|---|---|---|---|
| Quadrant | BADHDUFLAG | Total packets | Discarded packets |
| A | 0 | 132 | 0 |
| B | 0 | 132 | 0 |
| C | 0 | 132 | 0 |
| D | 0 | 132 | 0 |
| Quadrant | Total seconds | Saturated seconds | Saturation percentage |
|---|---|---|---|
| A | 6484 | 37 | 0.570635% |
| B | 6484 | 651 | 10.040099% |
| C | 6484 | 130 | 2.004935% |
| D | 6484 | 1019 | 15.715608% |
Noise dominated data is calculated using 1-second bins in cleaned event files. If a bin has >2000 counts, and if more than 50% of those come from <1% of pixels, then it is considered to be noise-dominated and hence unusable.
| Quadrant | # 1 sec bins | Bins with >0 counts | Bins with >2000 counts | High rate bins dominated by noise | Noise dominated (total time) | Noise dominated (detector-on time) | Marked lightcurve |
|---|---|---|---|---|---|---|---|
| A | 7014 | 6485 | 317 | 317 | 4.52% | 4.89% | 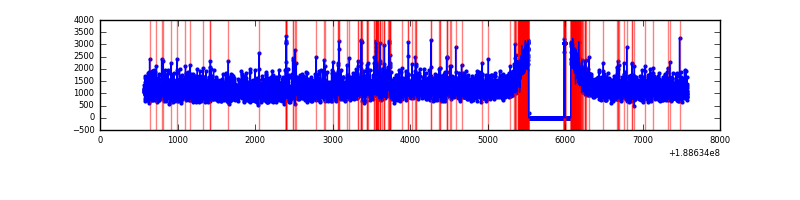 |
| B | 7013 | 6484 | 2097 | 2097 | 29.90% | 32.34% | 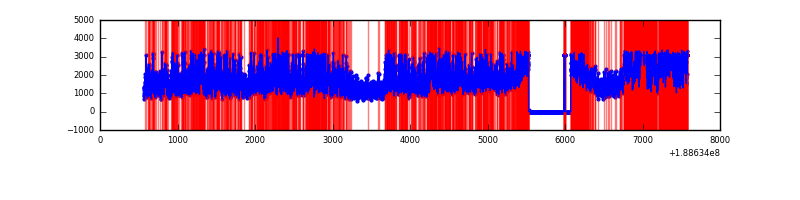 |
| C | 7014 | 6486 | 332 | 332 | 4.73% | 5.12% | 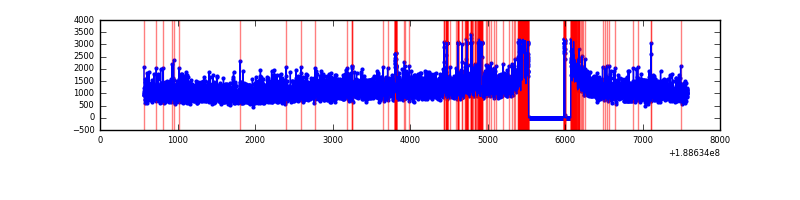 |
| D | 7014 | 6484 | 3495 | 3495 | 49.83% | 53.90% | 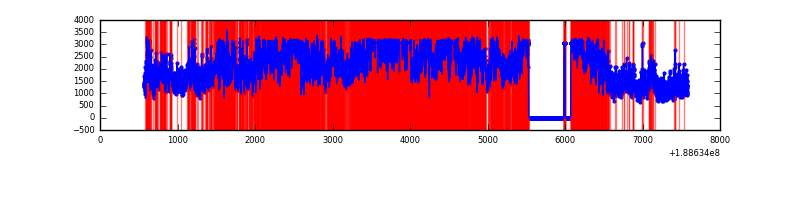 |
Top three noisy pixels from each quadrant. If the there are fewer than three noisy pixels in the level2.evt file, extra rows are filled as -1
| Pixel properties | Quadrant properties | ||||||
|---|---|---|---|---|---|---|---|
| Quadrant | DetID | PixID | Counts | Sigma | Mean | Median | Sigma |
| A | 4 | 32 | 262658 | 541.13 | 2000 | 2013 | 481.7 |
| A | 12 | 243 | 35781 | 70.11 | 2000 | 2013 | 481.7 |
| A | 15 | 127 | 15546 | 28.1 | 2000 | 2013 | 481.7 |
| B | 10 | 213 | 3162892 | 6682.83 | 2003 | 2014 | 473.0 |
| B | 8 | 4 | 565372 | 1191.07 | 2003 | 2014 | 473.0 |
| B | 12 | 52 | 165408 | 345.45 | 2003 | 2014 | 473.0 |
| C | 15 | 241 | 279902 | 546.21 | 1824 | 1884 | 509.0 |
| C | 9 | 54 | 197929 | 385.16 | 1824 | 1884 | 509.0 |
| C | 9 | 52 | 105249 | 203.08 | 1824 | 1884 | 509.0 |
| D | 13 | 169 | 6655016 | 12397.06 | 1737 | 1794 | 536.7 |
| D | 10 | 84 | 488745 | 907.34 | 1737 | 1794 | 536.7 |
| D | 12 | 22 | 73255 | 133.15 | 1737 | 1794 | 536.7 |
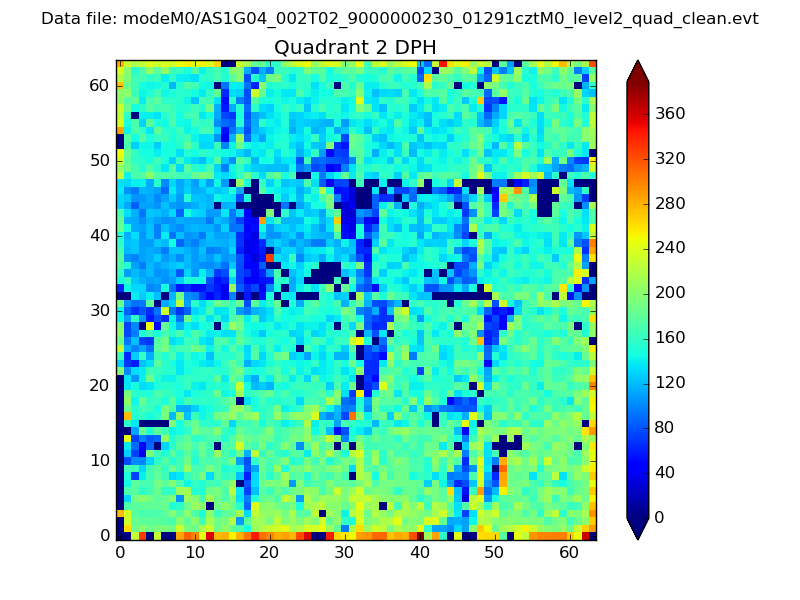
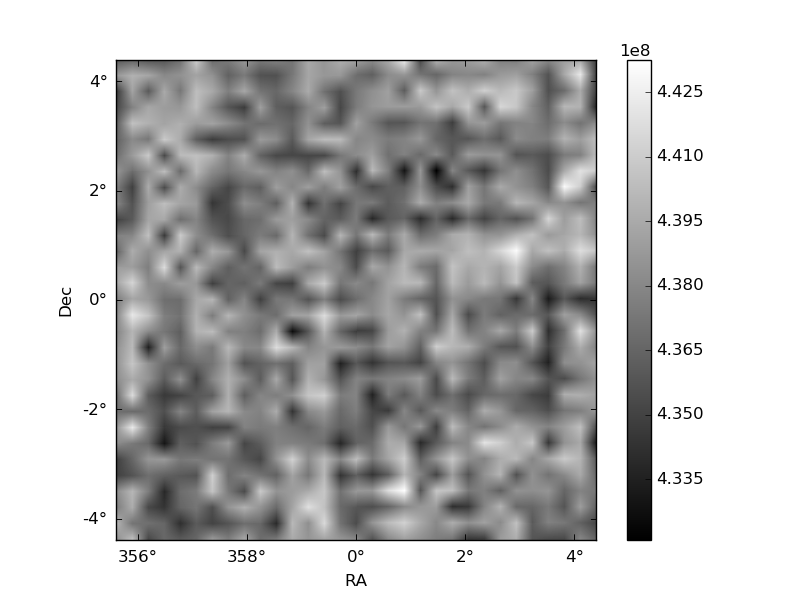
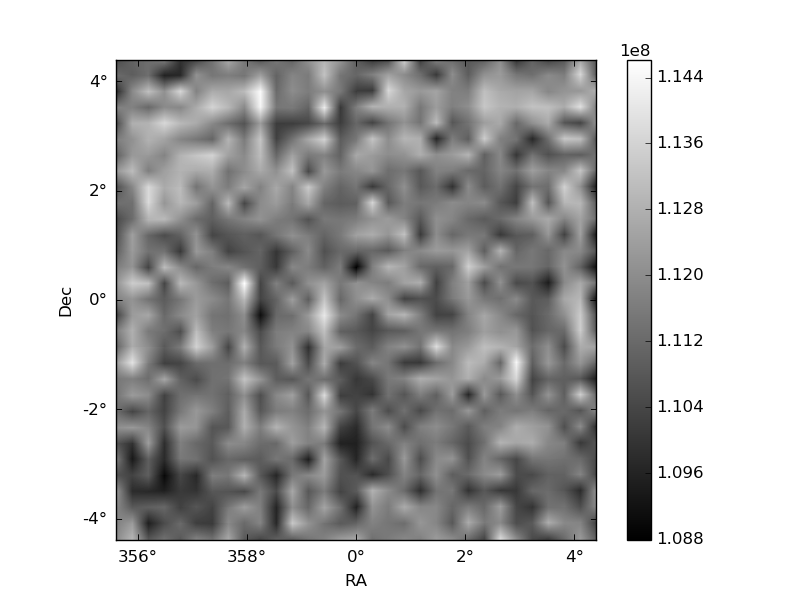
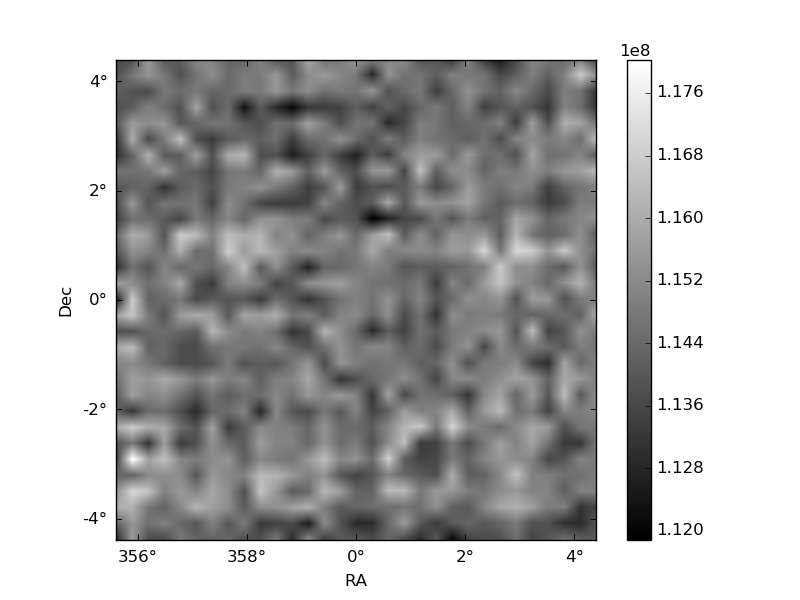
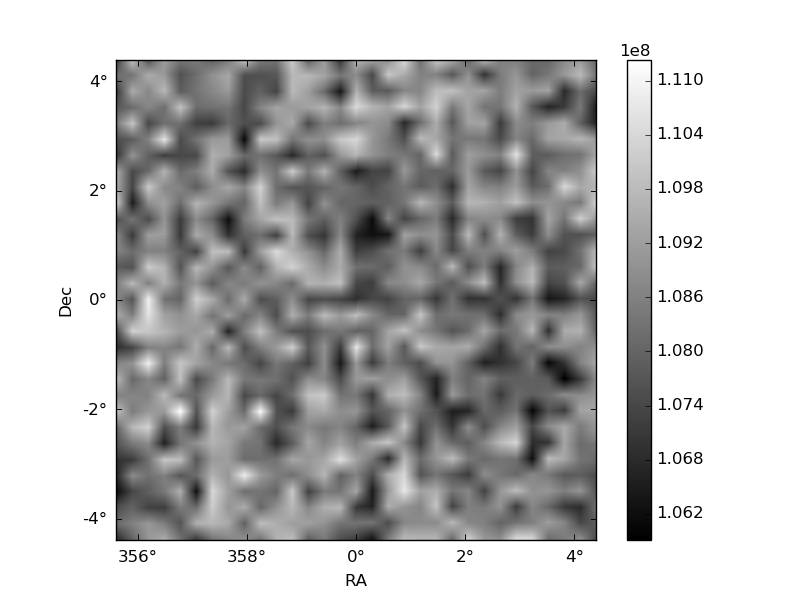
Histogram calculated using DETX and DETY for each event in the final _common_clean file
| Quadrant A | 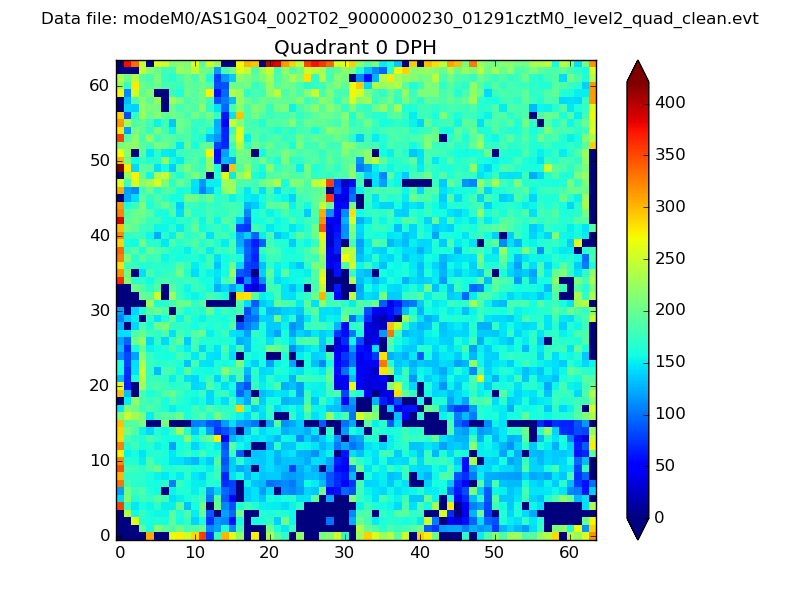 |
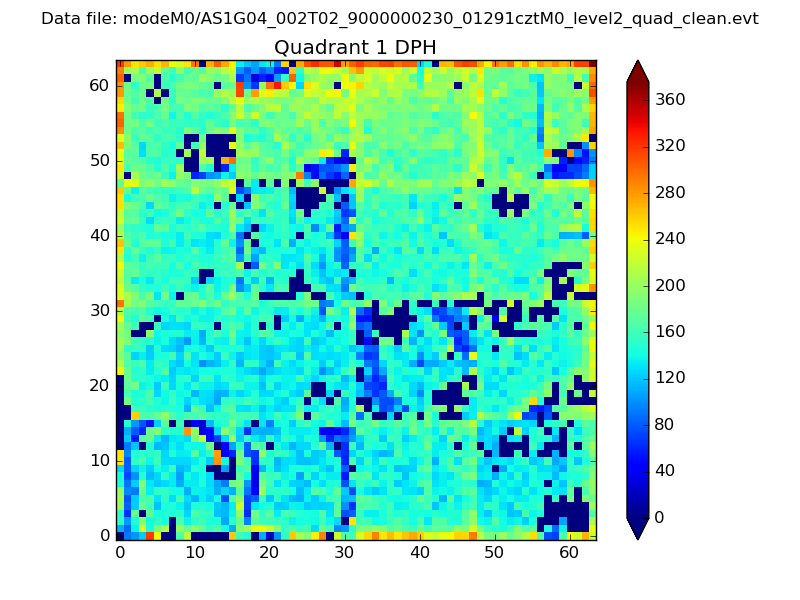 |
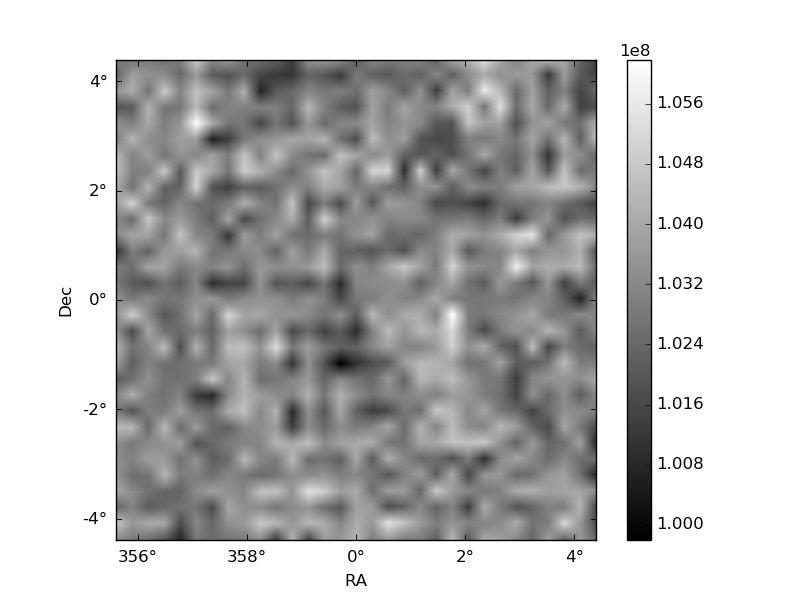
Quadrant B |
|---|---|---|---|
| Quadrant D | 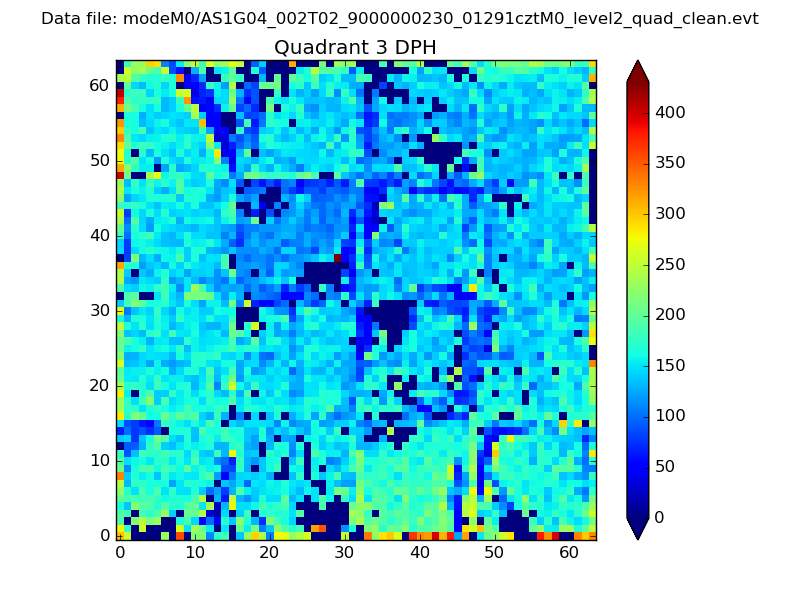 |
 |
Quadrant C |
| Plot type | Count rate plots | Images |
|---|---|---|
| Comparison with Poisson distribution Blue bars denote a histogram of data divided into 1 sec bins. Red curve is a Poisson curve with rate = median count rate of data. |
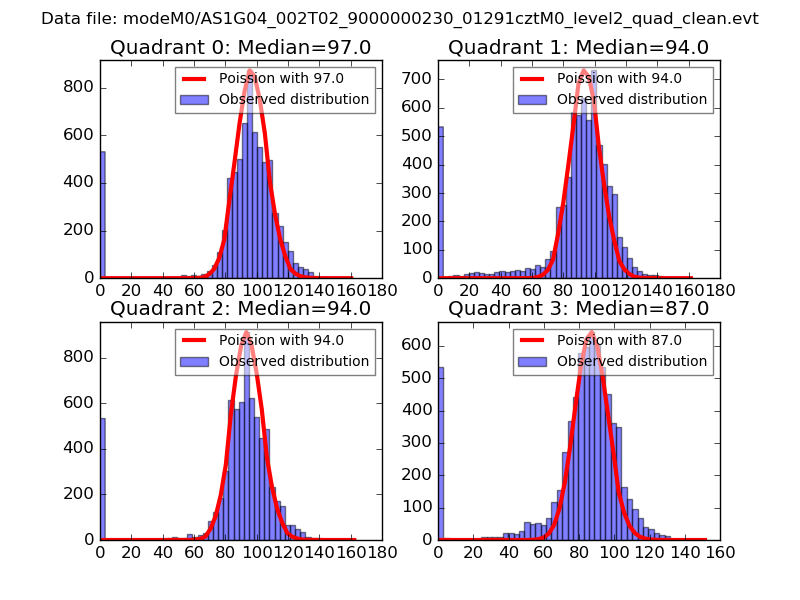 |
 |
| Quadrant-wise count rates Data is divided into 100 sec bins |
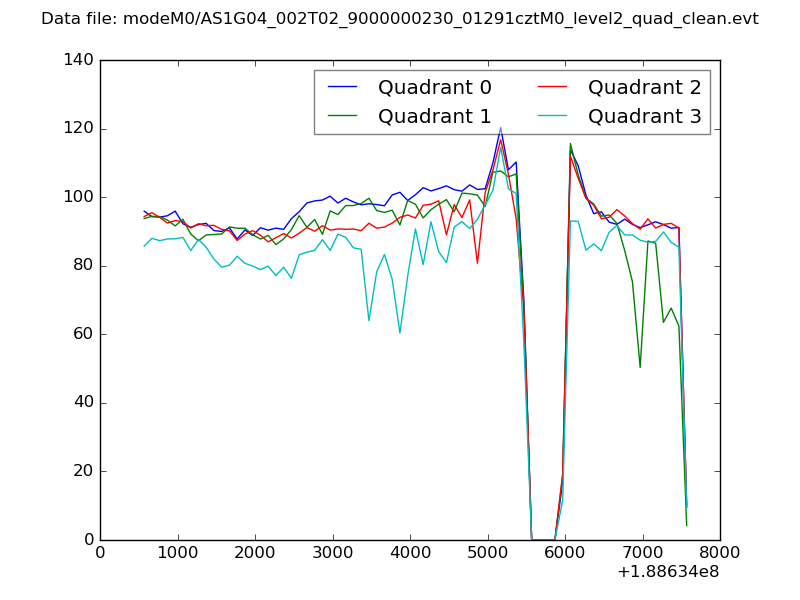 |
|
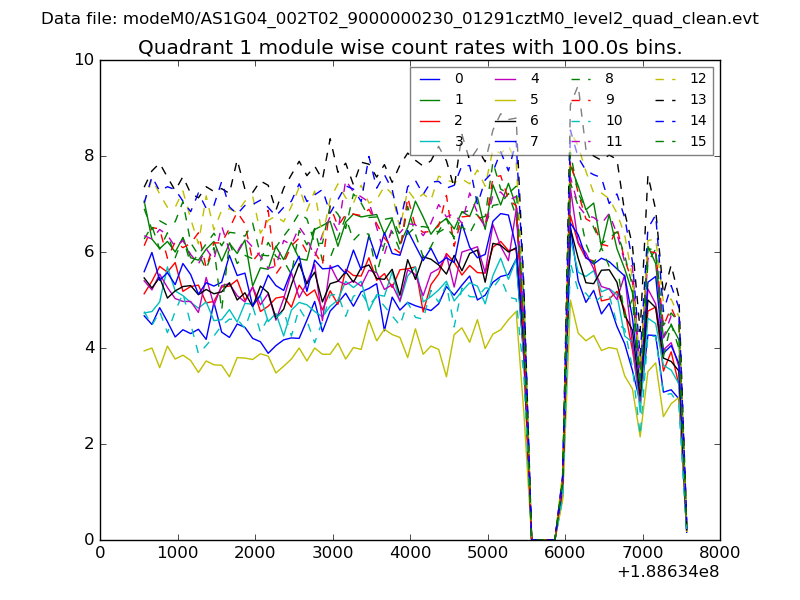
| Module-wise count rates for Quadrant A Data is divided into 100 sec bins |
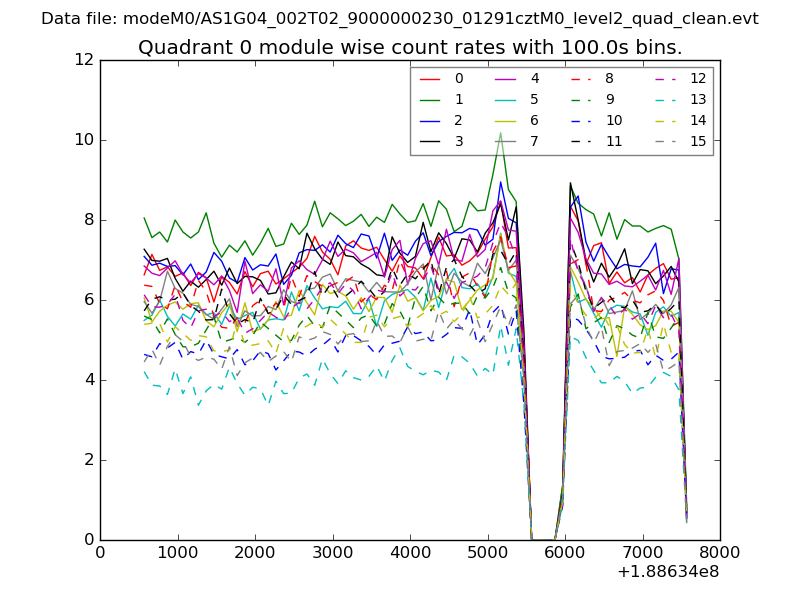 |
 |
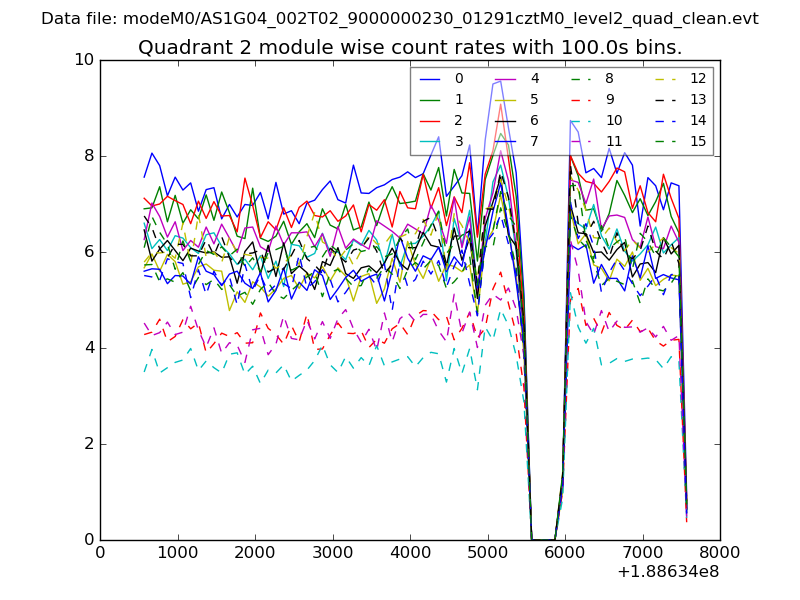
| Module-wise count rates for Quadrant B Data is divided into 100 sec bins |
 |
 |
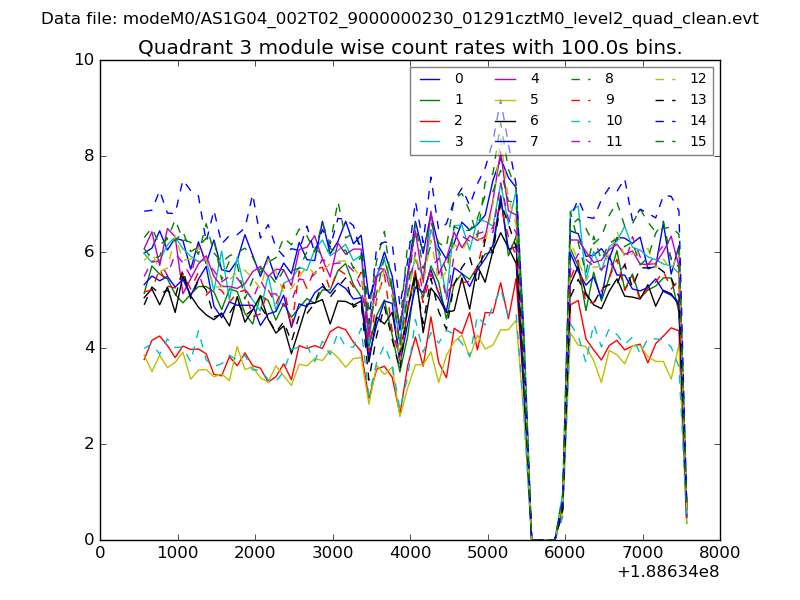
| Module-wise count rates for Quadrant C Data is divided into 100 sec bins |
 |
 |
| Module-wise count rates for Quadrant D Data is divided into 100 sec bins |
 |
 |
| Parameter | Plot |
|---|---|
| CZT HV Monitor | 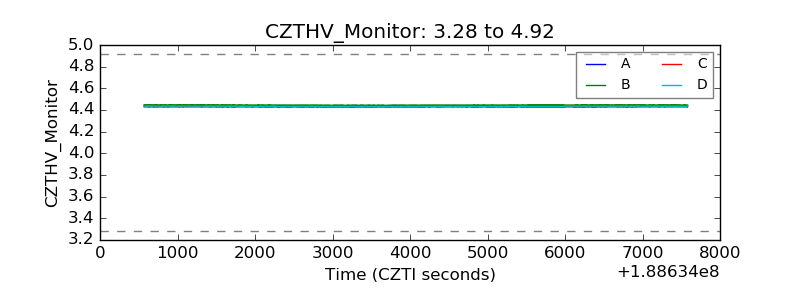 |
| D_VDD | 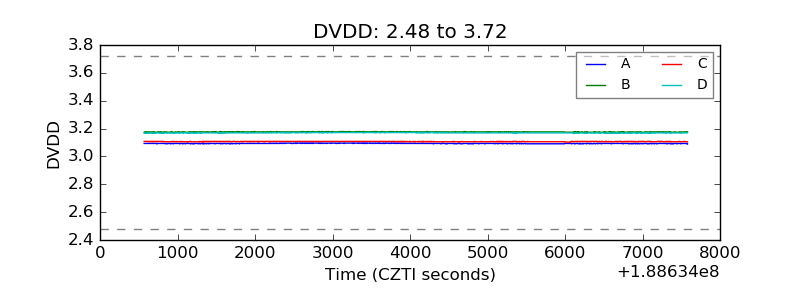 |
| Temperature 1 | 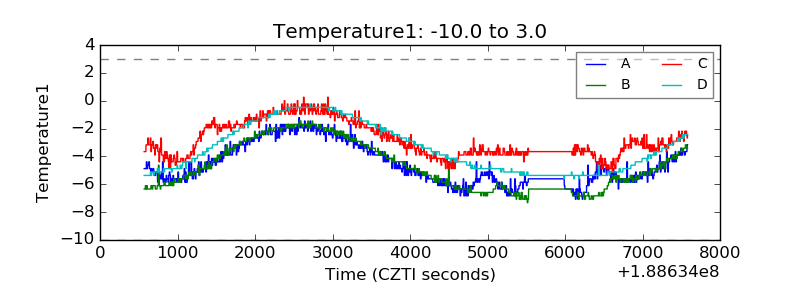 |
| Veto HV Monitor | 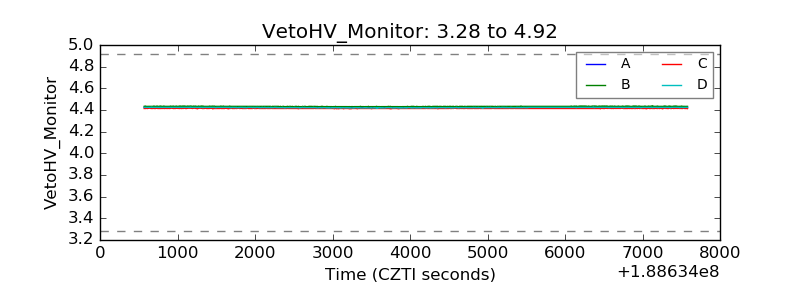 |
| Veto LLD | 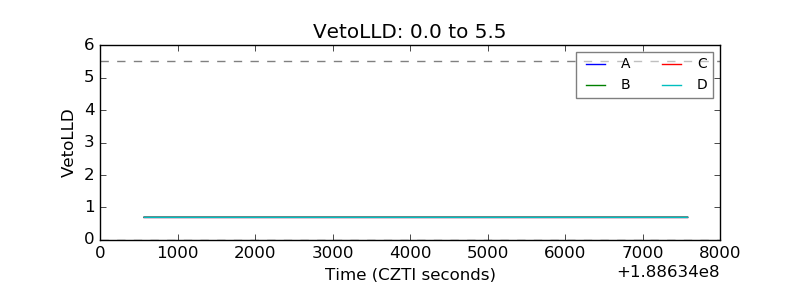 |
| Alpha Counter | 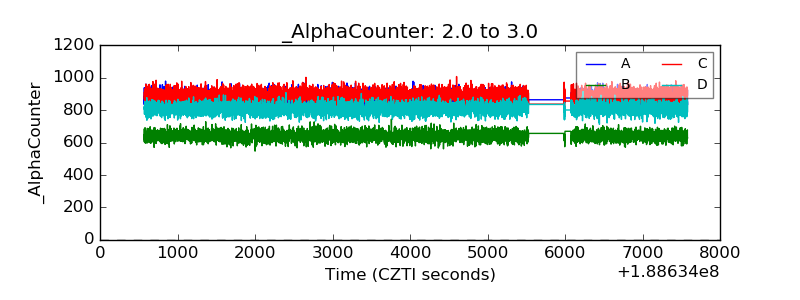 |
| _CPM_Rate | 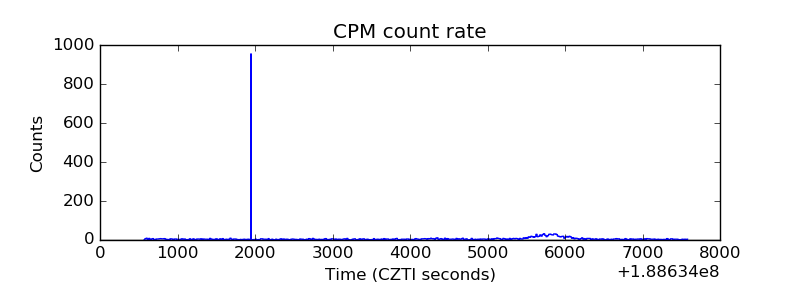 |
| CZT Counter | 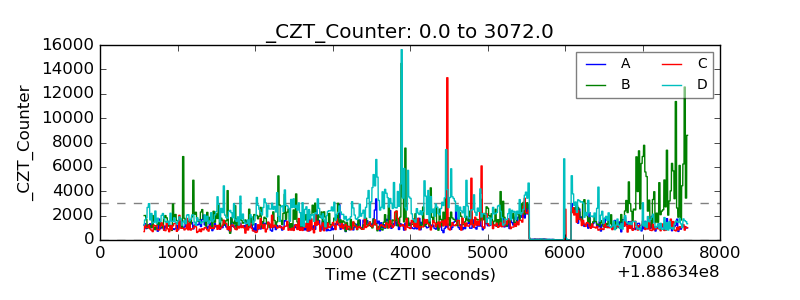 |
| +2.5 Volts monitor |  |
| +5 Volts monitor |  |
| _ROLL_ROT | 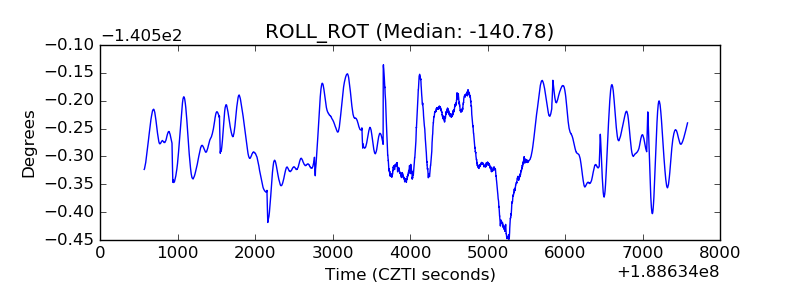 |
| _Roll_DEC | 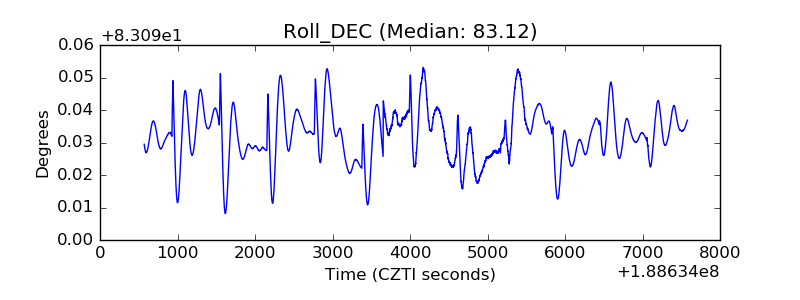 |
| _Roll_RA | 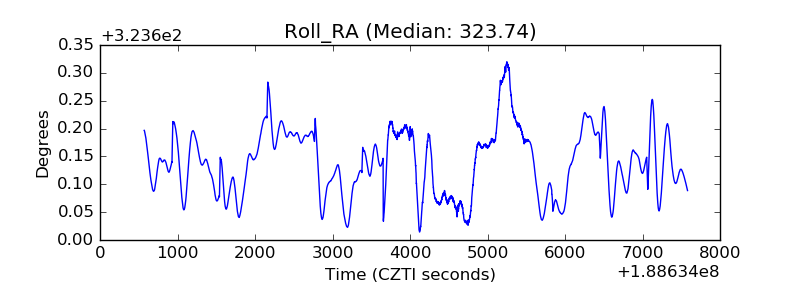 |
| Veto Counter | 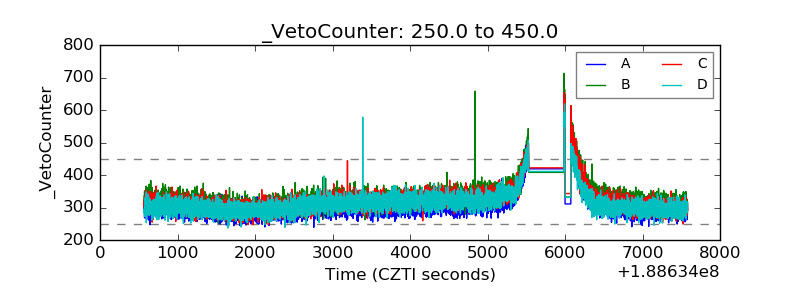 |