| Param | Original file | Final file |
|---|---|---|
| Filename | modeM0/AS1G04_002T02_9000000230_01292cztM0_level2.evt | modeM0/AS1G04_002T02_9000000230_01292cztM0_level2_quad_clean.evt |
| Size (bytes) | 1,471,579,200 | 107,441,280 |
| Size | 1.4 GB | 102.5 MB |
| Events in quadrant A | 9,008,398 | 712,492 |
| Events in quadrant B | 11,581,110 | 685,335 |
| Events in quadrant C | 8,741,177 | 697,935 |
| Events in quadrant D | 14,753,497 | 646,178 |
| Mode M0 | |||
|---|---|---|---|
| Quadrant | BADHDUFLAG | Total packets | Discarded packets |
| A | 0 | 31955 | 1 |
| B | 0 | 39654 | 0 |
| C | 0 | 31188 | 0 |
| D | 0 | 49036 | 0 |
| Mode SS | |||
|---|---|---|---|
| Quadrant | BADHDUFLAG | Total packets | Discarded packets |
| A | 0 | 148 | 0 |
| B | 0 | 148 | 0 |
| C | 0 | 148 | 0 |
| D | 0 | 148 | 0 |
| Quadrant | Total seconds | Saturated seconds | Saturation percentage |
|---|---|---|---|
| A | 7342 | 18 | 0.245165% |
| B | 7342 | 654 | 8.907655% |
| C | 7342 | 1 | 0.013620% |
| D | 7342 | 653 | 8.894034% |
Noise dominated data is calculated using 1-second bins in cleaned event files. If a bin has >2000 counts, and if more than 50% of those come from <1% of pixels, then it is considered to be noise-dominated and hence unusable.
| Quadrant | # 1 sec bins | Bins with >0 counts | Bins with >2000 counts | High rate bins dominated by noise | Noise dominated (total time) | Noise dominated (detector-on time) | Marked lightcurve |
|---|---|---|---|---|---|---|---|
| A | 7341 | 7341 | 431 | 431 | 5.87% | 5.87% | 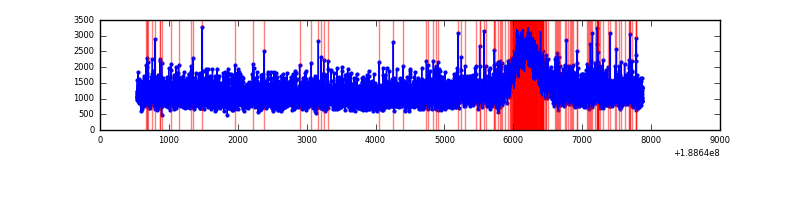 |
| B | 7342 | 7342 | 1524 | 1524 | 20.76% | 20.76% | 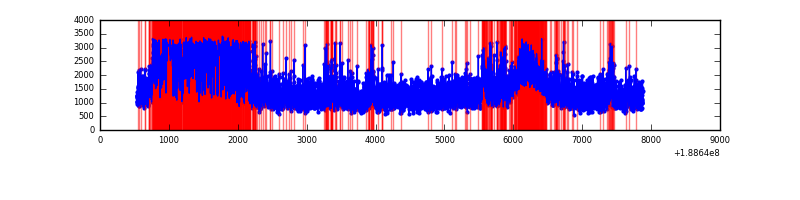 |
| C | 7342 | 7342 | 276 | 276 | 3.76% | 3.76% | 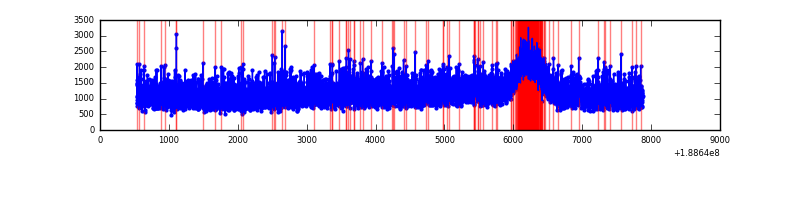 |
| D | 7342 | 7342 | 3416 | 3416 | 46.53% | 46.53% | 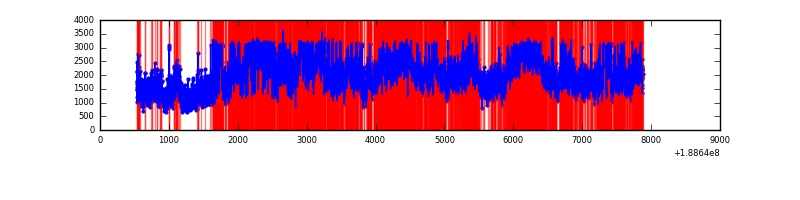 |
Top three noisy pixels from each quadrant. If the there are fewer than three noisy pixels in the level2.evt file, extra rows are filled as -1
| Pixel properties | Quadrant properties | ||||||
|---|---|---|---|---|---|---|---|
| Quadrant | DetID | PixID | Counts | Sigma | Mean | Median | Sigma |
| A | 4 | 32 | 86742 | 149.75 | 2316 | 2334 | 563.7 |
| A | 12 | 243 | 35706 | 59.2 | 2316 | 2334 | 563.7 |
| A | 11 | 79 | 9677 | 13.03 | 2316 | 2334 | 563.7 |
| B | 10 | 213 | 2038975 | 3734.34 | 2301 | 2311 | 545.4 |
| B | 8 | 4 | 439065 | 800.81 | 2301 | 2311 | 545.4 |
| B | 12 | 52 | 136350 | 245.77 | 2301 | 2311 | 545.4 |
| C | 15 | 241 | 321580 | 538.83 | 2123 | 2194 | 592.7 |
| C | 3 | 79 | 32681 | 51.43 | 2123 | 2194 | 592.7 |
| C | 3 | 9 | 32217 | 50.65 | 2123 | 2194 | 592.7 |
| D | 13 | 169 | 6297091 | 9856.3 | 2048 | 2127 | 638.7 |
| D | 10 | 84 | 481946 | 751.27 | 2048 | 2127 | 638.7 |
| D | 2 | 88 | 160767 | 248.39 | 2048 | 2127 | 638.7 |
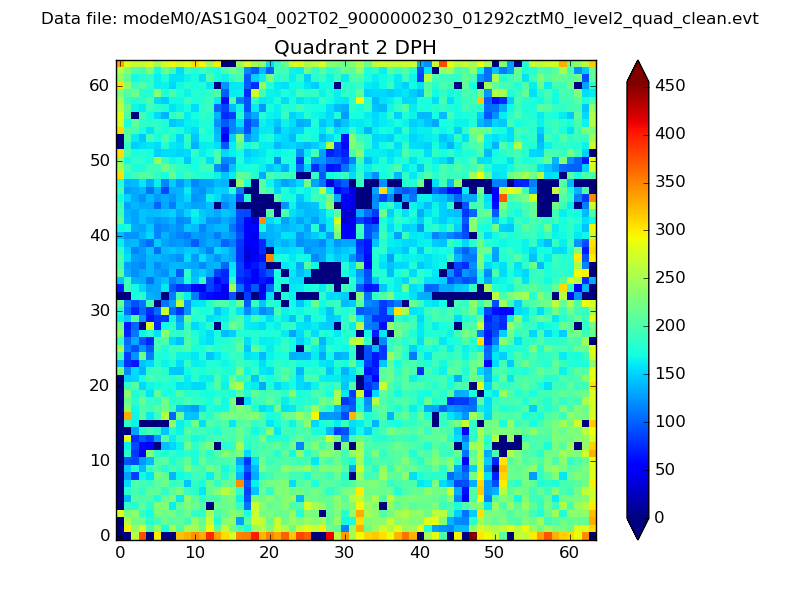
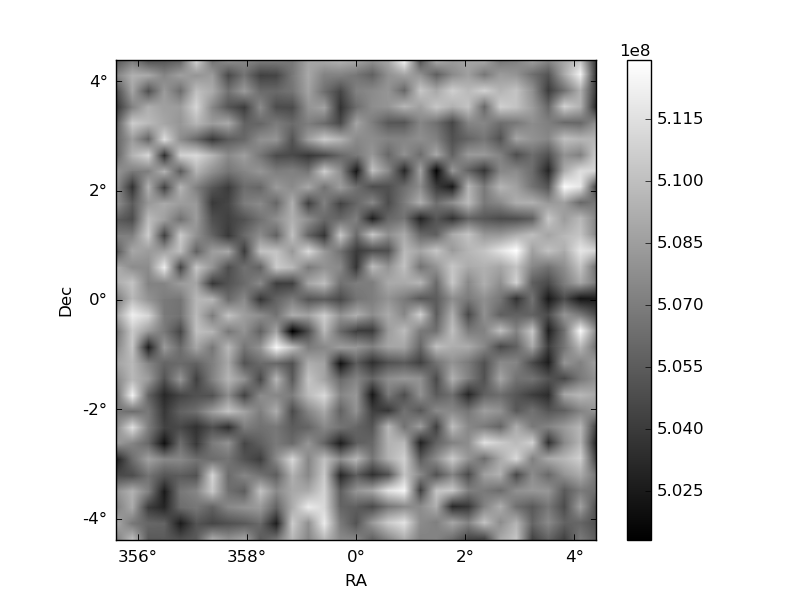
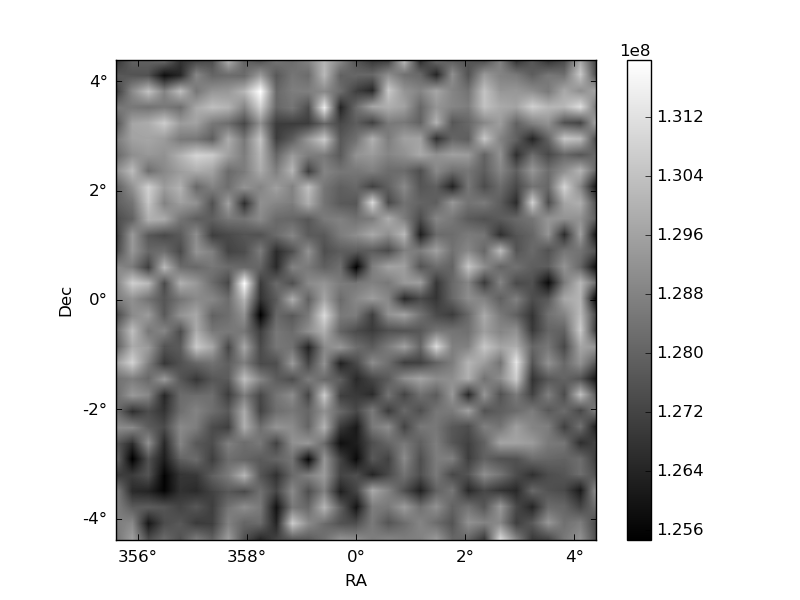
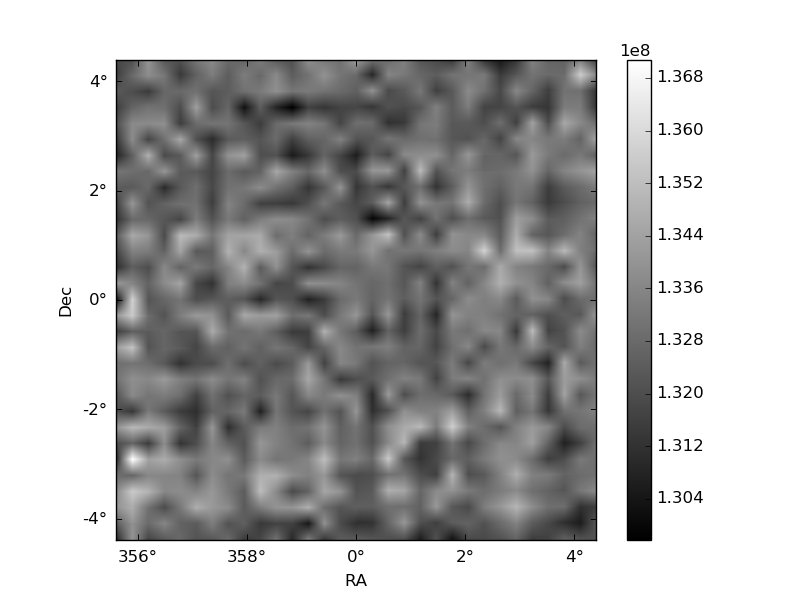
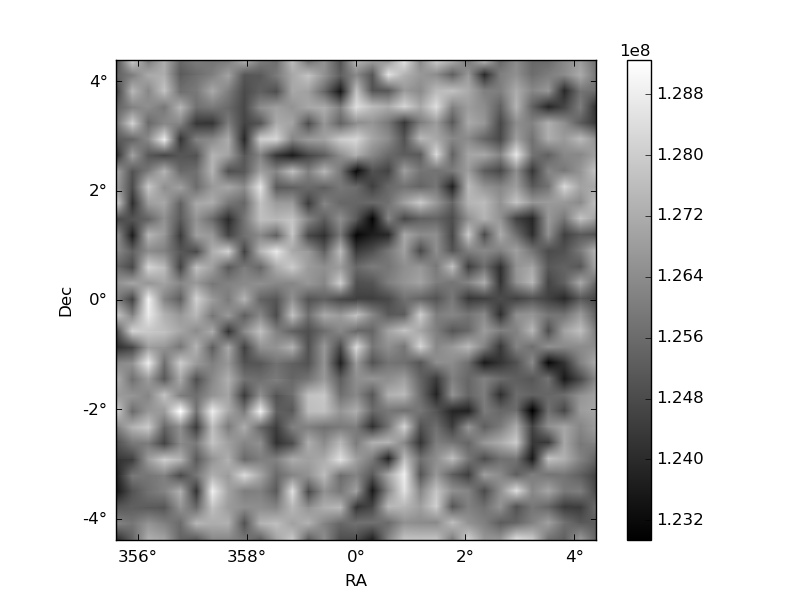
Histogram calculated using DETX and DETY for each event in the final _common_clean file
| Quadrant A | 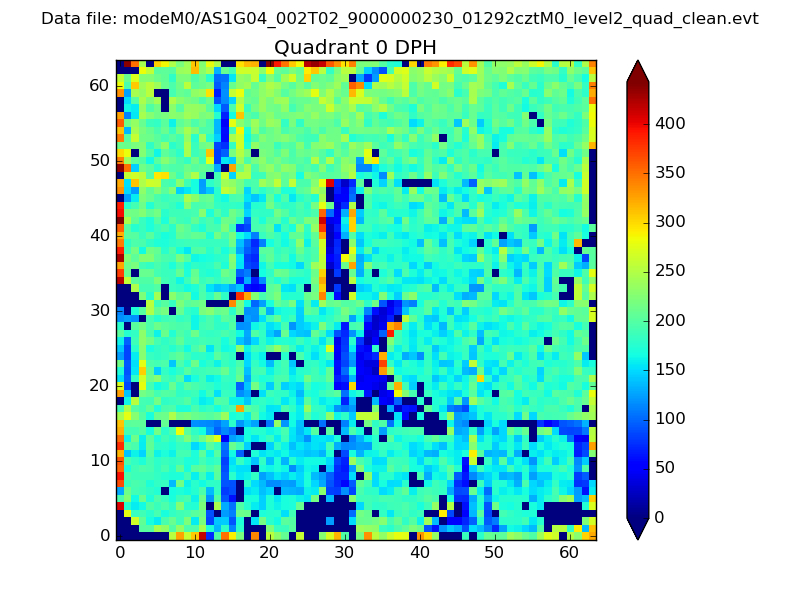 |
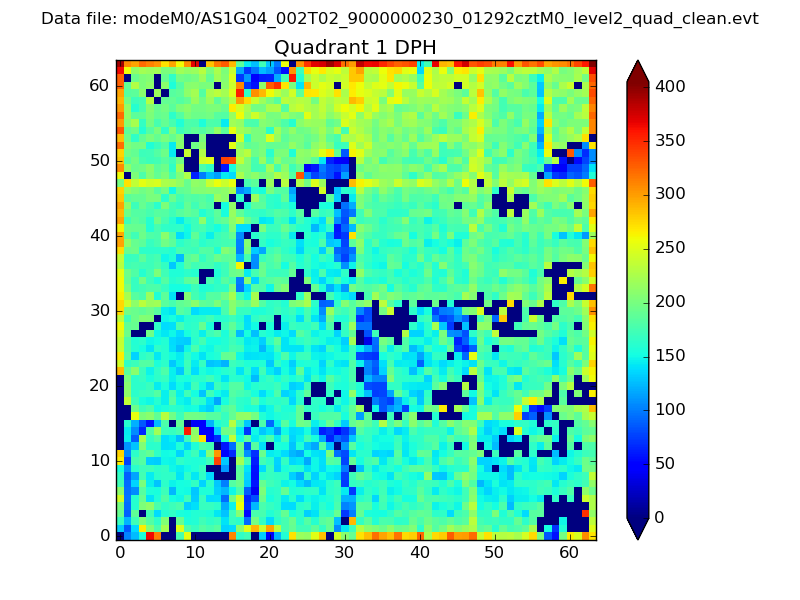 |
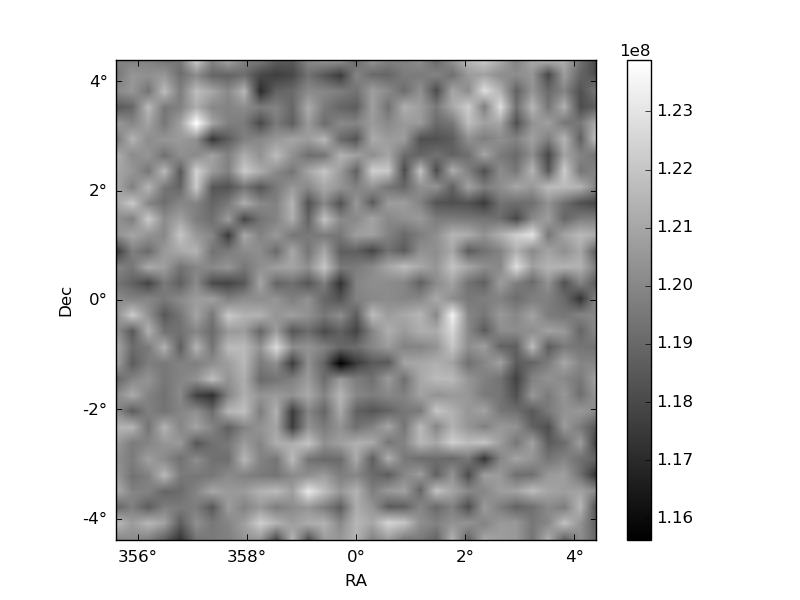
Quadrant B |
|---|---|---|---|
| Quadrant D | 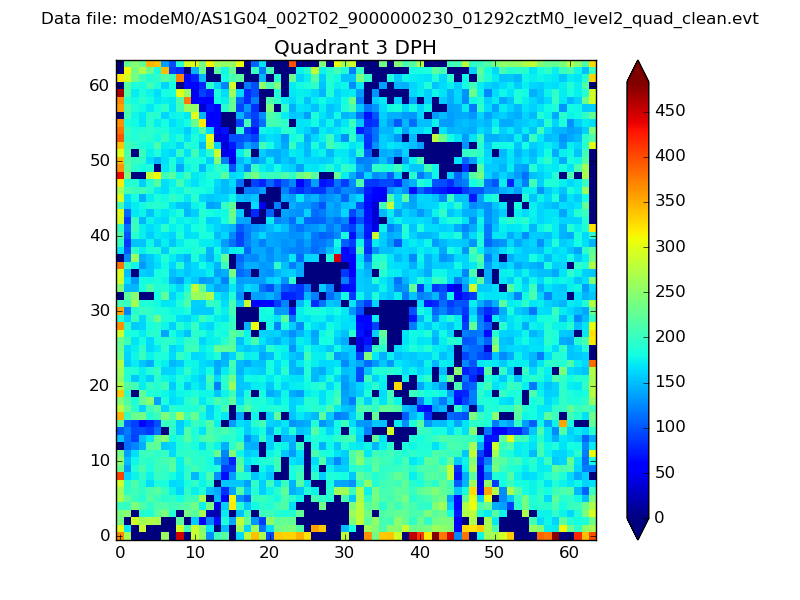 |
 |
Quadrant C |
| Plot type | Count rate plots | Images |
|---|---|---|
| Comparison with Poisson distribution Blue bars denote a histogram of data divided into 1 sec bins. Red curve is a Poisson curve with rate = median count rate of data. |
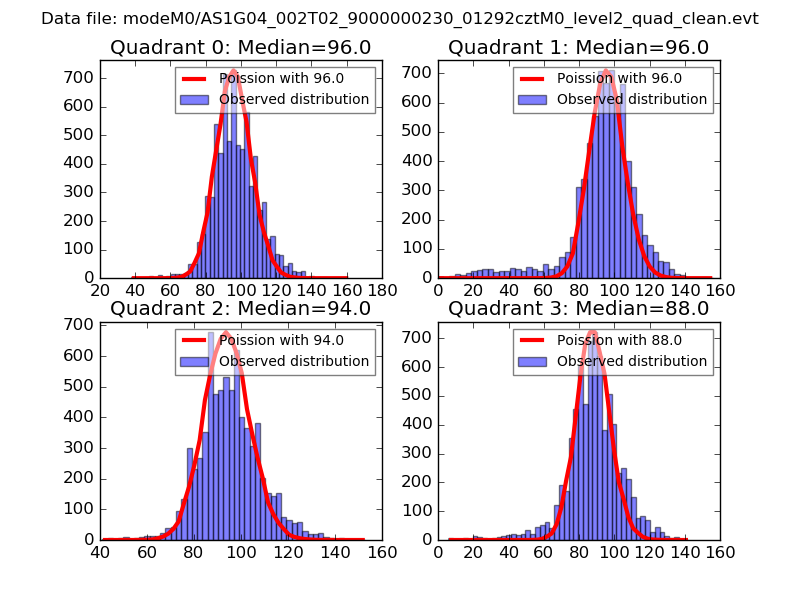 |
 |
| Quadrant-wise count rates Data is divided into 100 sec bins |
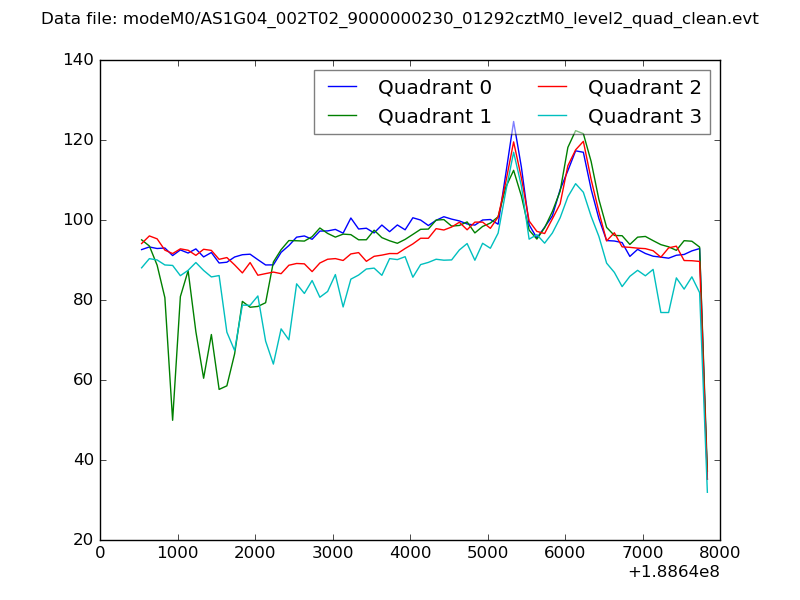 |
|
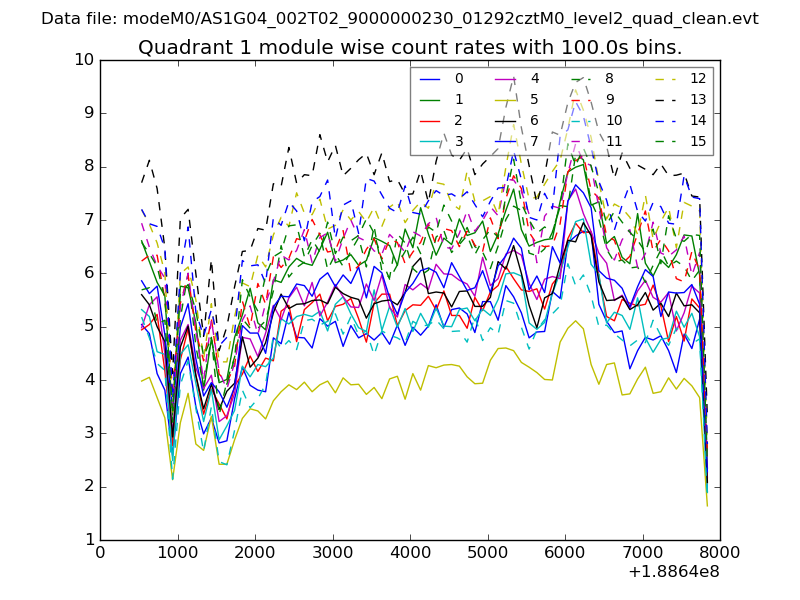
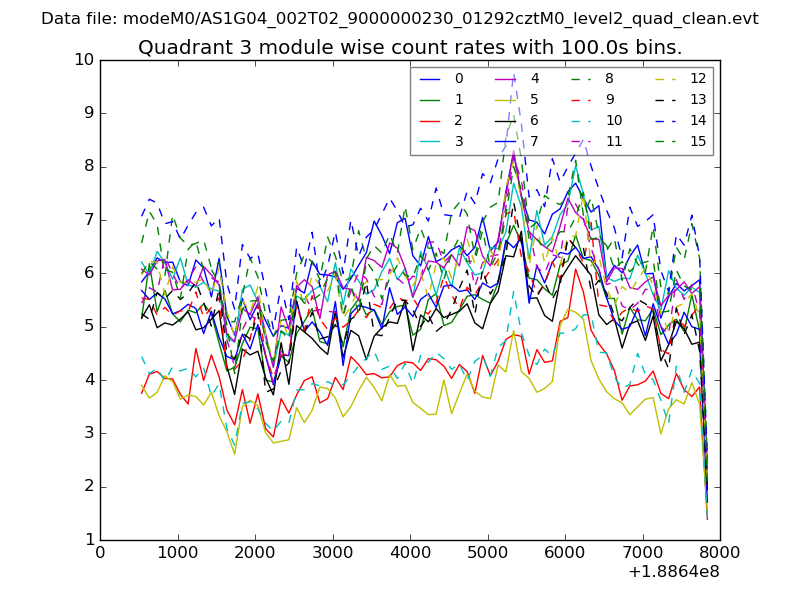
| Module-wise count rates for Quadrant A Data is divided into 100 sec bins |
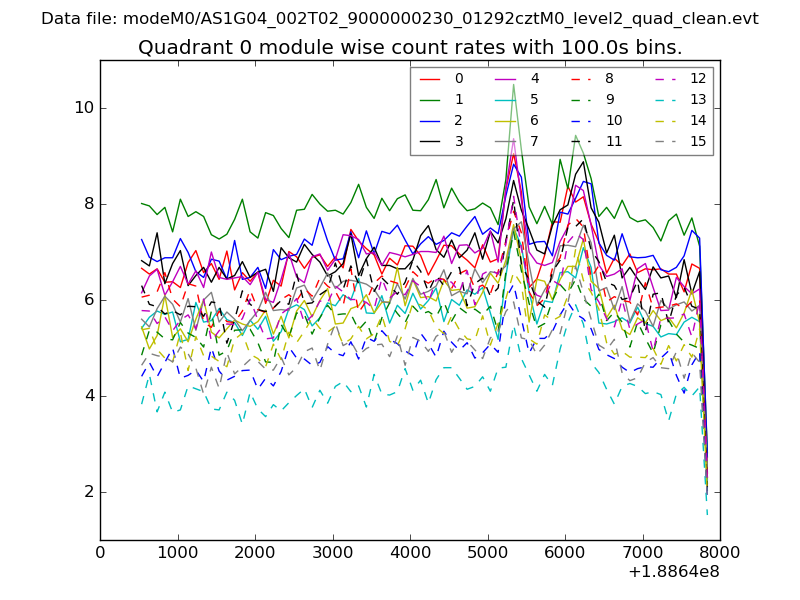 |
 |
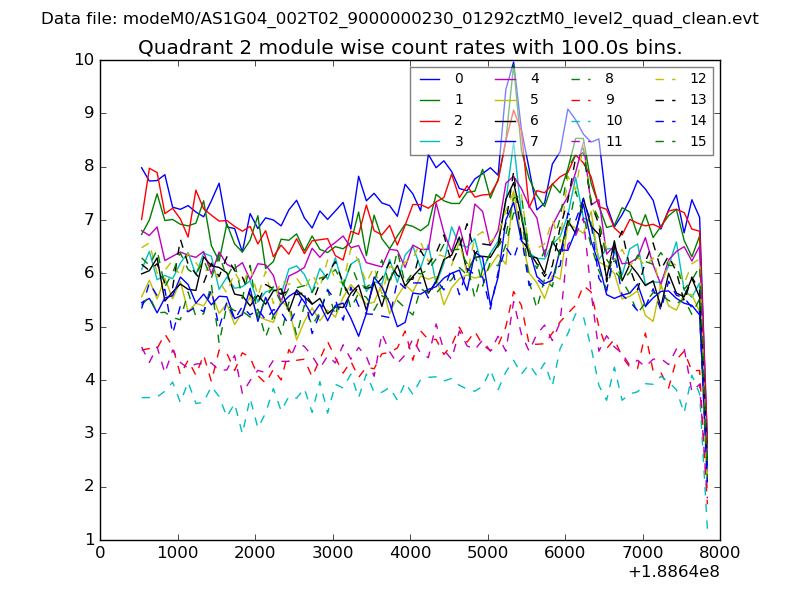
| Module-wise count rates for Quadrant B Data is divided into 100 sec bins |
 |
 |
| Module-wise count rates for Quadrant C Data is divided into 100 sec bins |
 |
 |
| Module-wise count rates for Quadrant D Data is divided into 100 sec bins |
 |
 |
| Parameter | Plot |
|---|---|
| CZT HV Monitor | 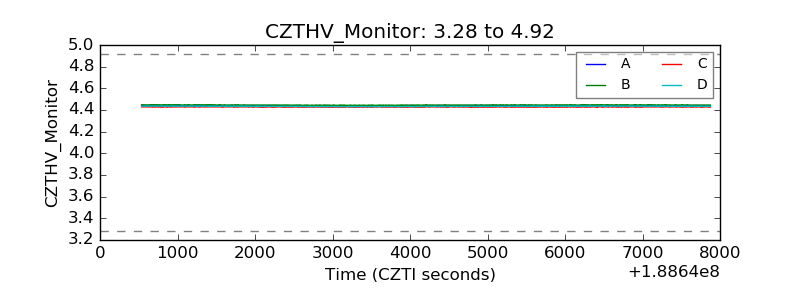 |
| D_VDD | 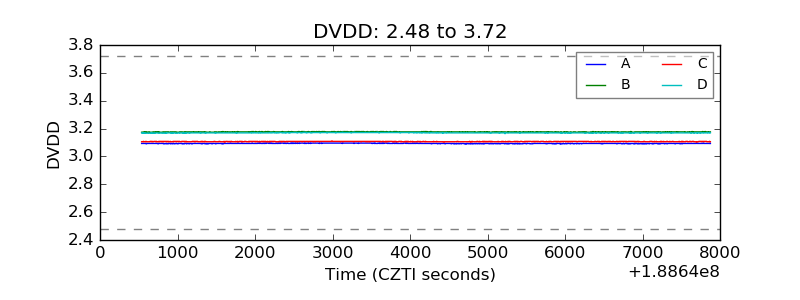 |
| Temperature 1 | 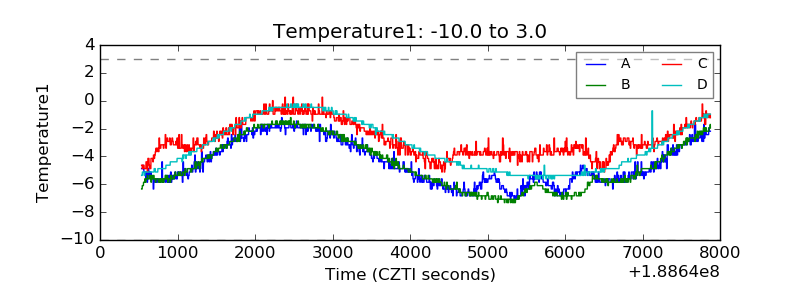 |
| Veto HV Monitor | 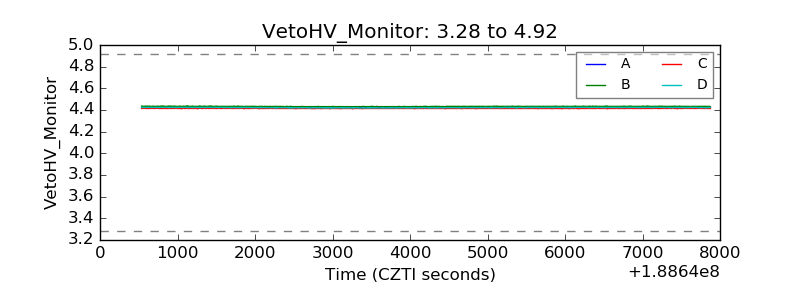 |
| Veto LLD | 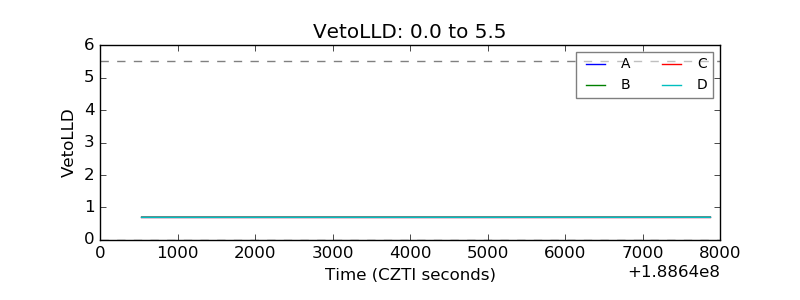 |
| Alpha Counter | 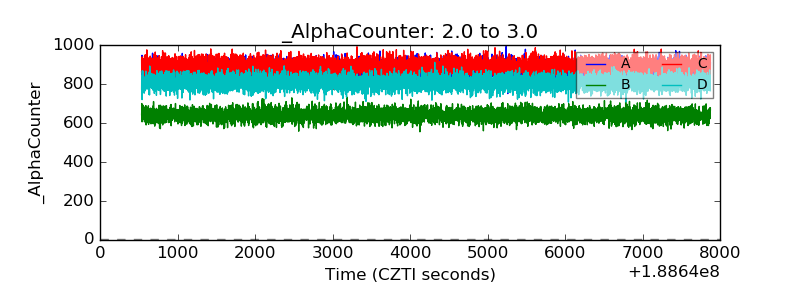 |
| _CPM_Rate | 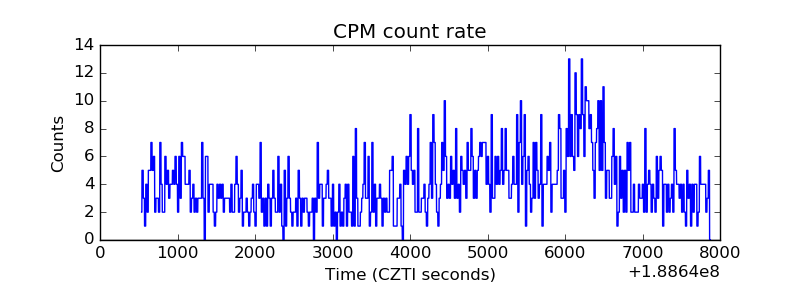 |
| CZT Counter | 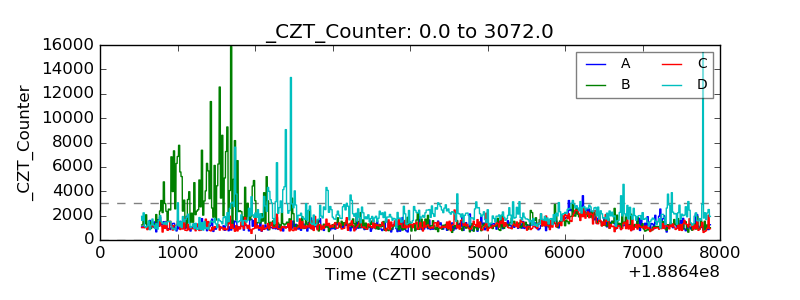 |
| +2.5 Volts monitor |  |
| +5 Volts monitor | 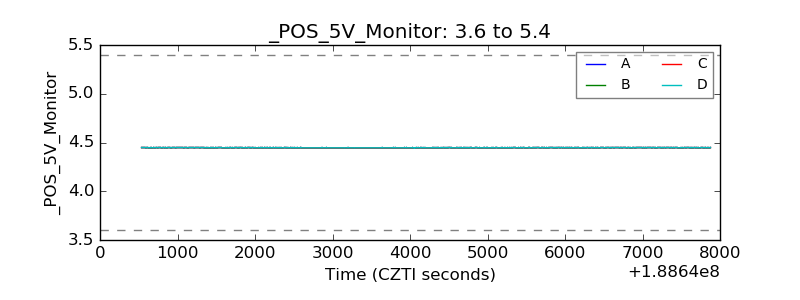 |
| _ROLL_ROT | 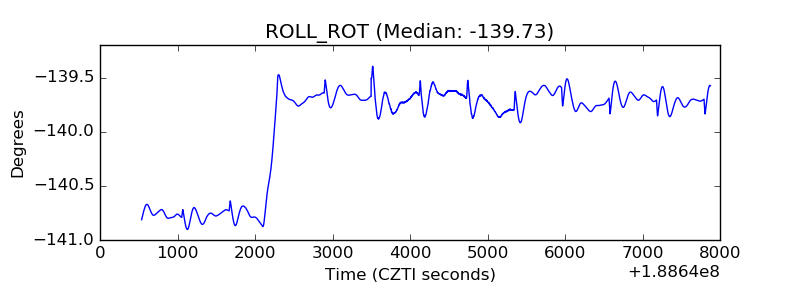 |
| _Roll_DEC | 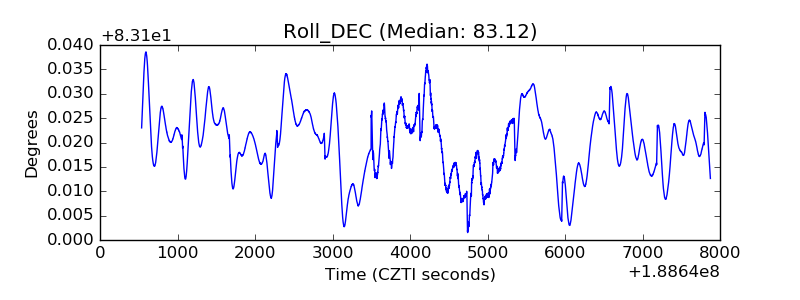 |
| _Roll_RA | 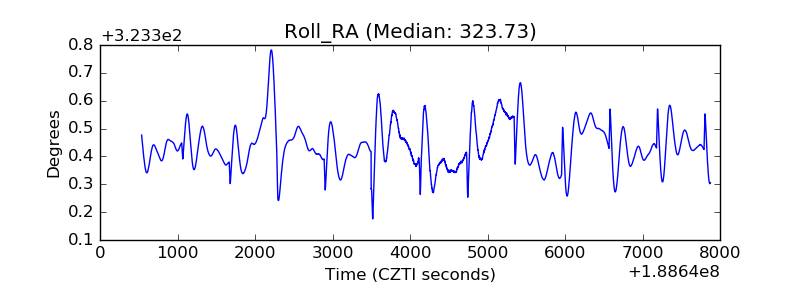 |
| Veto Counter | 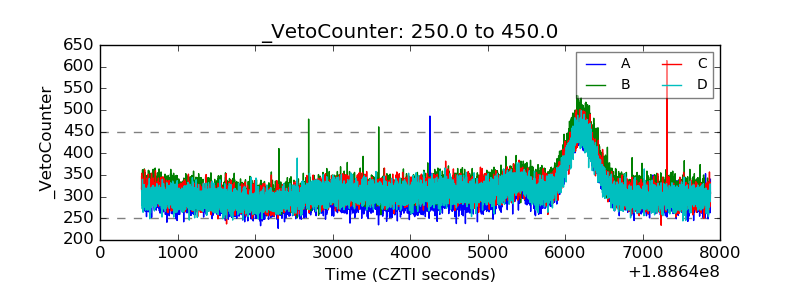 |