| Param | Original file | Final file |
|---|---|---|
| Filename | modeM0/AS1G04_002T02_9000000230_01293cztM0_level2.evt | modeM0/AS1G04_002T02_9000000230_01293cztM0_level2_quad_clean.evt |
| Size (bytes) | 1,434,427,200 | 106,231,680 |
| Size | 1.3 GB | 101.3 MB |
| Events in quadrant A | 8,897,156 | 702,017 |
| Events in quadrant B | 9,908,376 | 698,923 |
| Events in quadrant C | 8,612,638 | 683,117 |
| Events in quadrant D | 15,549,083 | 629,875 |
| Mode M0 | |||
|---|---|---|---|
| Quadrant | BADHDUFLAG | Total packets | Discarded packets |
| A | 0 | 31548 | 1 |
| B | 0 | 34571 | 0 |
| C | 0 | 30735 | 0 |
| D | 0 | 51306 | 0 |
| Mode SS | |||
|---|---|---|---|
| Quadrant | BADHDUFLAG | Total packets | Discarded packets |
| A | 0 | 146 | 0 |
| B | 0 | 146 | 0 |
| C | 0 | 146 | 0 |
| D | 0 | 146 | 0 |
| Quadrant | Total seconds | Saturated seconds | Saturation percentage |
|---|---|---|---|
| A | 7220 | 15 | 0.207756% |
| B | 7220 | 76 | 1.052632% |
| C | 7220 | 3 | 0.041551% |
| D | 7220 | 756 | 10.470914% |
Noise dominated data is calculated using 1-second bins in cleaned event files. If a bin has >2000 counts, and if more than 50% of those come from <1% of pixels, then it is considered to be noise-dominated and hence unusable.
| Quadrant | # 1 sec bins | Bins with >0 counts | Bins with >2000 counts | High rate bins dominated by noise | Noise dominated (total time) | Noise dominated (detector-on time) | Marked lightcurve |
|---|---|---|---|---|---|---|---|
| A | 7220 | 7220 | 344 | 344 | 4.76% | 4.76% | 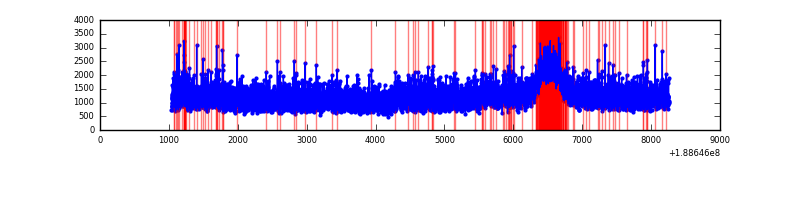 |
| B | 7220 | 7220 | 714 | 714 | 9.89% | 9.89% | 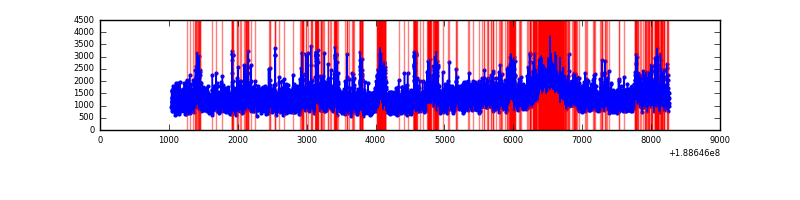 |
| C | 7220 | 7220 | 206 | 206 | 2.85% | 2.85% | 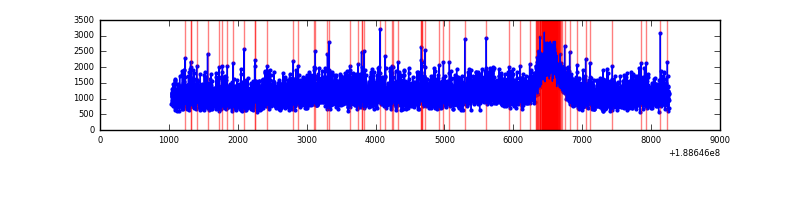 |
| D | 7220 | 7220 | 4124 | 4124 | 57.12% | 57.12% | 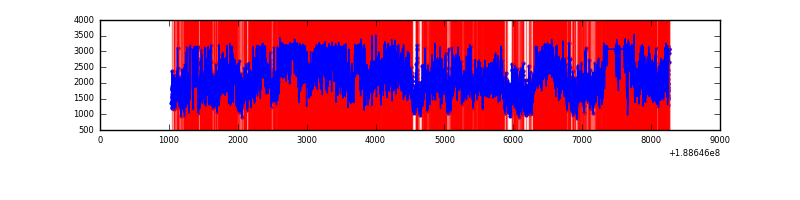 |
Top three noisy pixels from each quadrant. If the there are fewer than three noisy pixels in the level2.evt file, extra rows are filled as -1
| Pixel properties | Quadrant properties | ||||||
|---|---|---|---|---|---|---|---|
| Quadrant | DetID | PixID | Counts | Sigma | Mean | Median | Sigma |
| A | 4 | 32 | 227120 | 414.09 | 2254 | 2270 | 543.0 |
| A | 12 | 243 | 11433 | 16.87 | 2254 | 2270 | 543.0 |
| A | 11 | 79 | 9123 | 12.62 | 2254 | 2270 | 543.0 |
| B | 8 | 4 | 642220 | 1175.17 | 2314 | 2322 | 544.5 |
| B | 12 | 52 | 168312 | 304.84 | 2314 | 2322 | 544.5 |
| B | 0 | 244 | 130781 | 235.91 | 2314 | 2322 | 544.5 |
| C | 15 | 241 | 326174 | 553.05 | 2097 | 2171 | 585.9 |
| C | 3 | 79 | 40571 | 65.55 | 2097 | 2171 | 585.9 |
| C | 3 | 111 | 31740 | 50.47 | 2097 | 2171 | 585.9 |
| D | 13 | 169 | 6991054 | 11163.77 | 2008 | 2081 | 626.0 |
| D | 10 | 84 | 1006316 | 1604.11 | 2008 | 2081 | 626.0 |
| D | 1 | 83 | 41024 | 62.21 | 2008 | 2081 | 626.0 |
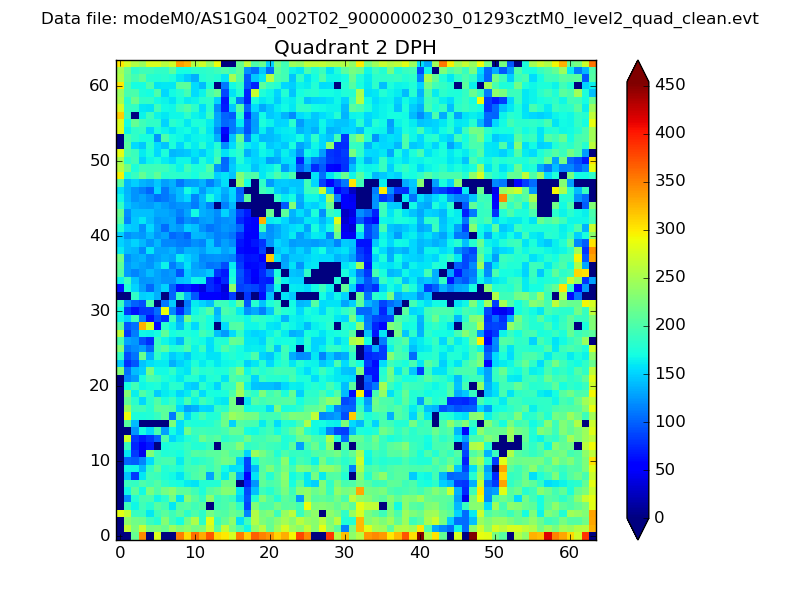
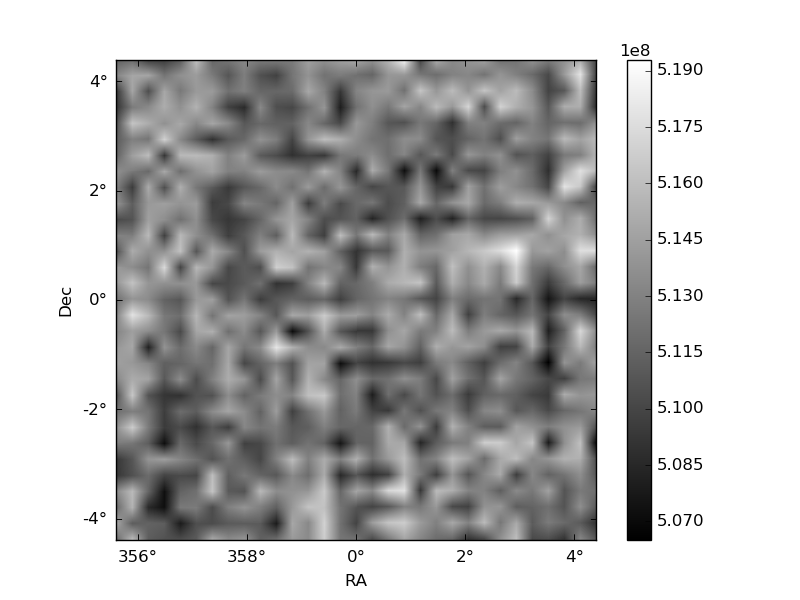
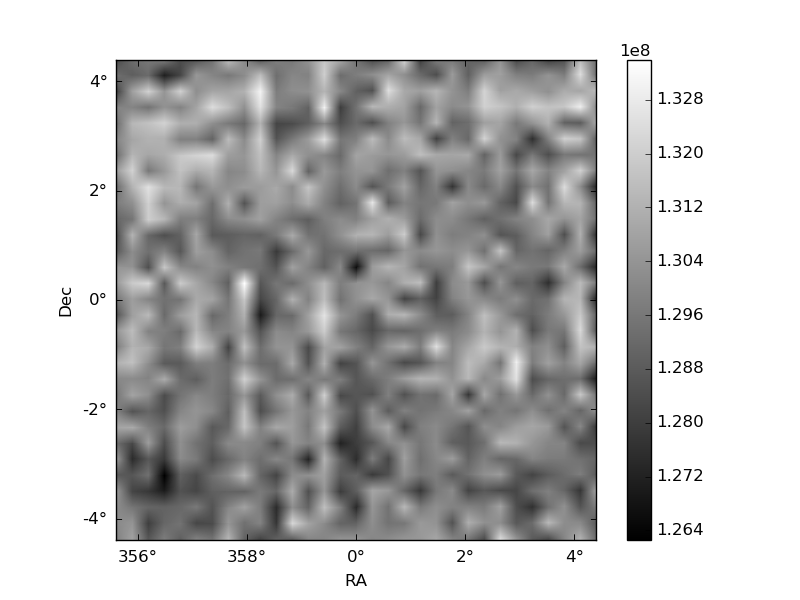
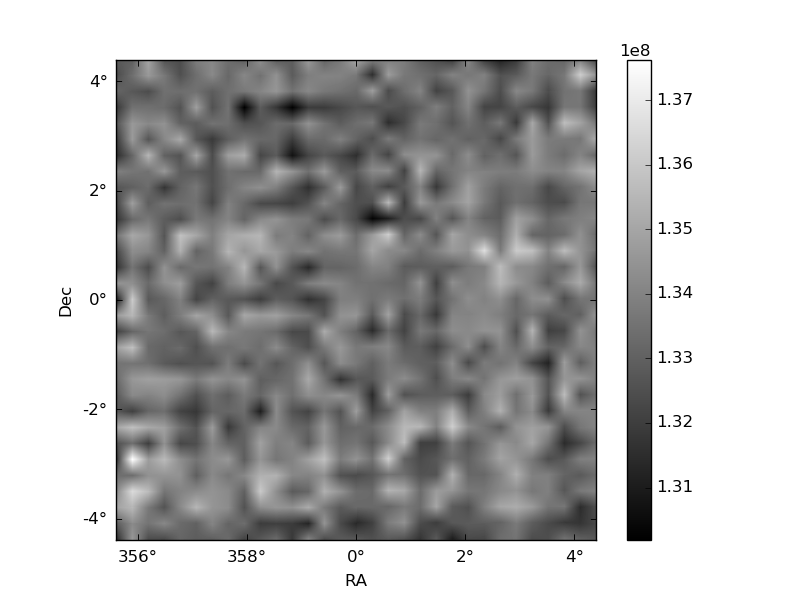
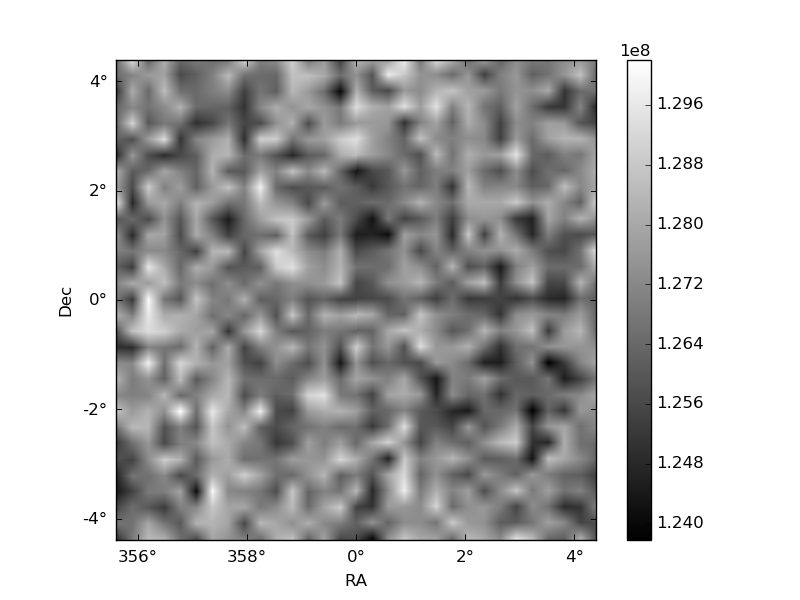
Histogram calculated using DETX and DETY for each event in the final _common_clean file
| Quadrant A | 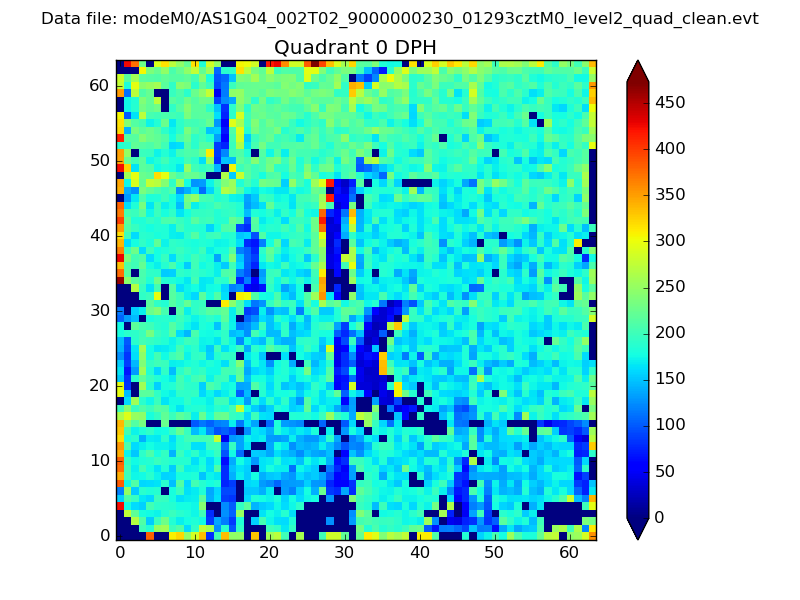 |
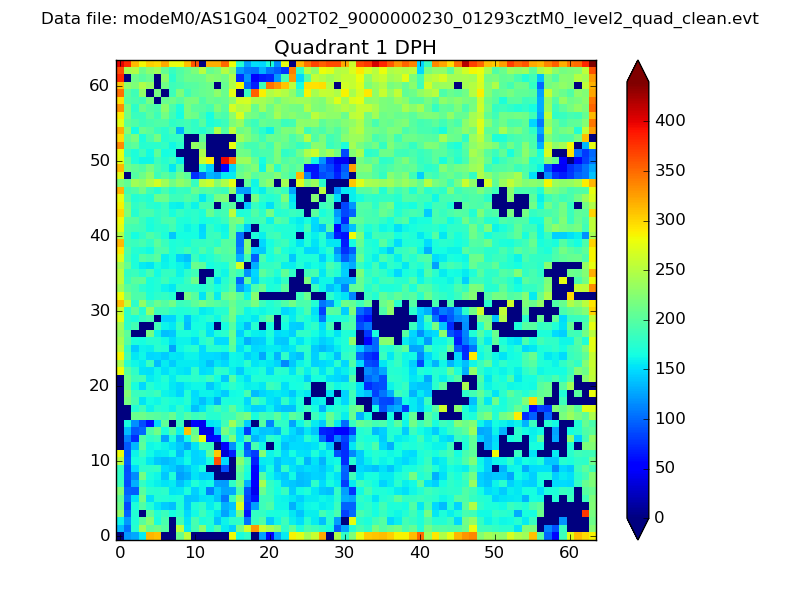 |
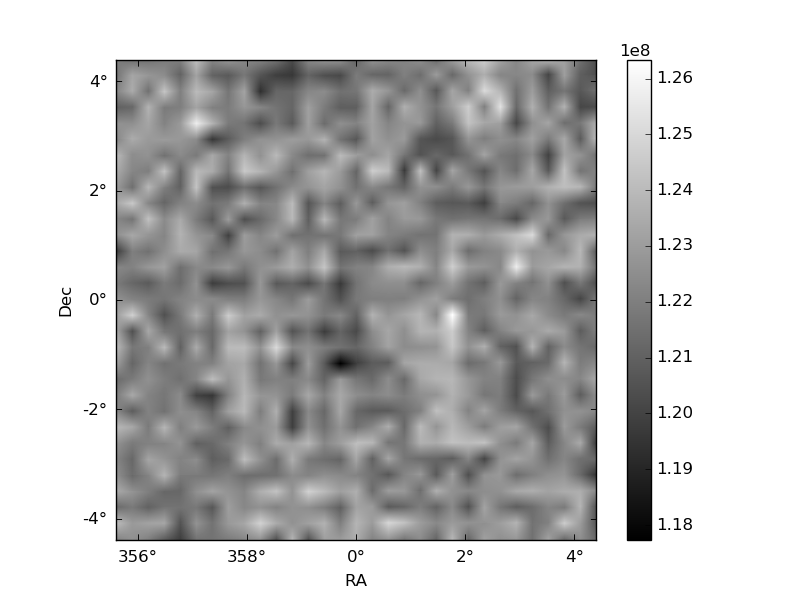
Quadrant B |
|---|---|---|---|
| Quadrant D | 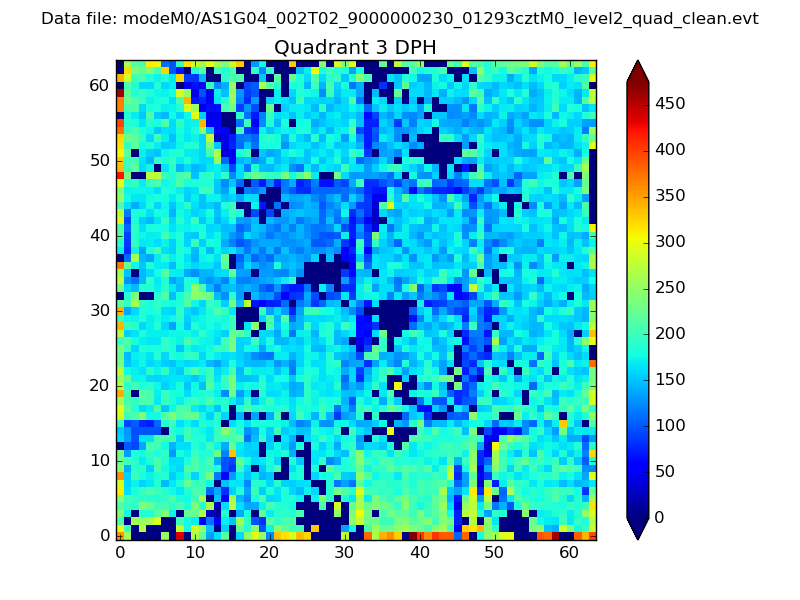 |
 |
Quadrant C |
| Plot type | Count rate plots | Images |
|---|---|---|
| Comparison with Poisson distribution Blue bars denote a histogram of data divided into 1 sec bins. Red curve is a Poisson curve with rate = median count rate of data. |
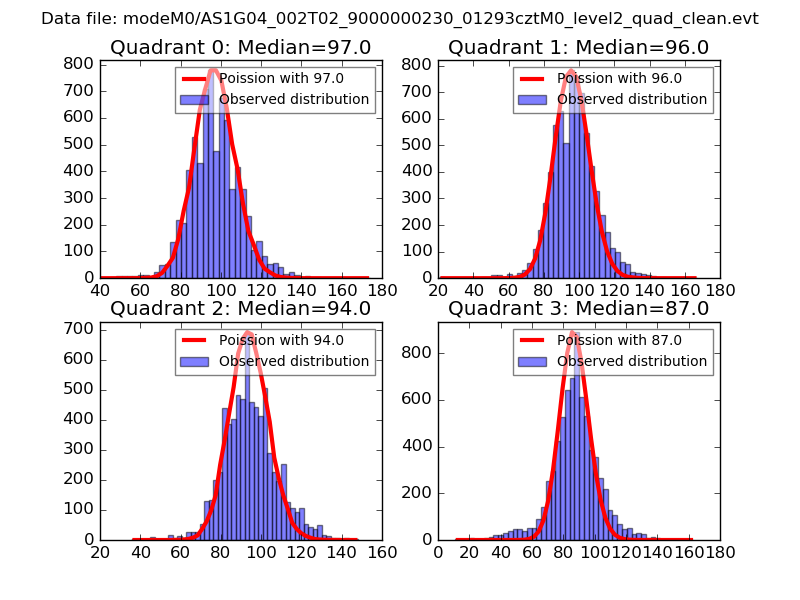 |
 |
| Quadrant-wise count rates Data is divided into 100 sec bins |
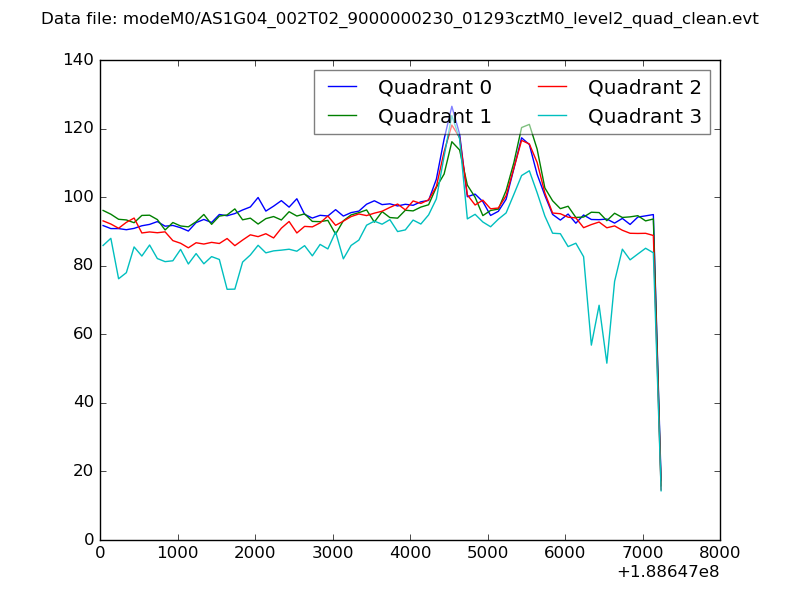 |
|
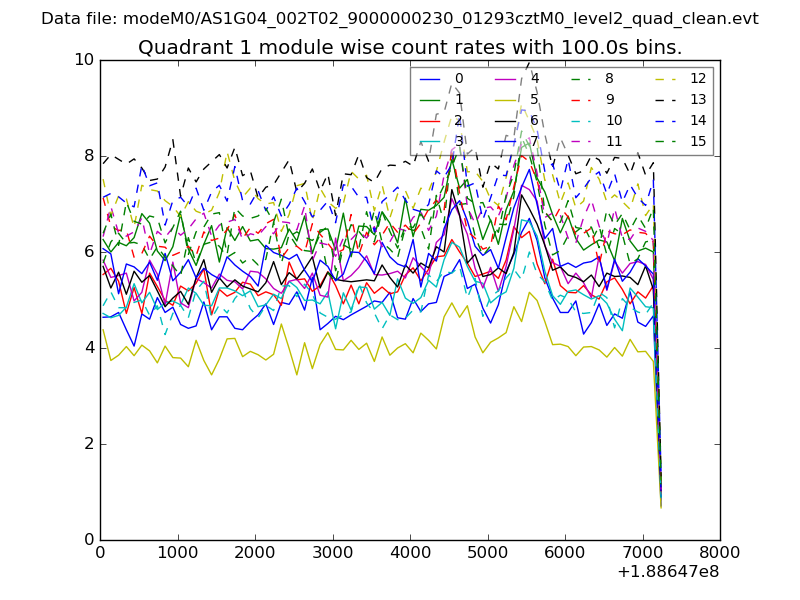
| Module-wise count rates for Quadrant A Data is divided into 100 sec bins |
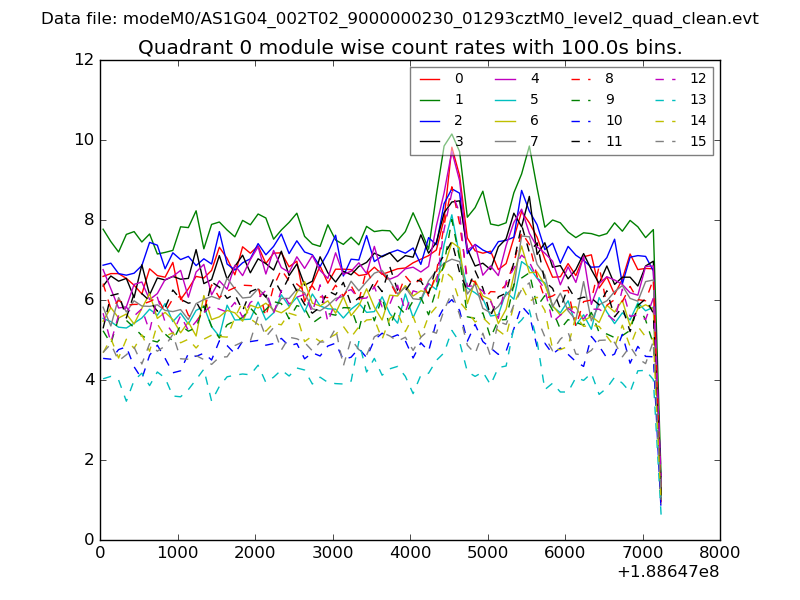 |
 |
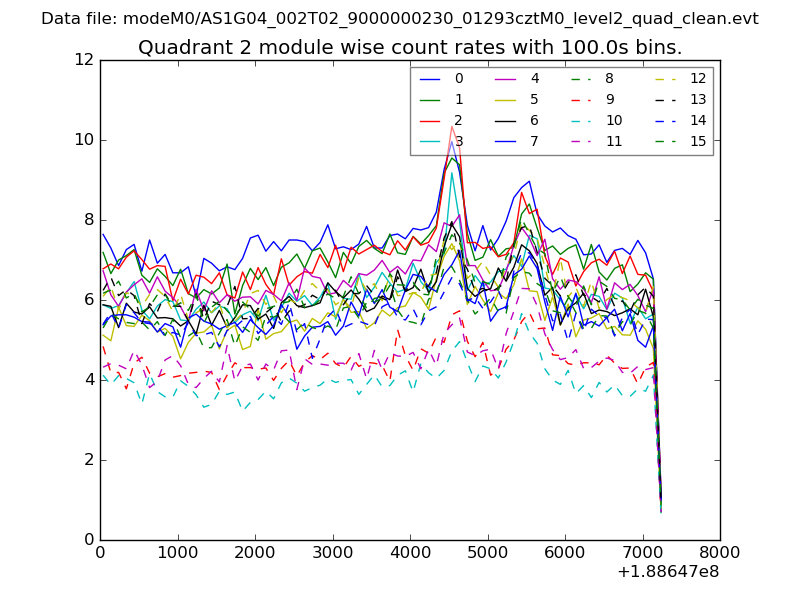
| Module-wise count rates for Quadrant B Data is divided into 100 sec bins |
 |
 |
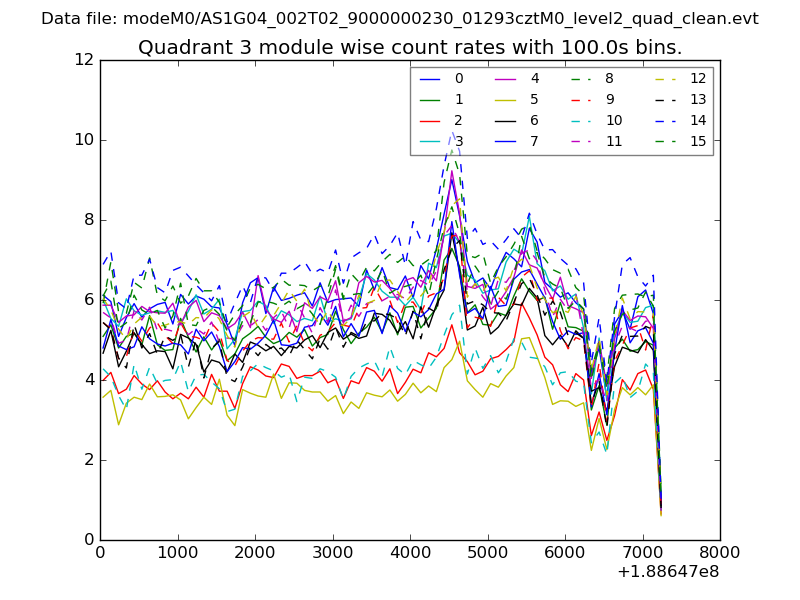
| Module-wise count rates for Quadrant C Data is divided into 100 sec bins |
 |
 |
| Module-wise count rates for Quadrant D Data is divided into 100 sec bins |
 |
 |
| Parameter | Plot |
|---|---|
| CZT HV Monitor | 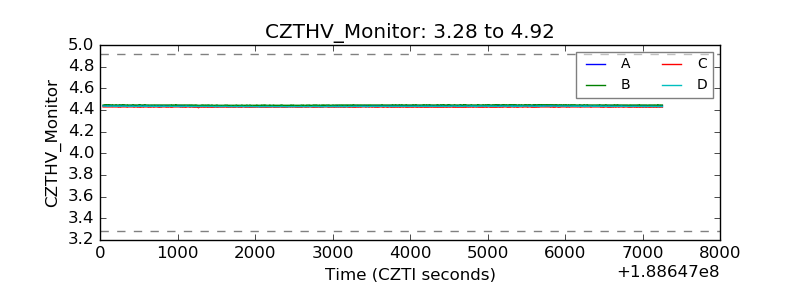 |
| D_VDD | 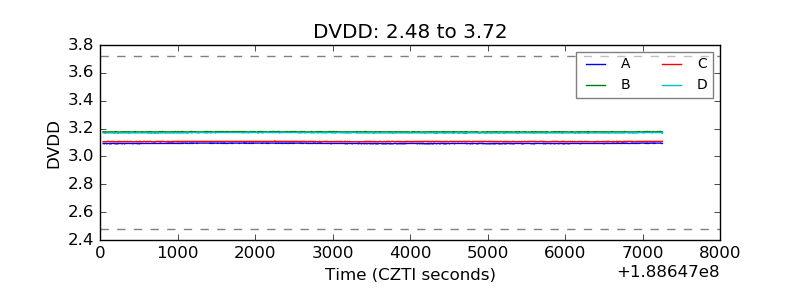 |
| Temperature 1 | 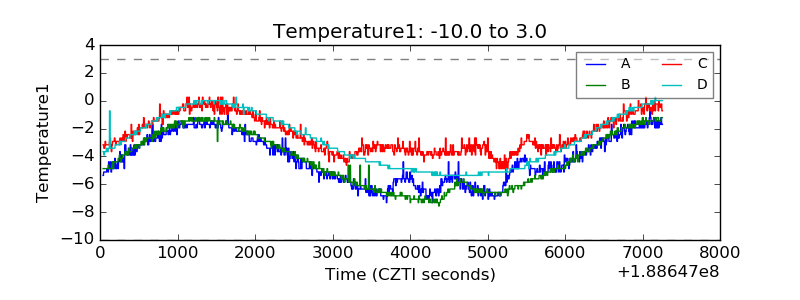 |
| Veto HV Monitor | 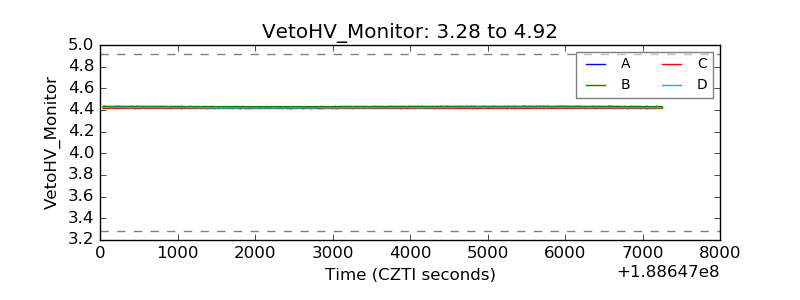 |
| Veto LLD | 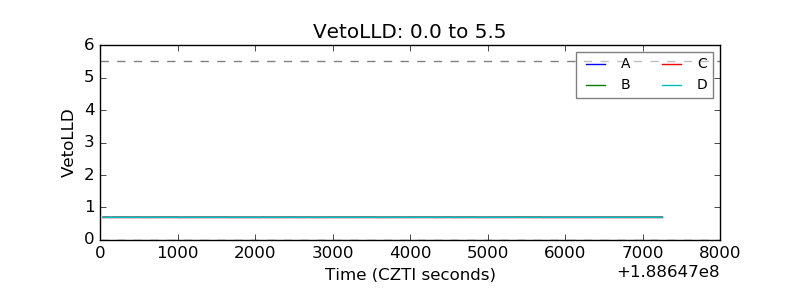 |
| Alpha Counter | 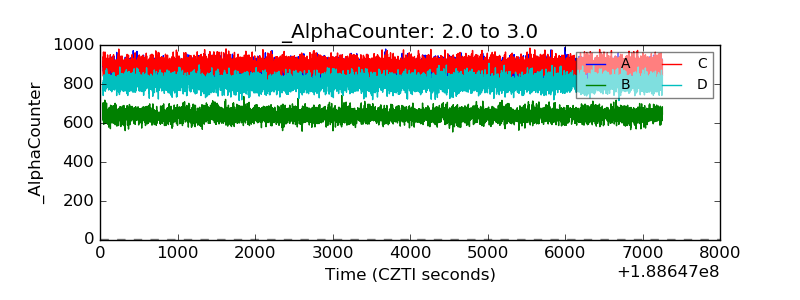 |
| _CPM_Rate | 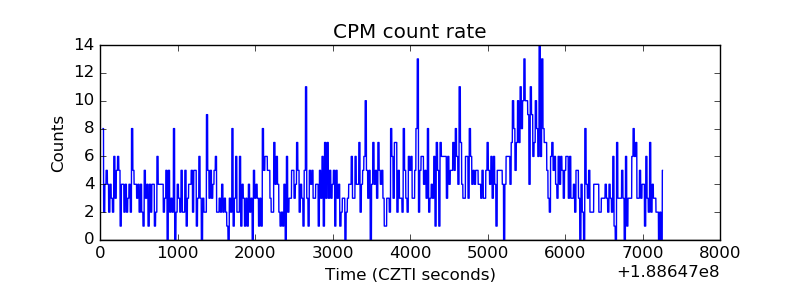 |
| CZT Counter | 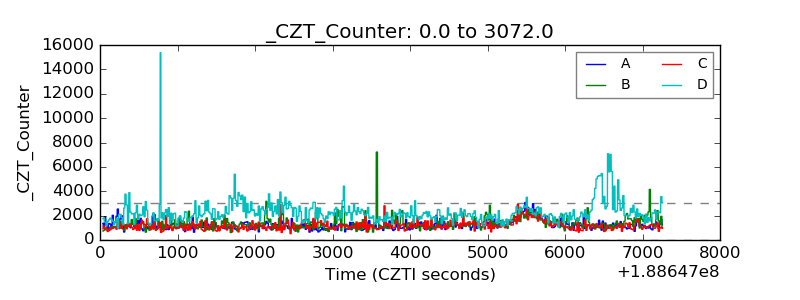 |
| +2.5 Volts monitor |  |
| +5 Volts monitor |  |
| _ROLL_ROT | 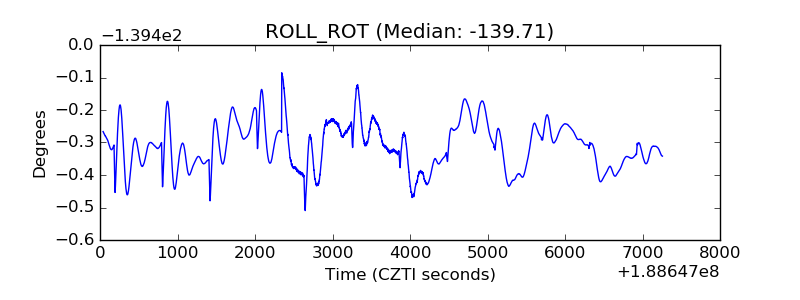 |
| _Roll_DEC |  |
| _Roll_RA | 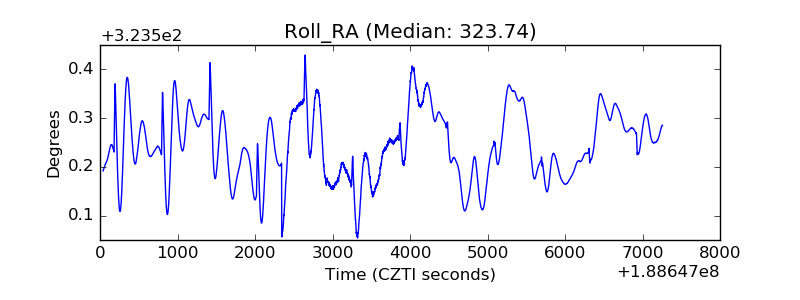 |
| Veto Counter | 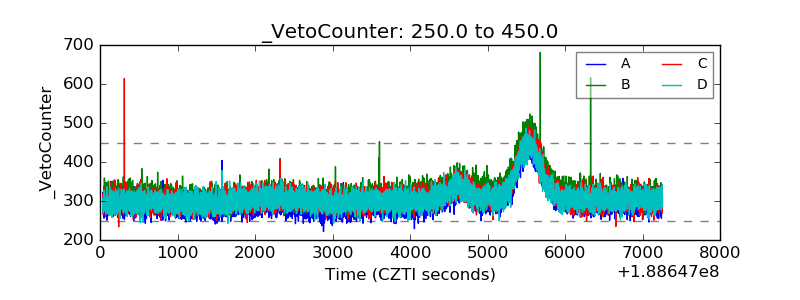 |