| Param | Original file | Final file |
|---|---|---|
| Filename | modeM0/AS1G04_002T02_9000000230_01294cztM0_level2.evt | modeM0/AS1G04_002T02_9000000230_01294cztM0_level2_quad_clean.evt |
| Size (bytes) | 1,366,032,960 | 99,230,400 |
| Size | 1.3 GB | 94.6 MB |
| Events in quadrant A | 8,415,988 | 655,194 |
| Events in quadrant B | 9,574,298 | 653,828 |
| Events in quadrant C | 8,200,433 | 635,888 |
| Events in quadrant D | 14,735,696 | 588,511 |
| Mode M9 | |||
|---|---|---|---|
| Quadrant | BADHDUFLAG | Total packets | Discarded packets |
| A | 0 | 2 | 0 |
| B | 0 | 2 | 0 |
| C | 0 | 2 | 0 |
| D | 0 | 2 | 0 |
| Mode M0 | |||
|---|---|---|---|
| Quadrant | BADHDUFLAG | Total packets | Discarded packets |
| A | 0 | 29822 | 2 |
| B | 0 | 33222 | 1 |
| C | 0 | 29150 | 1 |
| D | 0 | 48560 | 1 |
| Mode SS | |||
|---|---|---|---|
| Quadrant | BADHDUFLAG | Total packets | Discarded packets |
| A | 0 | 136 | 0 |
| B | 0 | 136 | 0 |
| C | 0 | 136 | 0 |
| D | 0 | 136 | 0 |
| Quadrant | Total seconds | Saturated seconds | Saturation percentage |
|---|---|---|---|
| A | 6768 | 92 | 1.359338% |
| B | 6768 | 73 | 1.078605% |
| C | 6768 | 49 | 0.723995% |
| D | 6768 | 719 | 10.623522% |
Noise dominated data is calculated using 1-second bins in cleaned event files. If a bin has >2000 counts, and if more than 50% of those come from <1% of pixels, then it is considered to be noise-dominated and hence unusable.
| Quadrant | # 1 sec bins | Bins with >0 counts | Bins with >2000 counts | High rate bins dominated by noise | Noise dominated (total time) | Noise dominated (detector-on time) | Marked lightcurve |
|---|---|---|---|---|---|---|---|
| A | 6958 | 6769 | 390 | 390 | 5.61% | 5.76% |  |
| B | 6958 | 6769 | 745 | 745 | 10.71% | 11.01% |  |
| C | 6958 | 6768 | 261 | 261 | 3.75% | 3.86% | 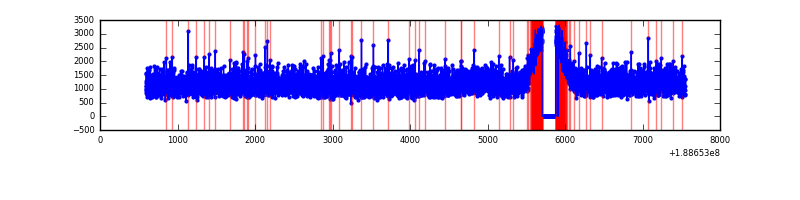 |
| D | 6958 | 6768 | 3895 | 3895 | 55.98% | 57.55% |  |
Top three noisy pixels from each quadrant. If the there are fewer than three noisy pixels in the level2.evt file, extra rows are filled as -1
| Pixel properties | Quadrant properties | ||||||
|---|---|---|---|---|---|---|---|
| Quadrant | DetID | PixID | Counts | Sigma | Mean | Median | Sigma |
| A | 4 | 32 | 294008 | 570.89 | 2115 | 2130 | 511.3 |
| A | 11 | 79 | 8257 | 11.98 | 2115 | 2130 | 511.3 |
| A | 3 | 111 | 6453 | 8.46 | 2115 | 2130 | 511.3 |
| B | 8 | 4 | 852409 | 1646.71 | 2189 | 2197 | 516.3 |
| B | 12 | 52 | 179801 | 343.99 | 2189 | 2197 | 516.3 |
| B | 6 | 53 | 106259 | 201.55 | 2189 | 2197 | 516.3 |
| C | 15 | 241 | 308131 | 545.64 | 2000 | 2070 | 560.9 |
| C | 3 | 79 | 38763 | 65.42 | 2000 | 2070 | 560.9 |
| C | 3 | 111 | 29707 | 49.27 | 2000 | 2070 | 560.9 |
| D | 13 | 169 | 7041258 | 11728.1 | 1921 | 1987 | 600.2 |
| D | 10 | 84 | 375466 | 622.25 | 1921 | 1987 | 600.2 |
| D | 2 | 88 | 44526 | 70.87 | 1921 | 1987 | 600.2 |
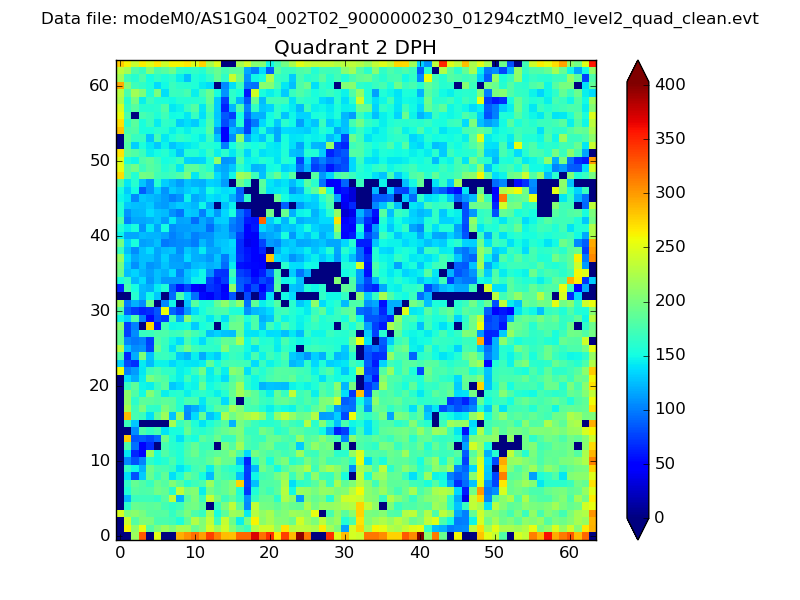
Histogram calculated using DETX and DETY for each event in the final _common_clean file
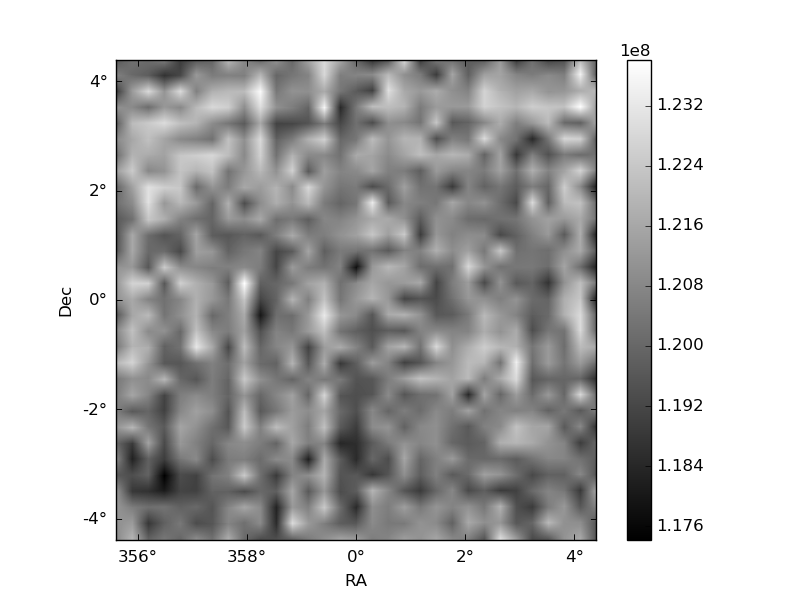
| Quadrant A | 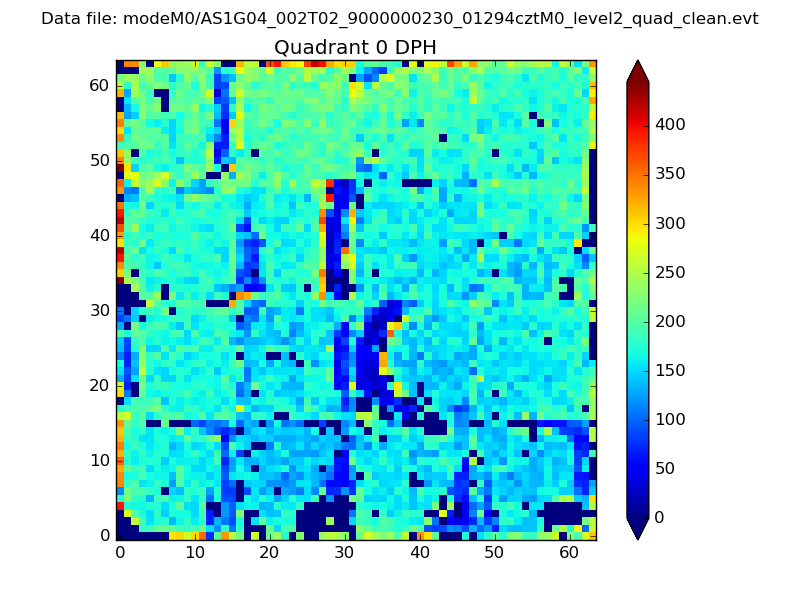 |
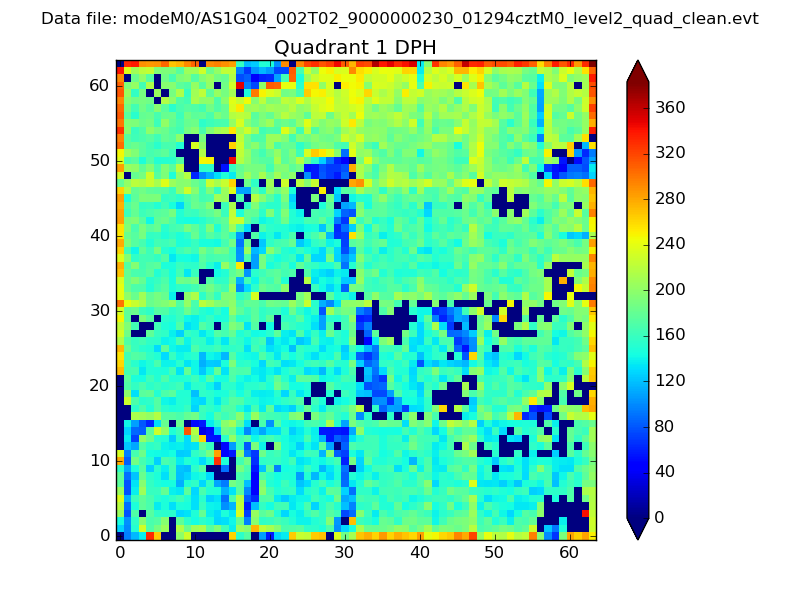 |
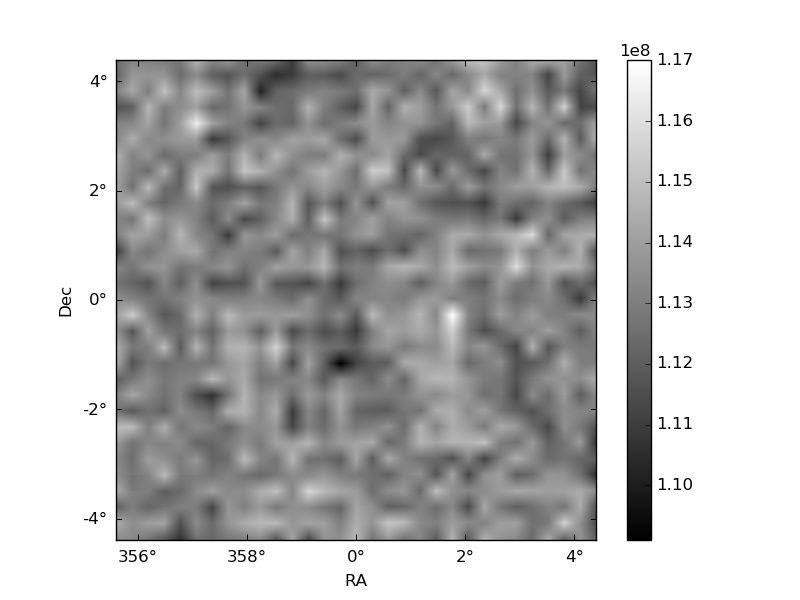
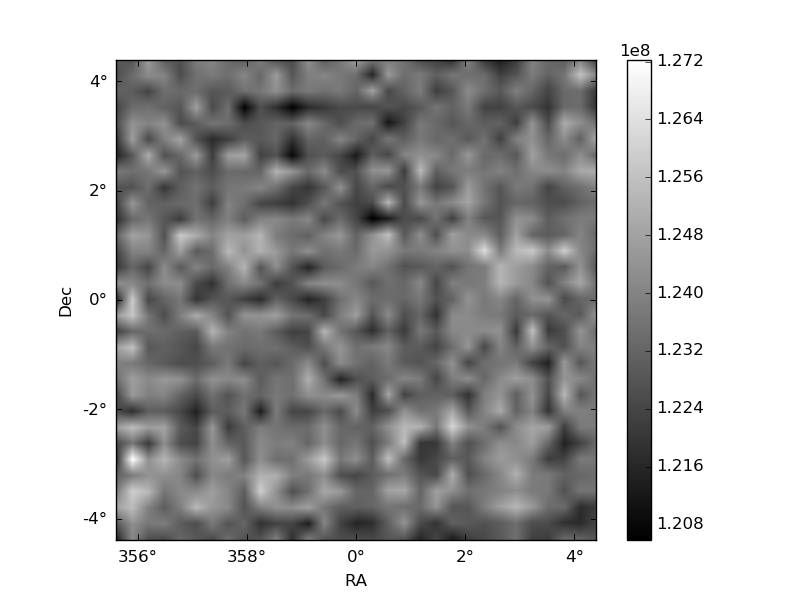
Quadrant B |
|---|---|---|---|
| Quadrant D | 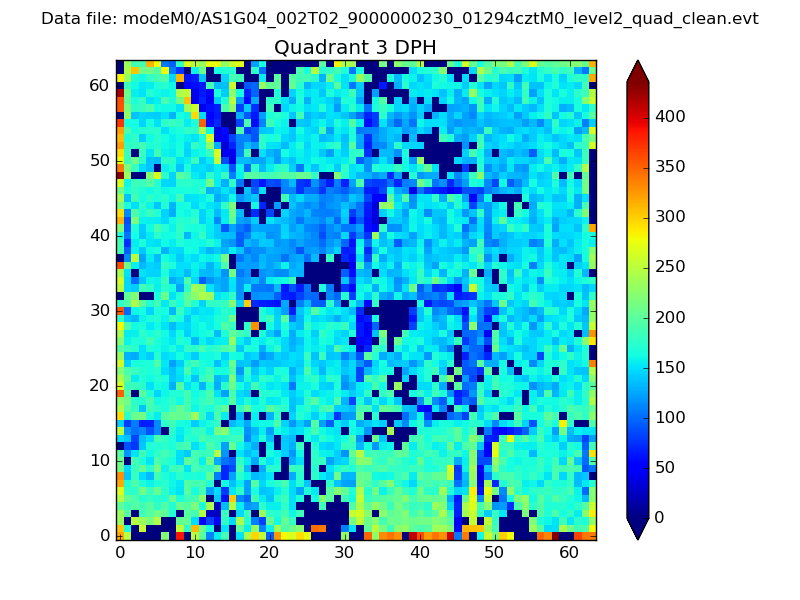 |
 |
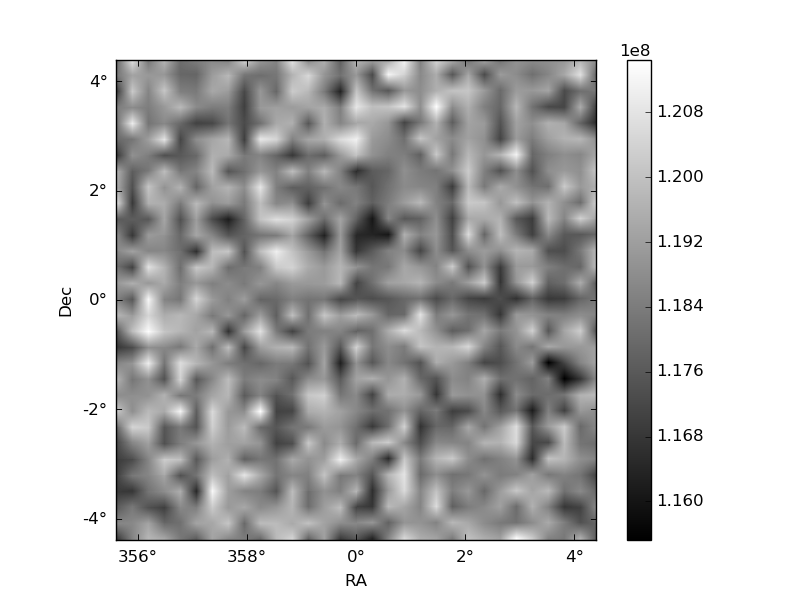
Quadrant C |
| Plot type | Count rate plots | Images |
|---|---|---|
| Comparison with Poisson distribution Blue bars denote a histogram of data divided into 1 sec bins. Red curve is a Poisson curve with rate = median count rate of data. |
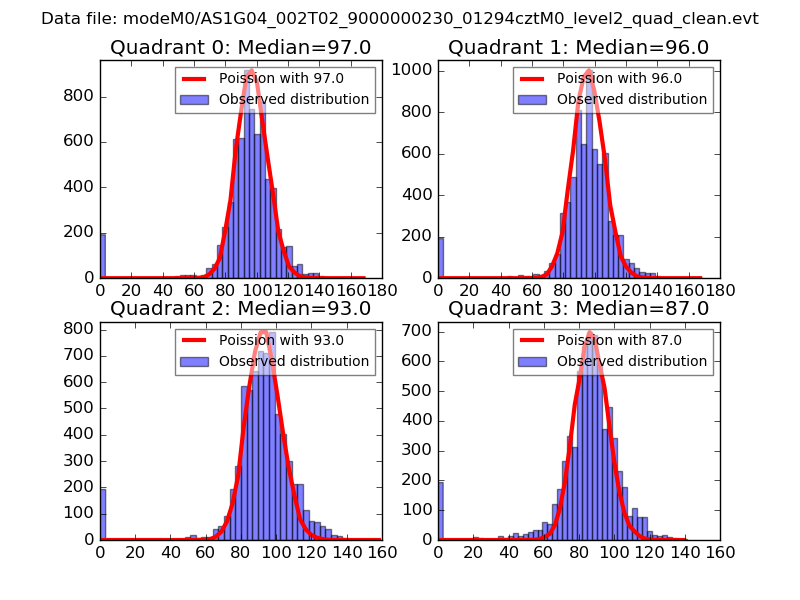 |
 |
| Quadrant-wise count rates Data is divided into 100 sec bins |
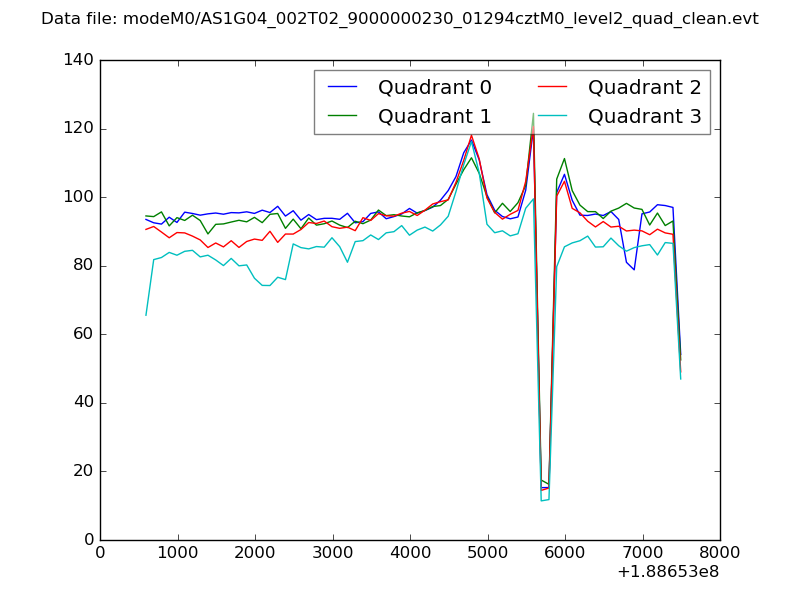 |
|
| Module-wise count rates for Quadrant A Data is divided into 100 sec bins |
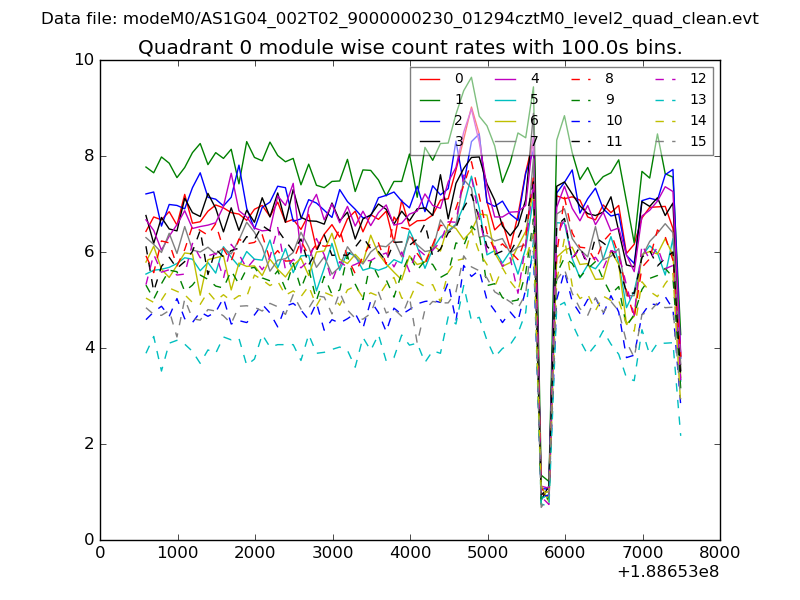 |
 |
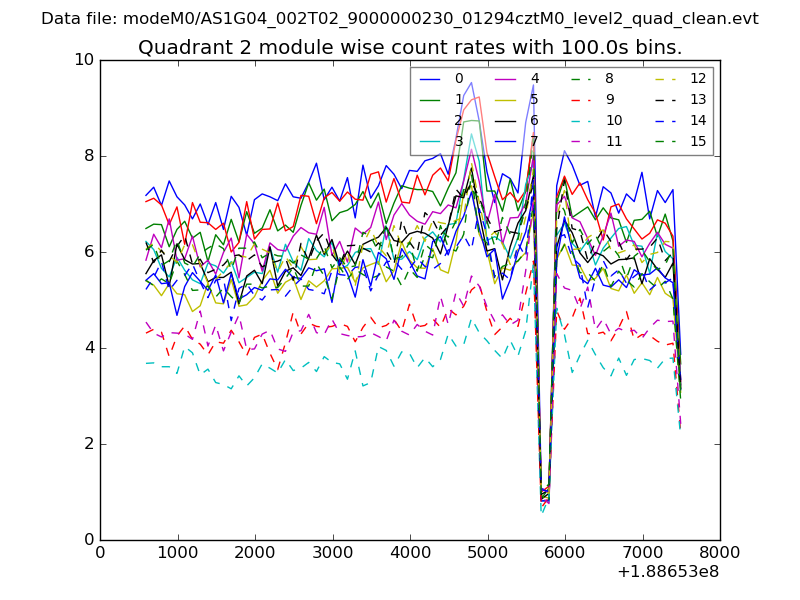
| Module-wise count rates for Quadrant B Data is divided into 100 sec bins |
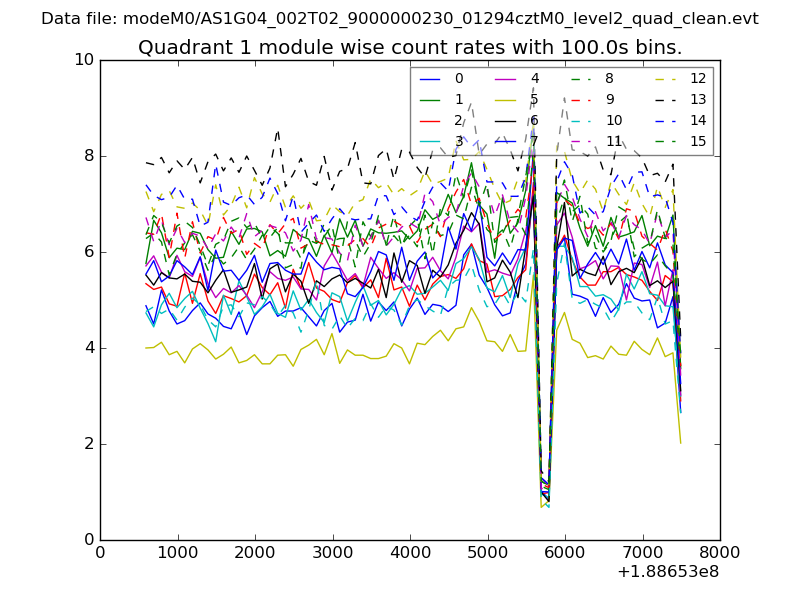 |
 |
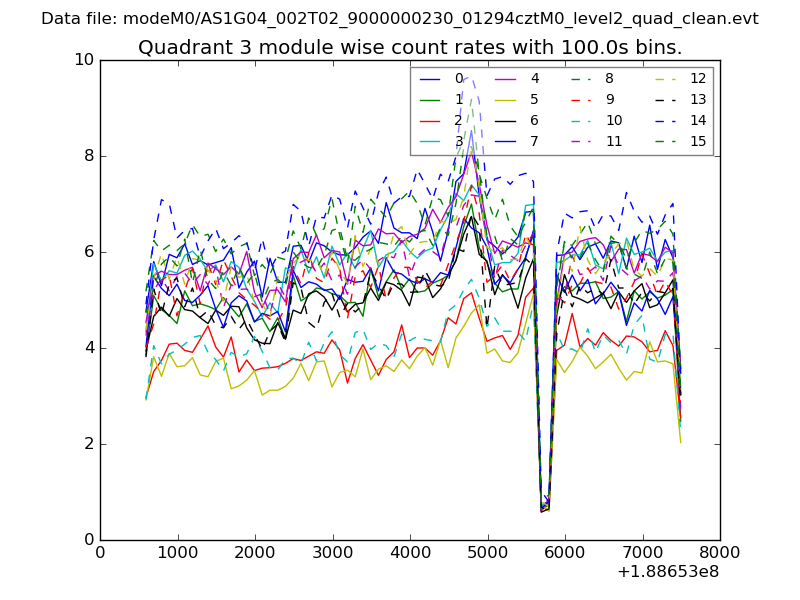
| Module-wise count rates for Quadrant C Data is divided into 100 sec bins |
 |
 |
| Module-wise count rates for Quadrant D Data is divided into 100 sec bins |
 |
 |
| Parameter | Plot |
|---|---|
| CZT HV Monitor | 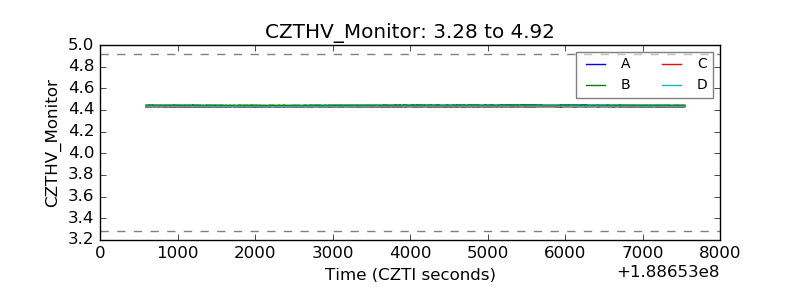 |
| D_VDD | 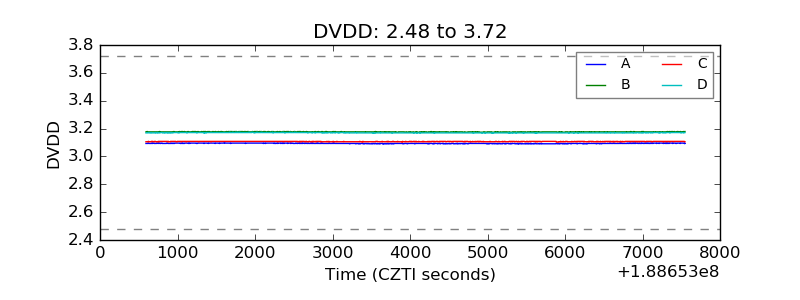 |
| Temperature 1 | 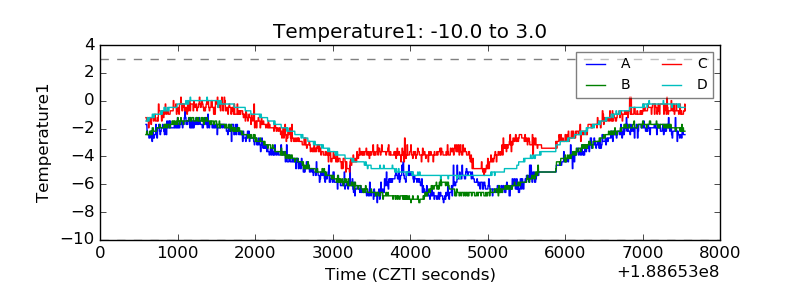 |
| Veto HV Monitor | 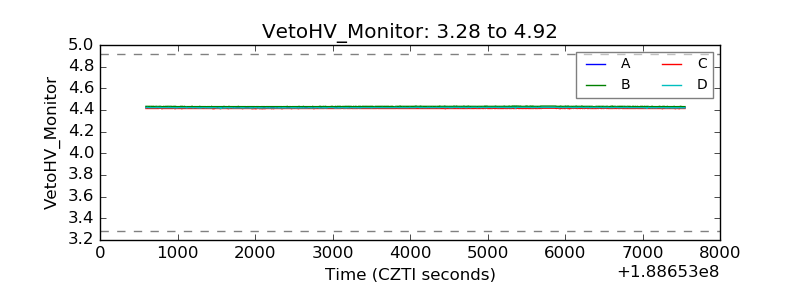 |
| Veto LLD | 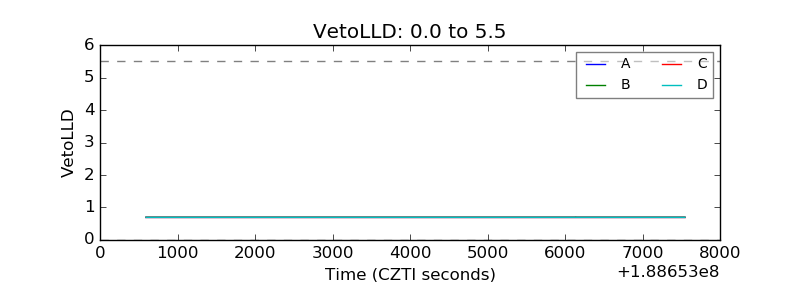 |
| Alpha Counter | 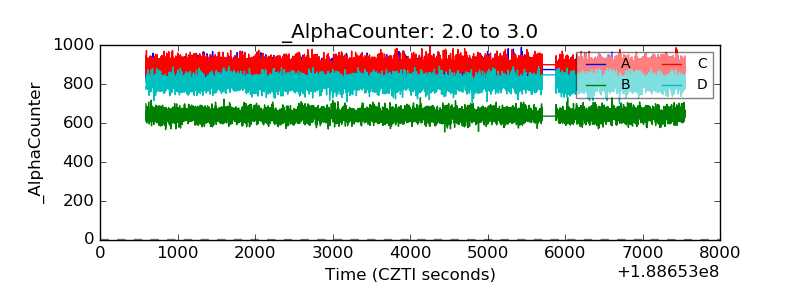 |
| _CPM_Rate | 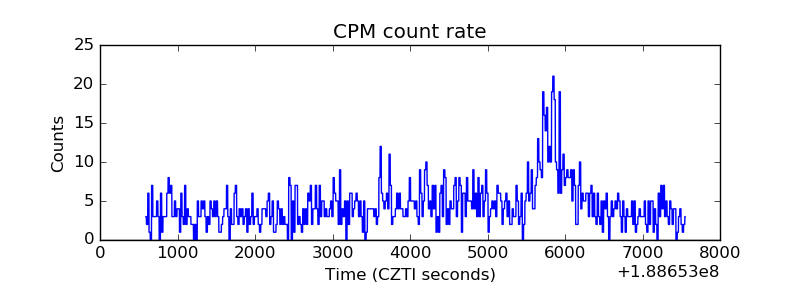 |
| CZT Counter | 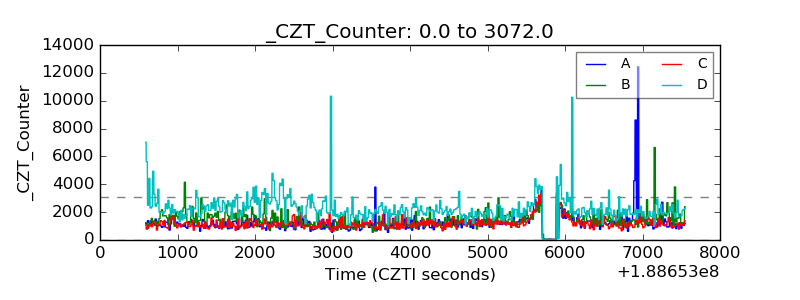 |
| +2.5 Volts monitor |  |
| +5 Volts monitor |  |
| _ROLL_ROT | 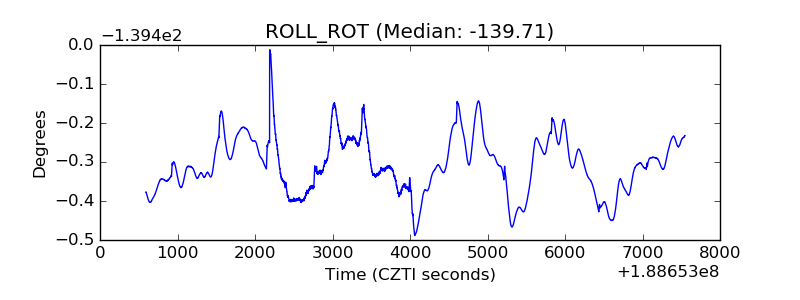 |
| _Roll_DEC | 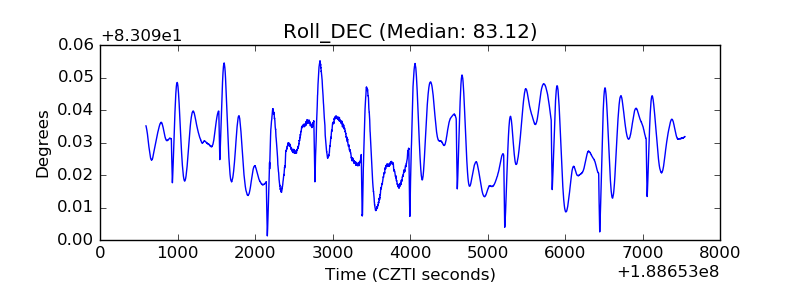 |
| _Roll_RA | 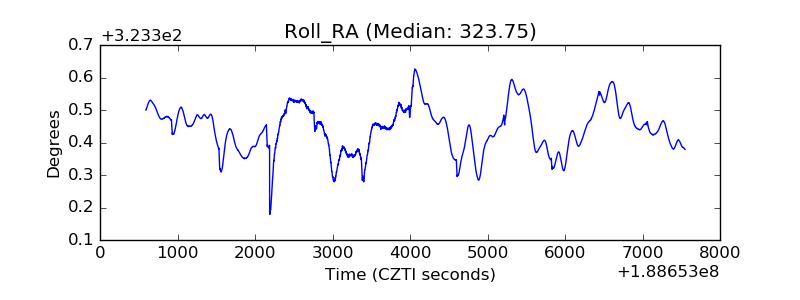 |
| Veto Counter | 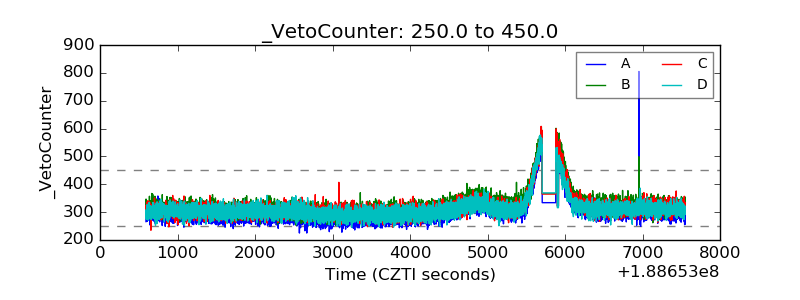 |