| Param | Original file | Final file |
|---|---|---|
| Filename | modeM0/AS1G04_002T02_9000000230_01295cztM0_level2.evt | modeM0/AS1G04_002T02_9000000230_01295cztM0_level2_quad_clean.evt |
| Size (bytes) | 1,415,128,320 | 99,420,480 |
| Size | 1.3 GB | 94.8 MB |
| Events in quadrant A | 8,759,943 | 660,661 |
| Events in quadrant B | 9,427,508 | 661,883 |
| Events in quadrant C | 8,352,743 | 640,661 |
| Events in quadrant D | 15,866,684 | 569,146 |
| Mode M9 | |||
|---|---|---|---|
| Quadrant | BADHDUFLAG | Total packets | Discarded packets |
| A | 0 | 5 | 0 |
| B | 0 | 5 | 0 |
| C | 0 | 5 | 0 |
| D | 0 | 5 | 0 |
| Mode M0 | |||
|---|---|---|---|
| Quadrant | BADHDUFLAG | Total packets | Discarded packets |
| A | 0 | 30909 | 2 |
| B | 0 | 32886 | 1 |
| C | 0 | 29683 | 1 |
| D | 0 | 52151 | 1 |
| Mode SS | |||
|---|---|---|---|
| Quadrant | BADHDUFLAG | Total packets | Discarded packets |
| A | 0 | 138 | 0 |
| B | 0 | 138 | 0 |
| C | 0 | 138 | 0 |
| D | 0 | 138 | 0 |
| Quadrant | Total seconds | Saturated seconds | Saturation percentage |
|---|---|---|---|
| A | 6859 | 126 | 1.837002% |
| B | 6859 | 71 | 1.035136% |
| C | 6859 | 30 | 0.437382% |
| D | 6859 | 1741 | 25.382709% |
Noise dominated data is calculated using 1-second bins in cleaned event files. If a bin has >2000 counts, and if more than 50% of those come from <1% of pixels, then it is considered to be noise-dominated and hence unusable.
| Quadrant | # 1 sec bins | Bins with >0 counts | Bins with >2000 counts | High rate bins dominated by noise | Noise dominated (total time) | Noise dominated (detector-on time) | Marked lightcurve |
|---|---|---|---|---|---|---|---|
| A | 7344 | 6860 | 436 | 436 | 5.94% | 6.36% | 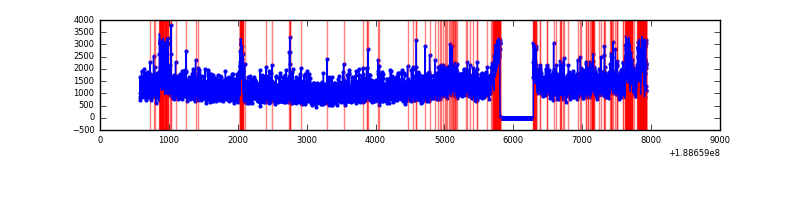 |
| B | 7344 | 6860 | 610 | 610 | 8.31% | 8.89% | 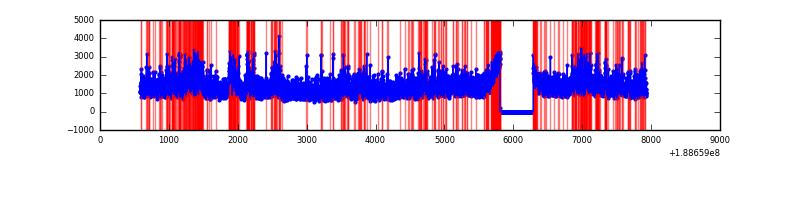 |
| C | 7344 | 6859 | 196 | 196 | 2.67% | 2.86% | 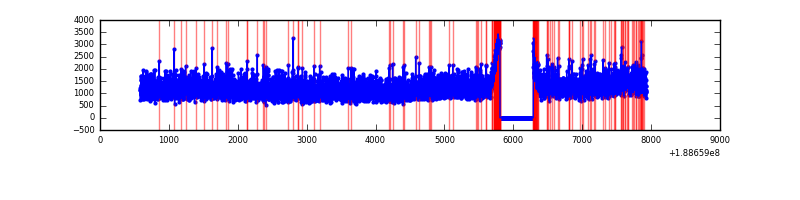 |
| D | 7343 | 6858 | 4315 | 4315 | 58.76% | 62.92% | 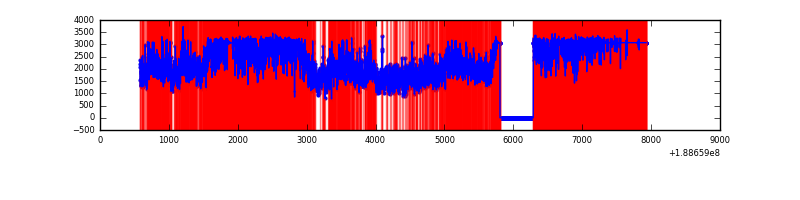 |
Top three noisy pixels from each quadrant. If the there are fewer than three noisy pixels in the level2.evt file, extra rows are filled as -1
| Pixel properties | Quadrant properties | ||||||
|---|---|---|---|---|---|---|---|
| Quadrant | DetID | PixID | Counts | Sigma | Mean | Median | Sigma |
| A | 4 | 32 | 719754 | 1422.38 | 2092 | 2107 | 504.5 |
| A | 11 | 79 | 8421 | 12.51 | 2092 | 2107 | 504.5 |
| A | 13 | 9 | 7609 | 10.91 | 2092 | 2107 | 504.5 |
| B | 8 | 4 | 747598 | 1461.24 | 2174 | 2185 | 510.1 |
| B | 6 | 53 | 264603 | 514.42 | 2174 | 2185 | 510.1 |
| B | 15 | 22 | 58263 | 109.93 | 2174 | 2185 | 510.1 |
| C | 15 | 241 | 340370 | 607.06 | 1999 | 2073 | 557.3 |
| C | 8 | 208 | 96997 | 170.34 | 1999 | 2073 | 557.3 |
| C | 3 | 79 | 39989 | 68.04 | 1999 | 2073 | 557.3 |
| D | 13 | 169 | 8172925 | 14265.61 | 1839 | 1908 | 572.8 |
| D | 10 | 84 | 579465 | 1008.34 | 1839 | 1908 | 572.8 |
| D | 12 | 22 | 93477 | 159.87 | 1839 | 1908 | 572.8 |
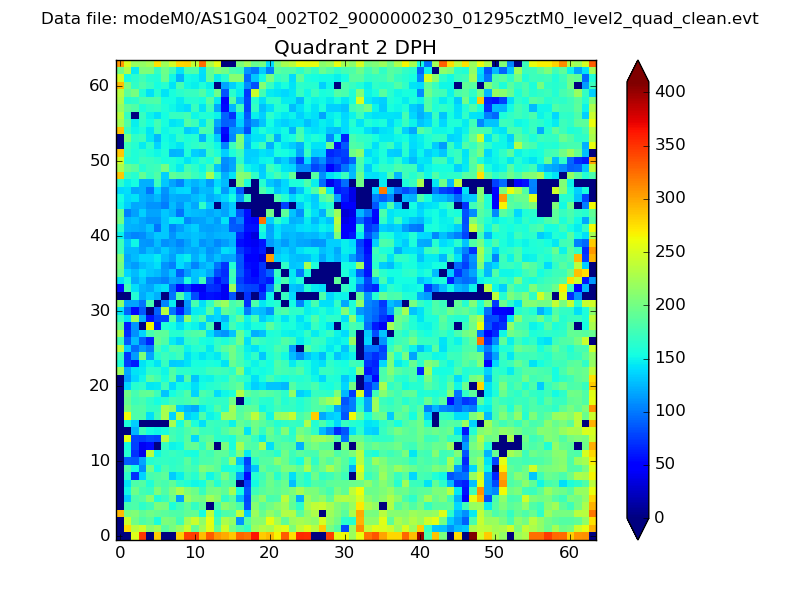
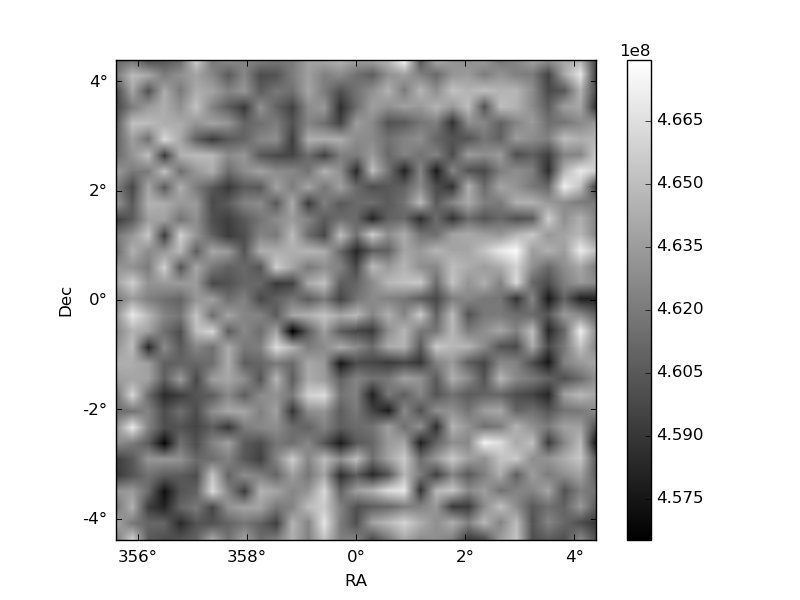
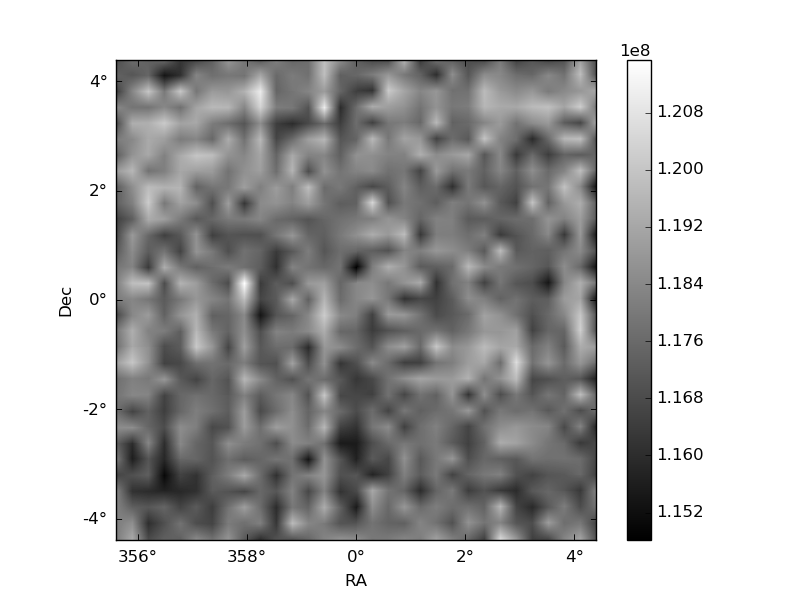
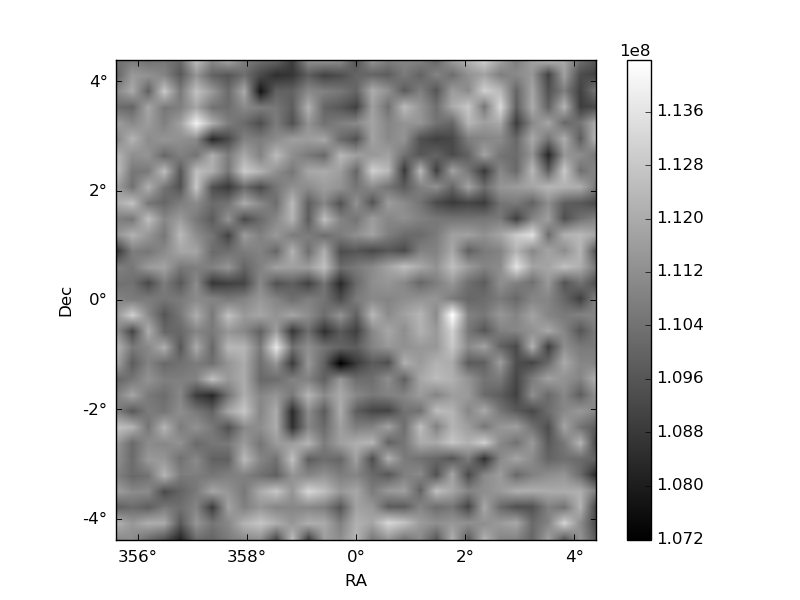
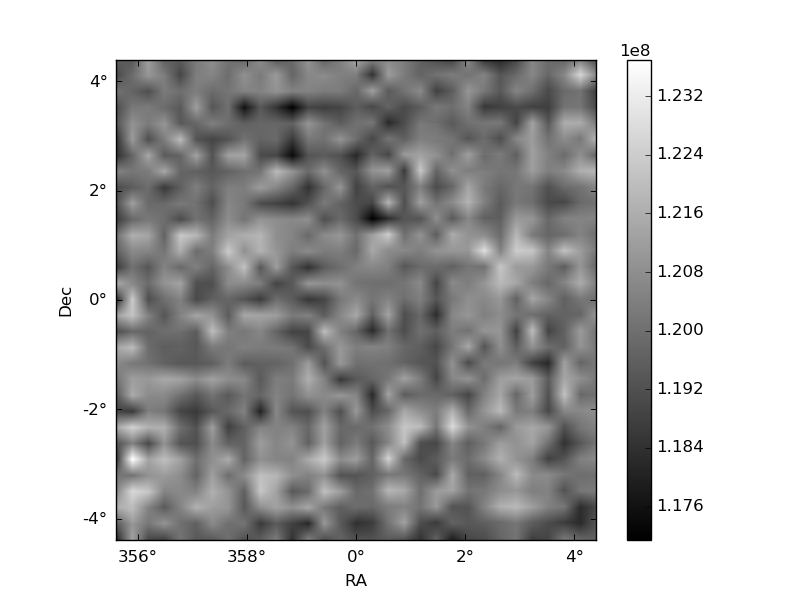
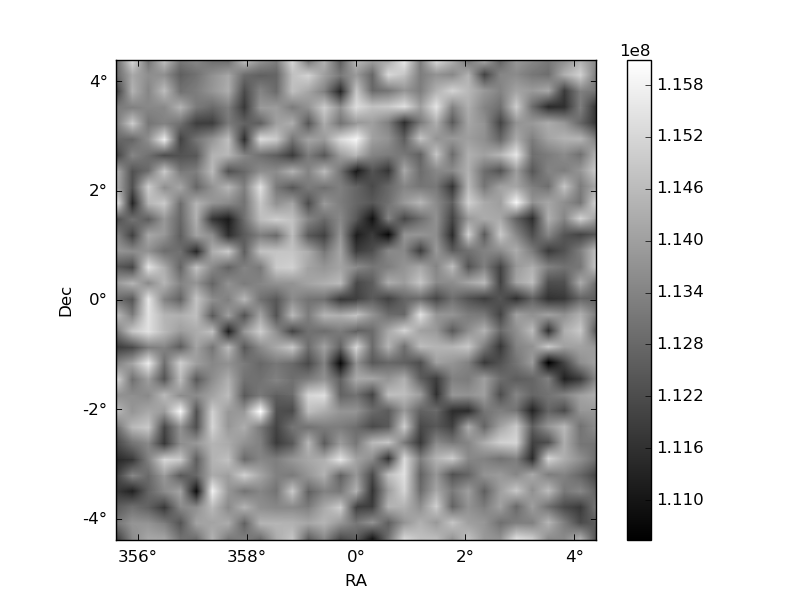
Histogram calculated using DETX and DETY for each event in the final _common_clean file
| Quadrant A | 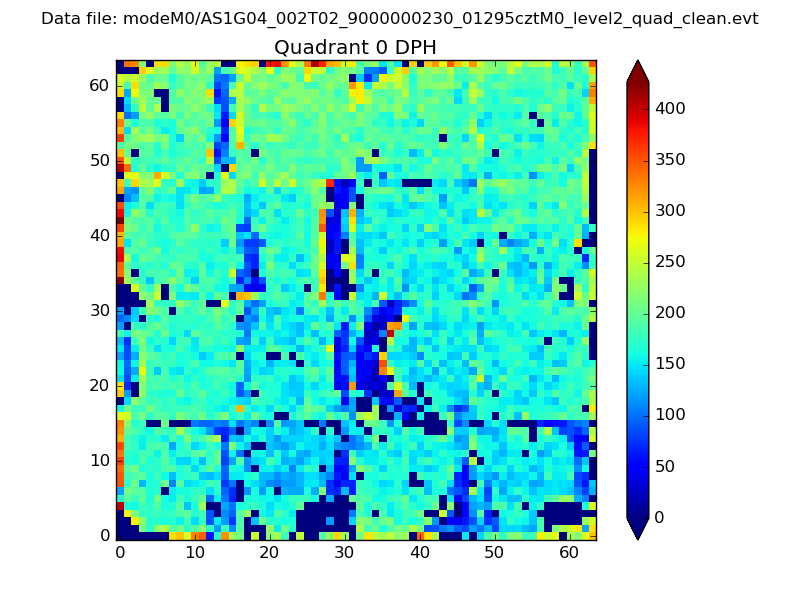 |
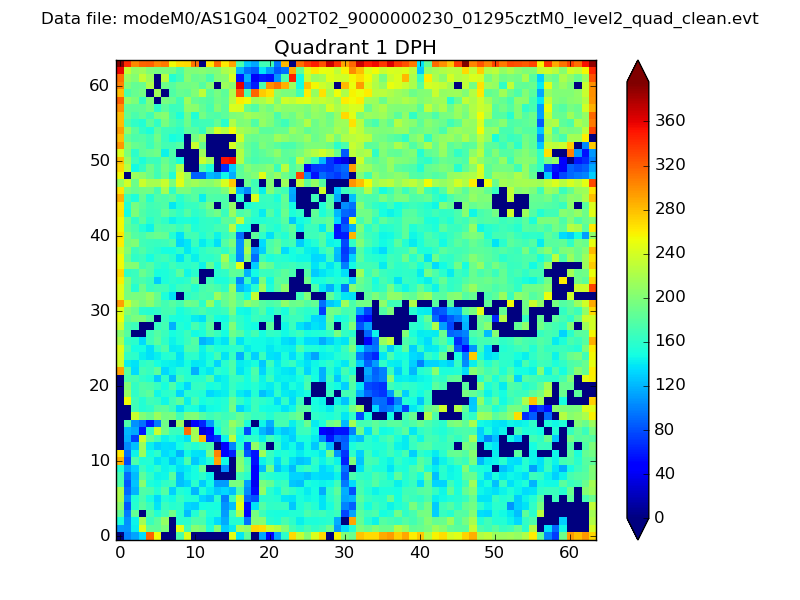 |
Quadrant B |
|---|---|---|---|
| Quadrant D | 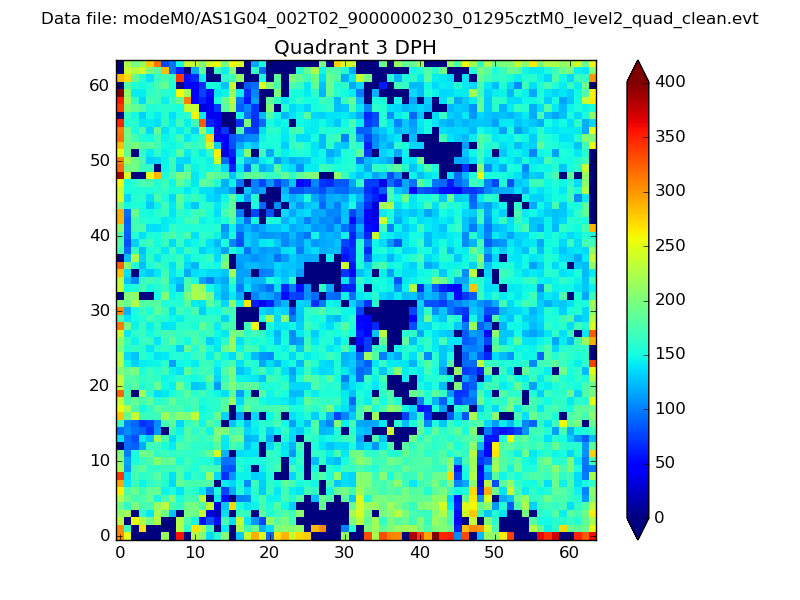 |
 |
Quadrant C |
| Plot type | Count rate plots | Images |
|---|---|---|
| Comparison with Poisson distribution Blue bars denote a histogram of data divided into 1 sec bins. Red curve is a Poisson curve with rate = median count rate of data. |
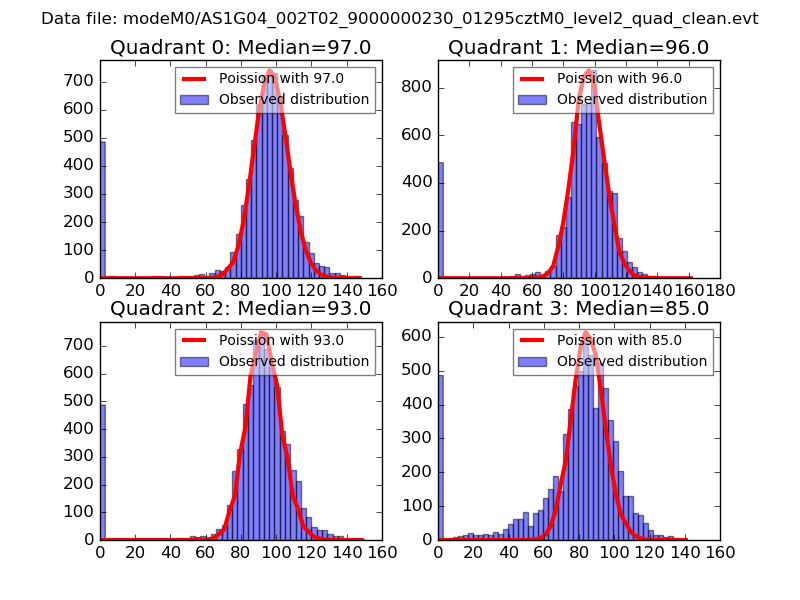 |
 |
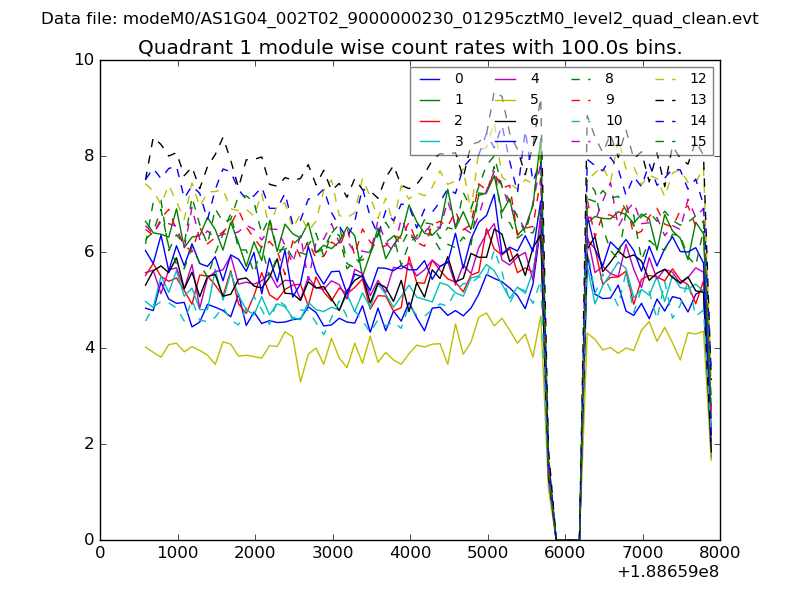
| Quadrant-wise count rates Data is divided into 100 sec bins |
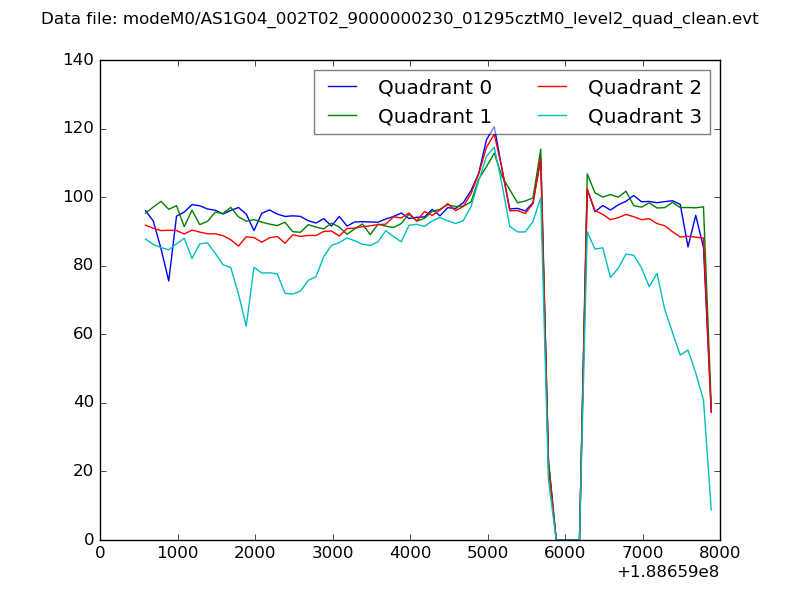 |
|
| Module-wise count rates for Quadrant A Data is divided into 100 sec bins |
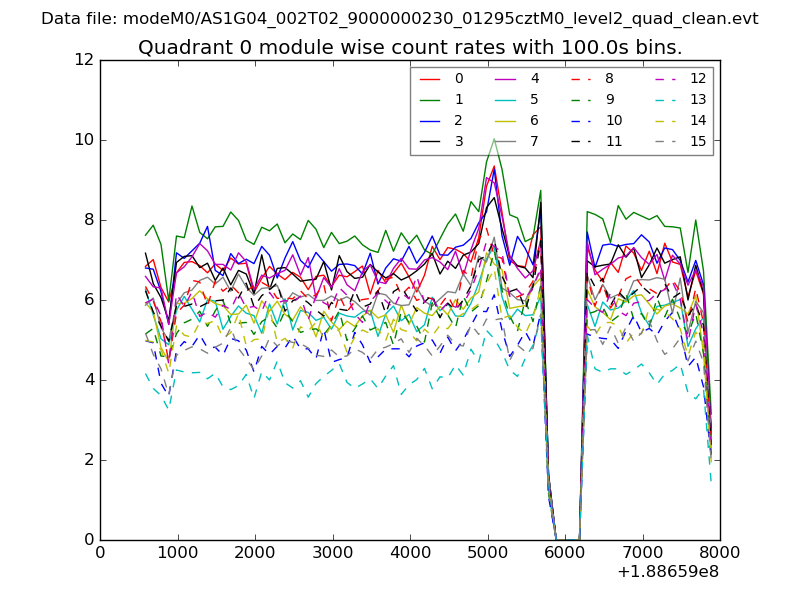 |
 |
| Module-wise count rates for Quadrant B Data is divided into 100 sec bins |
 |
 |
| Module-wise count rates for Quadrant C Data is divided into 100 sec bins |
 |
 |
| Module-wise count rates for Quadrant D Data is divided into 100 sec bins |
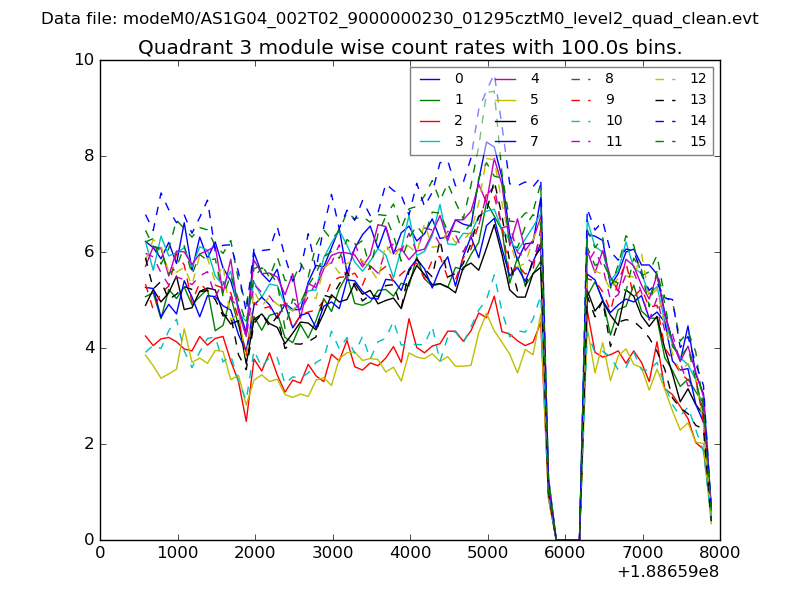 |
 |
| Parameter | Plot |
|---|---|
| CZT HV Monitor | 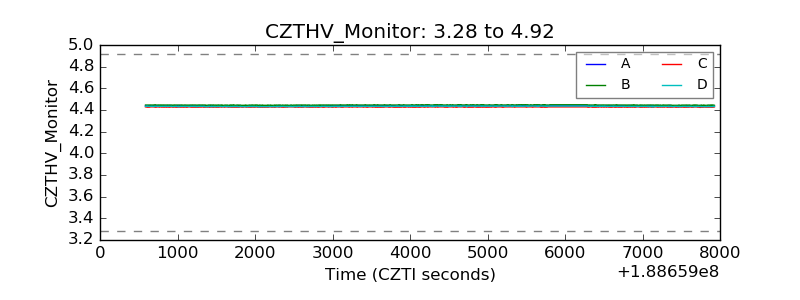 |
| D_VDD | 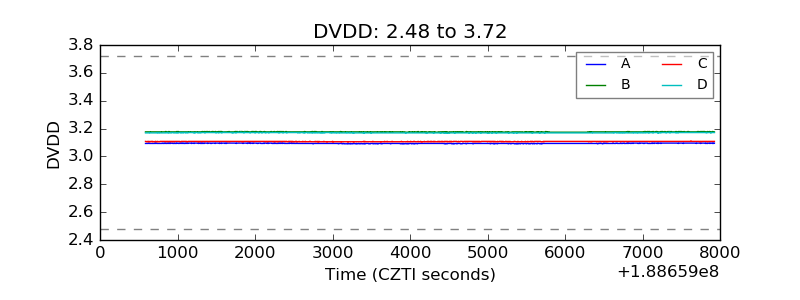 |
| Temperature 1 | 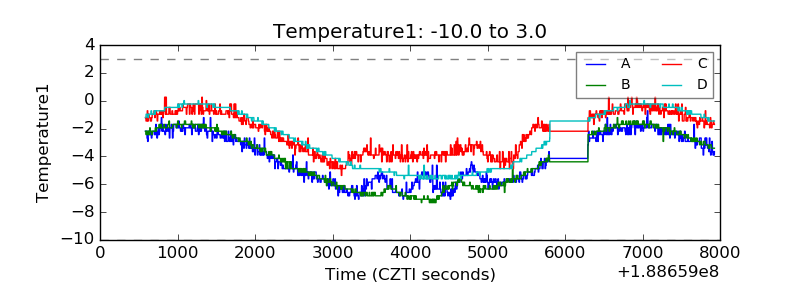 |
| Veto HV Monitor | 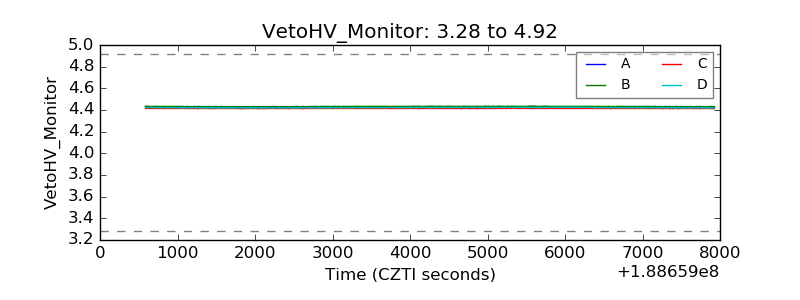 |
| Veto LLD | 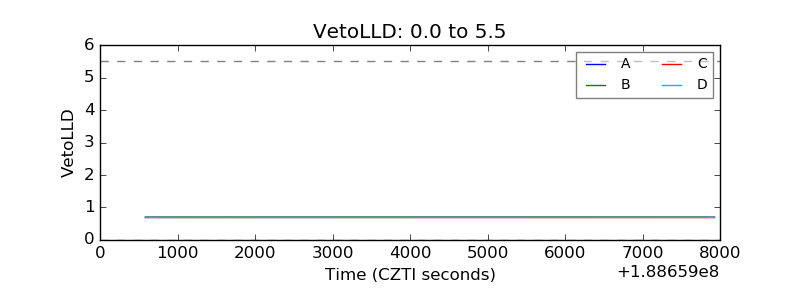 |
| Alpha Counter | 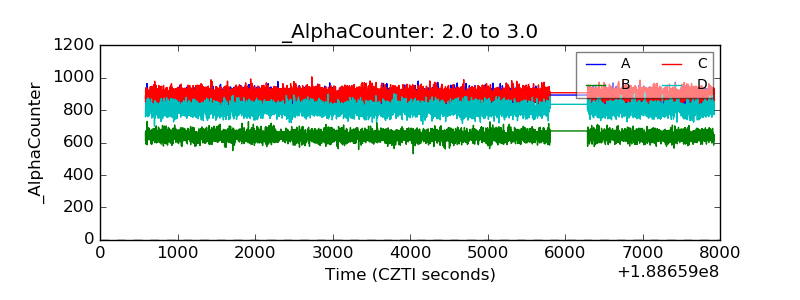 |
| _CPM_Rate | 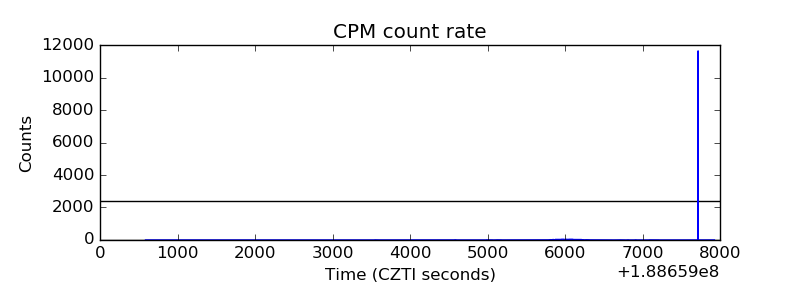 |
| CZT Counter | 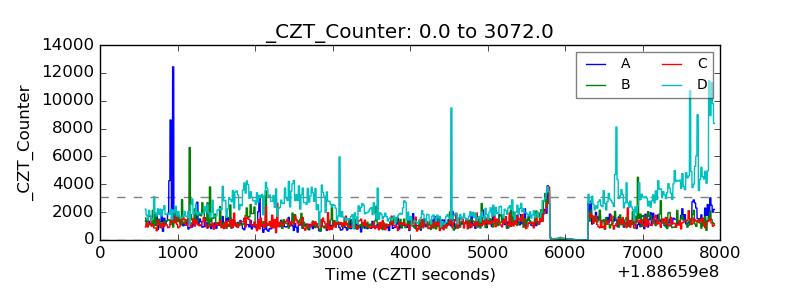 |
| +2.5 Volts monitor | 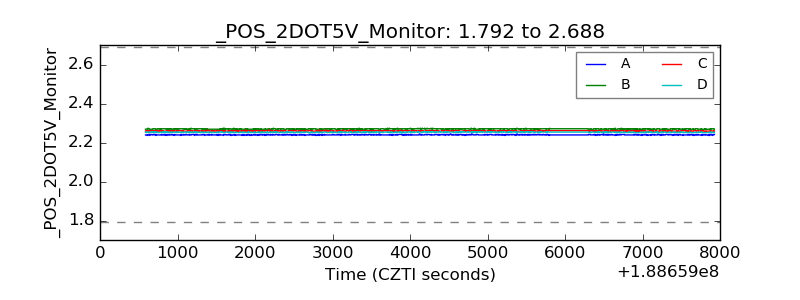 |
| +5 Volts monitor | 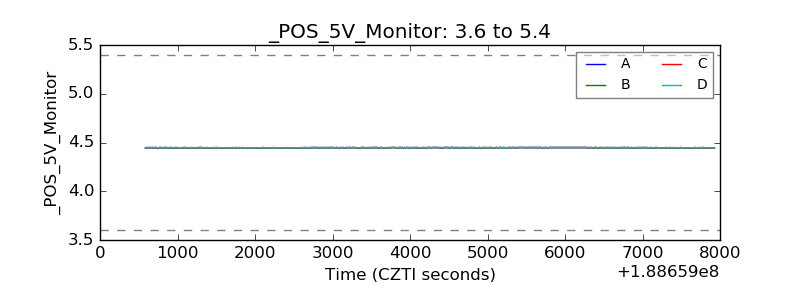 |
| _ROLL_ROT | 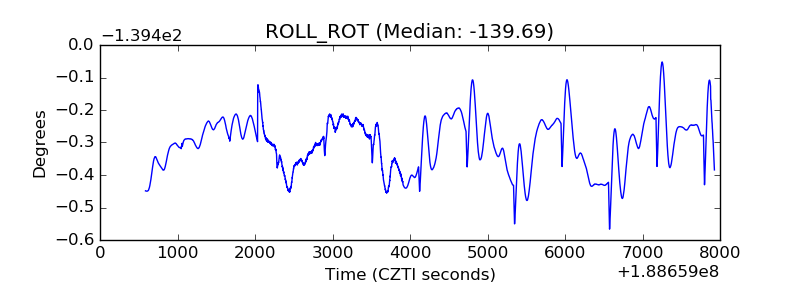 |
| _Roll_DEC | 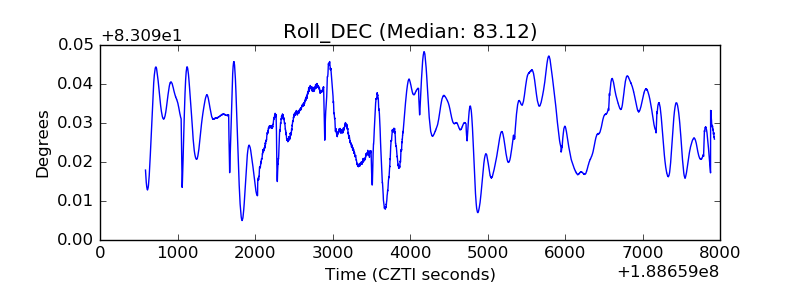 |
| _Roll_RA | 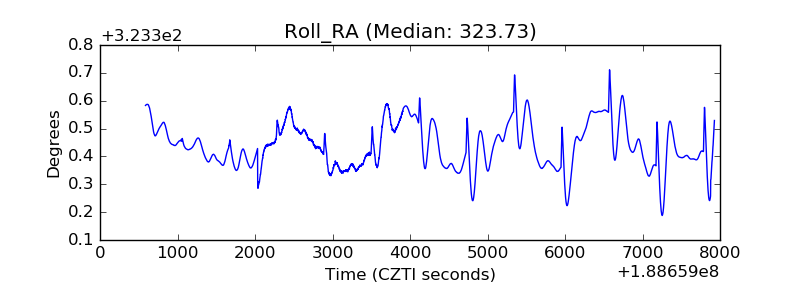 |
| Veto Counter | 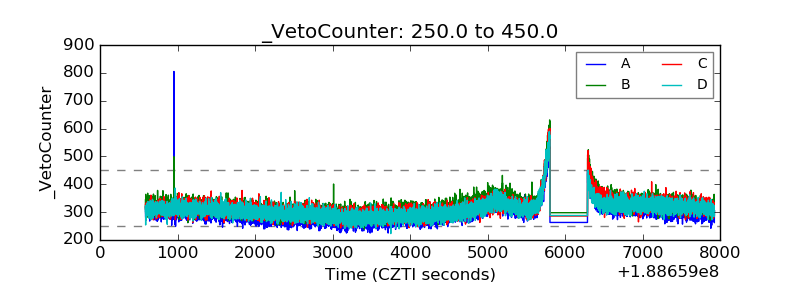 |