| Param | Original file | Final file |
|---|---|---|
| Filename | modeM0/AS1G04_002T02_9000000230_01297cztM0_level2.evt | modeM0/AS1G04_002T02_9000000230_01297cztM0_level2_quad_clean.evt |
| Size (bytes) | 1,410,701,760 | 94,144,320 |
| Size | 1.3 GB | 89.8 MB |
| Events in quadrant A | 8,739,986 | 627,337 |
| Events in quadrant B | 8,628,861 | 646,066 |
| Events in quadrant C | 7,882,830 | 632,502 |
| Events in quadrant D | 17,037,642 | 483,829 |
| Mode M9 | |||
|---|---|---|---|
| Quadrant | BADHDUFLAG | Total packets | Discarded packets |
| A | 0 | 9 | 0 |
| B | 0 | 9 | 0 |
| C | 0 | 9 | 0 |
| D | 0 | 9 | 0 |
| Mode M0 | |||
|---|---|---|---|
| Quadrant | BADHDUFLAG | Total packets | Discarded packets |
| A | 0 | 30716 | 2 |
| B | 0 | 30293 | 1 |
| C | 0 | 28105 | 1 |
| D | 0 | 55755 | 1 |
| Mode SS | |||
|---|---|---|---|
| Quadrant | BADHDUFLAG | Total packets | Discarded packets |
| A | 0 | 134 | 0 |
| B | 0 | 134 | 0 |
| C | 0 | 134 | 0 |
| D | 0 | 134 | 0 |
| Quadrant | Total seconds | Saturated seconds | Saturation percentage |
|---|---|---|---|
| A | 6592 | 345 | 5.233617% |
| B | 6592 | 28 | 0.424757% |
| C | 6592 | 13 | 0.197209% |
| D | 6592 | 3116 | 47.269417% |
Noise dominated data is calculated using 1-second bins in cleaned event files. If a bin has >2000 counts, and if more than 50% of those come from <1% of pixels, then it is considered to be noise-dominated and hence unusable.
| Quadrant | # 1 sec bins | Bins with >0 counts | Bins with >2000 counts | High rate bins dominated by noise | Noise dominated (total time) | Noise dominated (detector-on time) | Marked lightcurve |
|---|---|---|---|---|---|---|---|
| A | 7487 | 6592 | 648 | 648 | 8.66% | 9.83% | 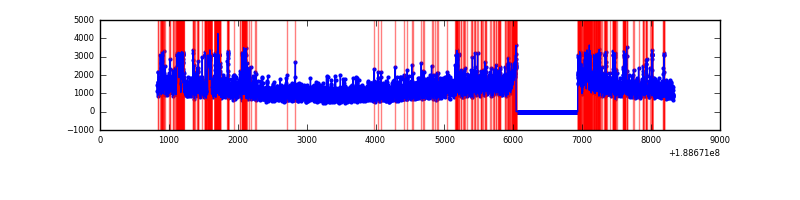 |
| B | 7487 | 6593 | 405 | 405 | 5.41% | 6.14% | 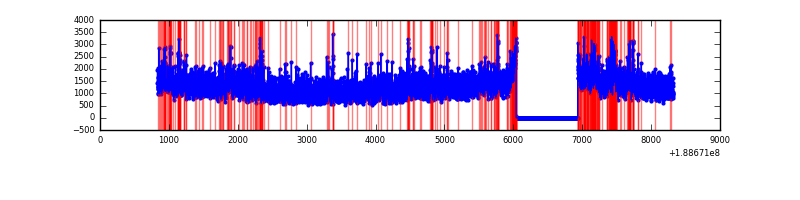 |
| C | 7487 | 6592 | 136 | 136 | 1.82% | 2.06% | 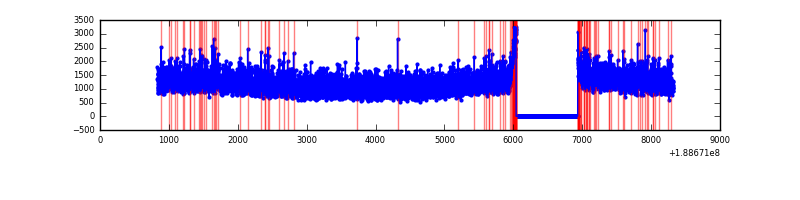 |
| D | 7487 | 6592 | 5186 | 5186 | 69.27% | 78.67% | 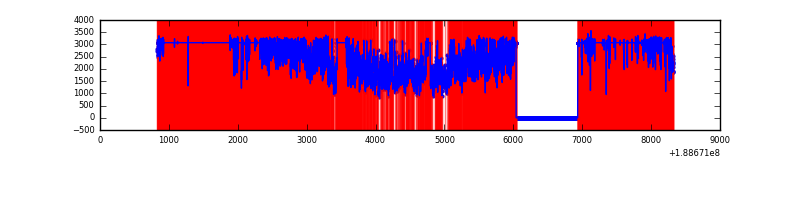 |
Top three noisy pixels from each quadrant. If the there are fewer than three noisy pixels in the level2.evt file, extra rows are filled as -1
| Pixel properties | Quadrant properties | ||||||
|---|---|---|---|---|---|---|---|
| Quadrant | DetID | PixID | Counts | Sigma | Mean | Median | Sigma |
| A | 4 | 32 | 1224058 | 2610.22 | 1943 | 1956 | 468.2 |
| A | 15 | 127 | 43638 | 89.03 | 1943 | 1956 | 468.2 |
| A | 12 | 243 | 10095 | 17.38 | 1943 | 1956 | 468.2 |
| B | 8 | 4 | 533669 | 1086.02 | 2084 | 2093 | 489.5 |
| B | 15 | 22 | 53434 | 104.89 | 2084 | 2093 | 489.5 |
| B | 6 | 53 | 47254 | 92.26 | 2084 | 2093 | 489.5 |
| C | 15 | 241 | 337638 | 627.81 | 1915 | 1986 | 534.6 |
| C | 3 | 111 | 29307 | 51.1 | 1915 | 1986 | 534.6 |
| C | 3 | 79 | 27889 | 48.45 | 1915 | 1986 | 534.6 |
| D | 13 | 169 | 10218357 | 21539.64 | 1536 | 1594 | 474.3 |
| D | 10 | 84 | 853121 | 1795.24 | 1536 | 1594 | 474.3 |
| D | 13 | 73 | 53609 | 109.66 | 1536 | 1594 | 474.3 |
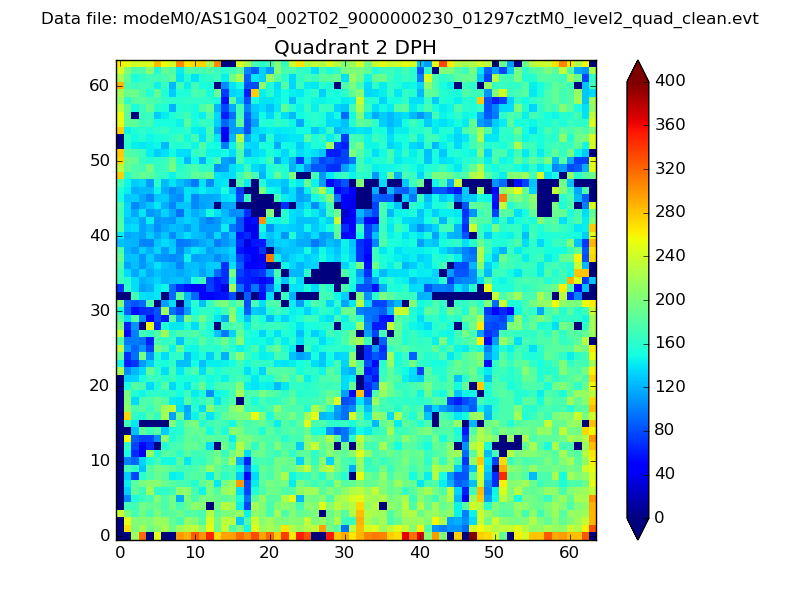
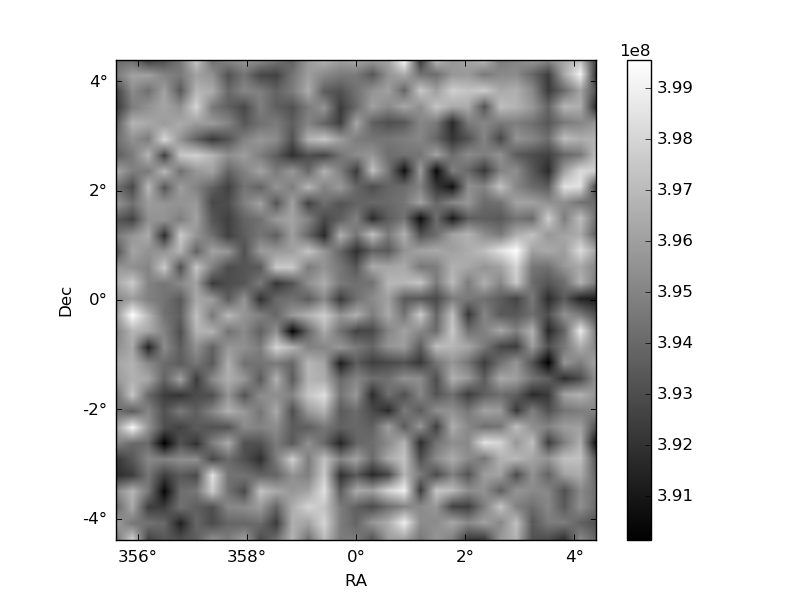
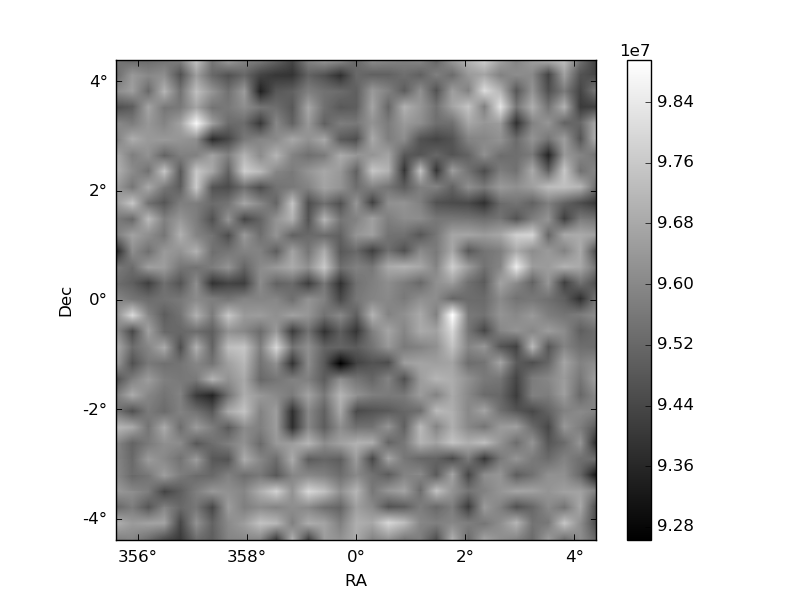
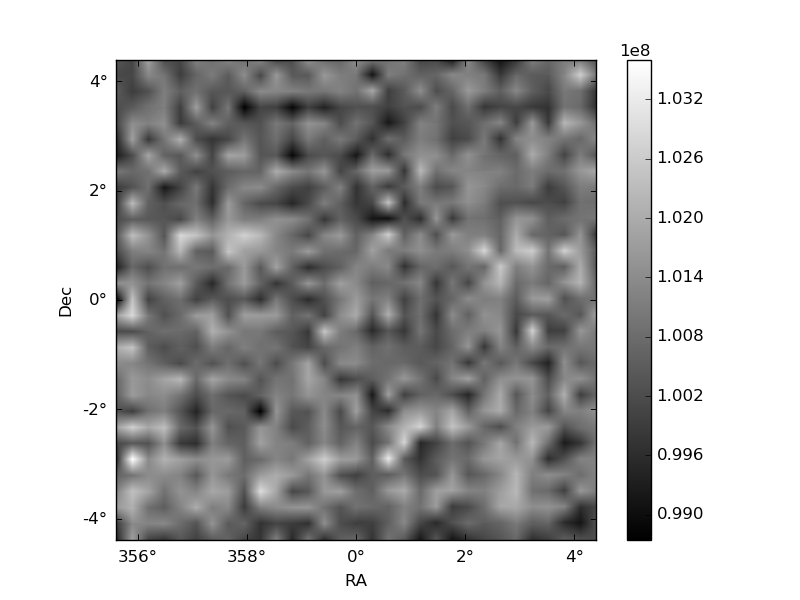
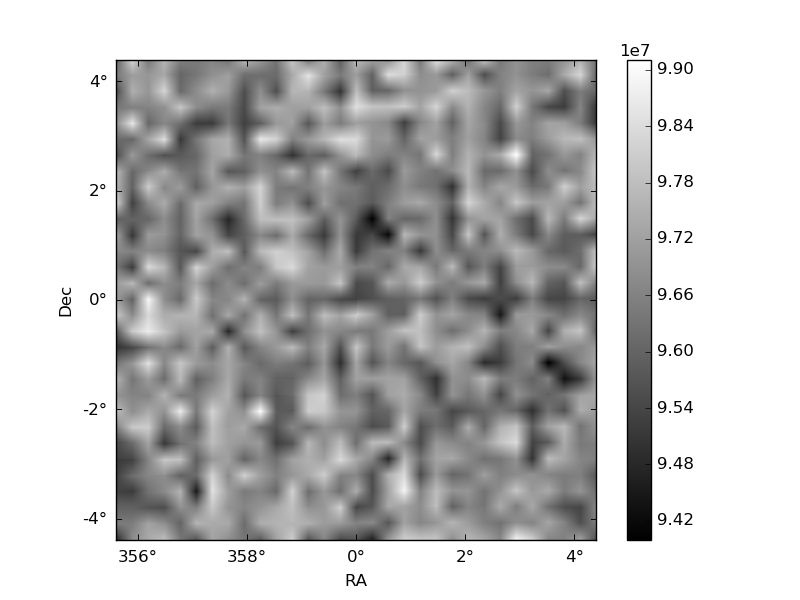
Histogram calculated using DETX and DETY for each event in the final _common_clean file
| Quadrant A | 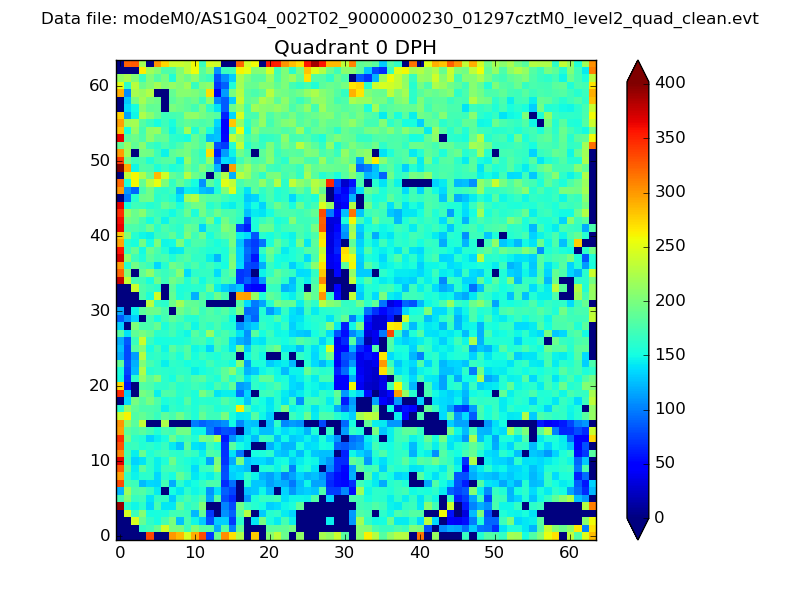 |
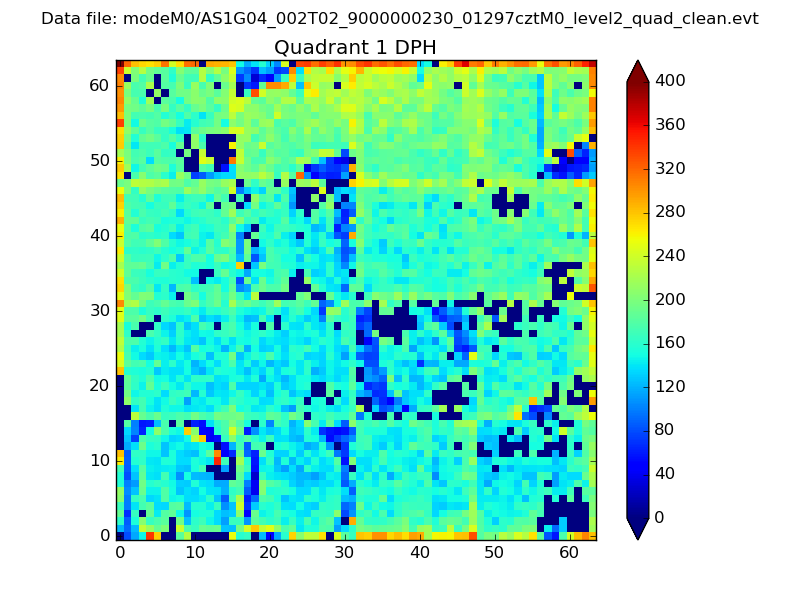 |
Quadrant B |
|---|---|---|---|
| Quadrant D | 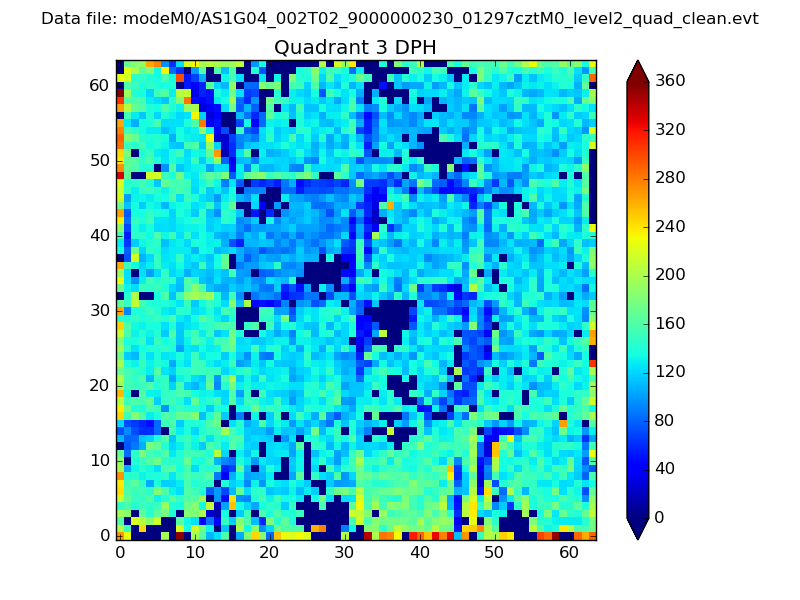 |
 |
Quadrant C |
| Plot type | Count rate plots | Images |
|---|---|---|
| Comparison with Poisson distribution Blue bars denote a histogram of data divided into 1 sec bins. Red curve is a Poisson curve with rate = median count rate of data. |
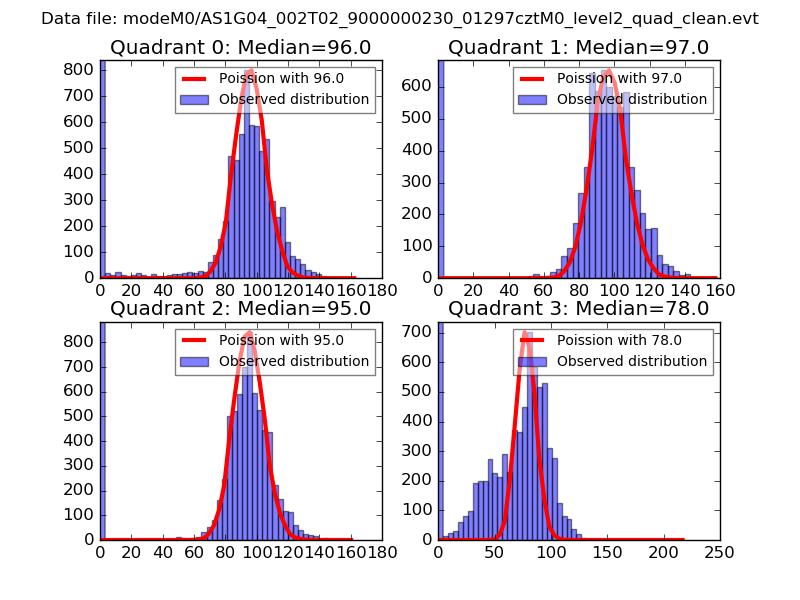 |
 |
| Quadrant-wise count rates Data is divided into 100 sec bins |
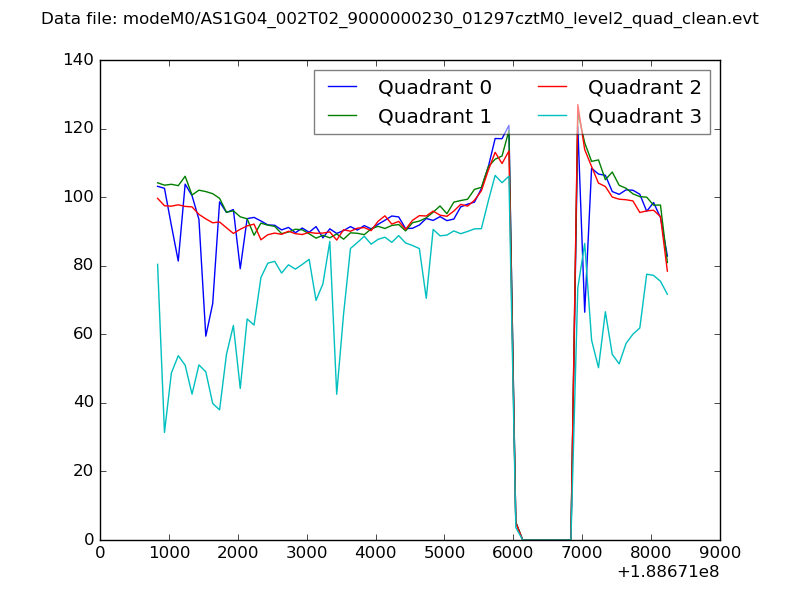 |
|
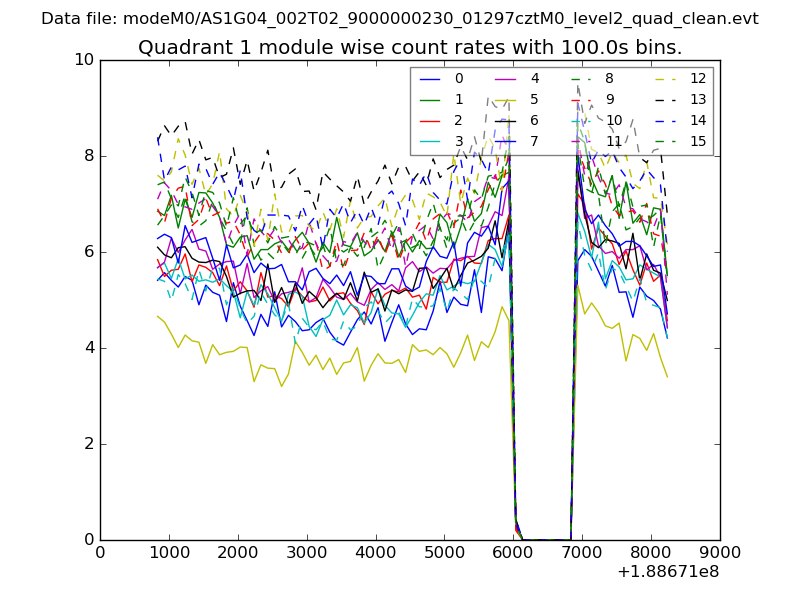
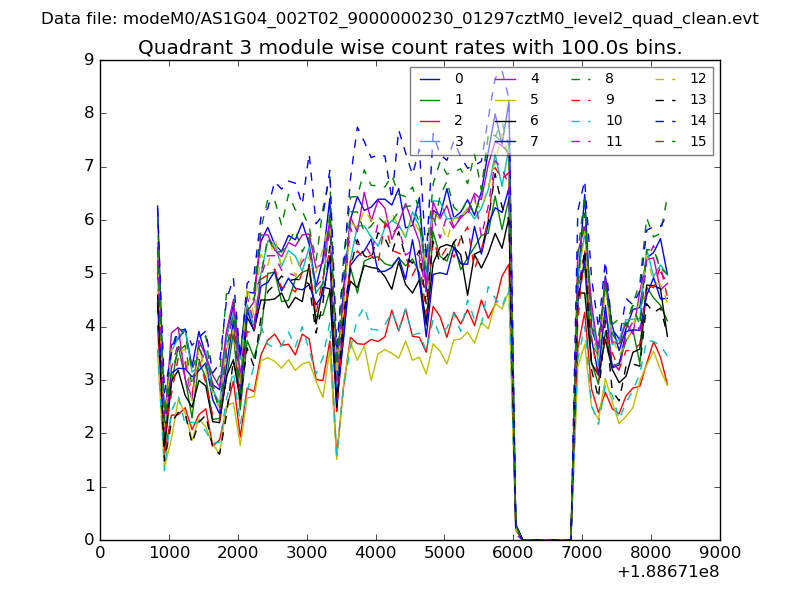
| Module-wise count rates for Quadrant A Data is divided into 100 sec bins |
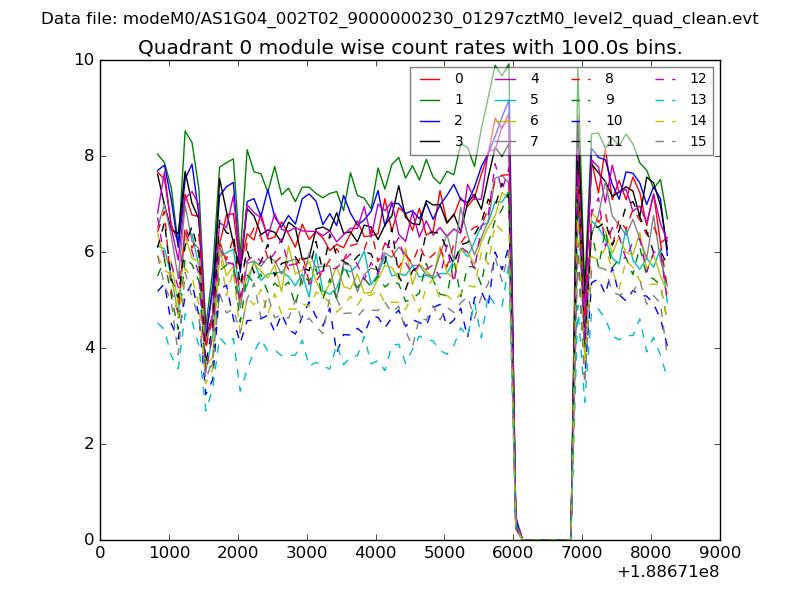 |
 |
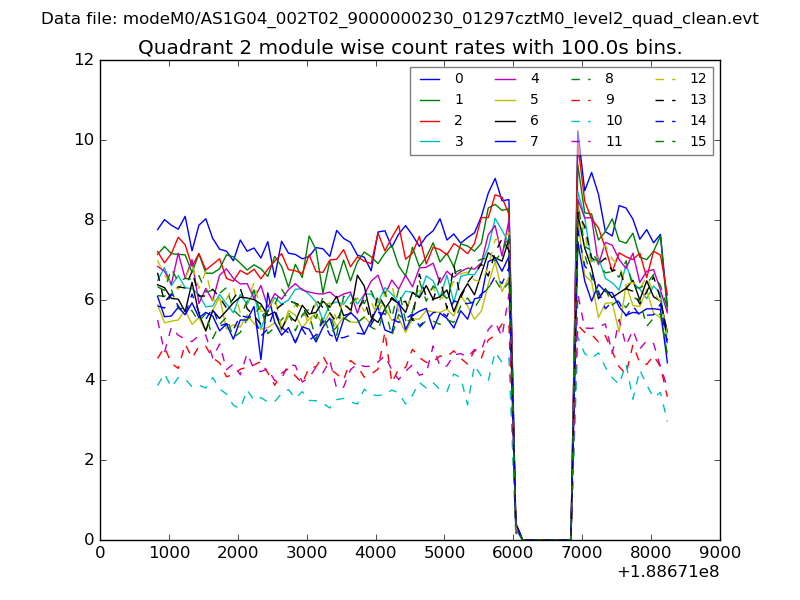
| Module-wise count rates for Quadrant B Data is divided into 100 sec bins |
 |
 |
| Module-wise count rates for Quadrant C Data is divided into 100 sec bins |
 |
 |
| Module-wise count rates for Quadrant D Data is divided into 100 sec bins |
 |
 |
| Parameter | Plot |
|---|---|
| CZT HV Monitor | 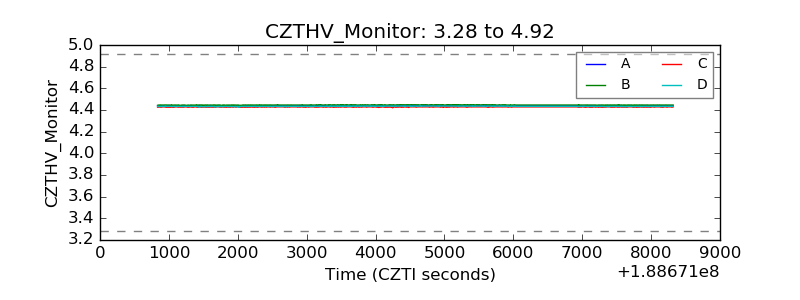 |
| D_VDD |  |
| Temperature 1 | 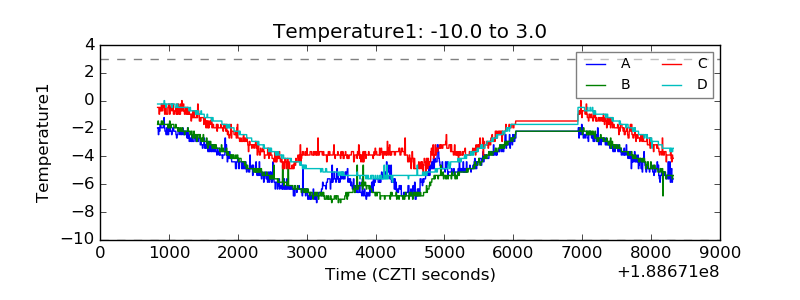 |
| Veto HV Monitor | 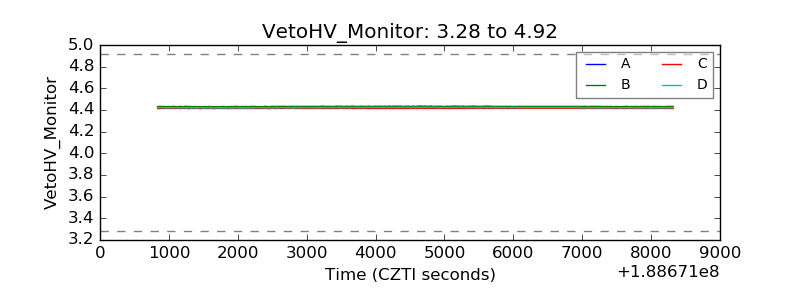 |
| Veto LLD | 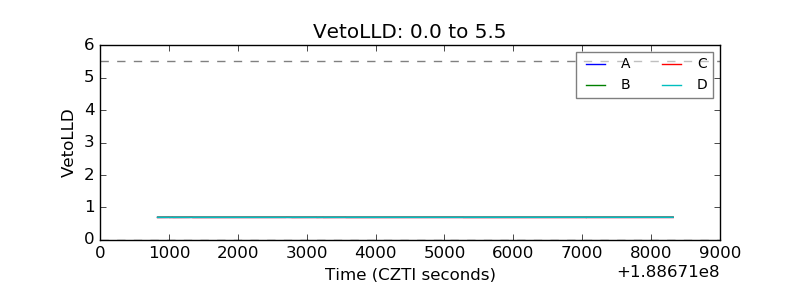 |
| Alpha Counter | 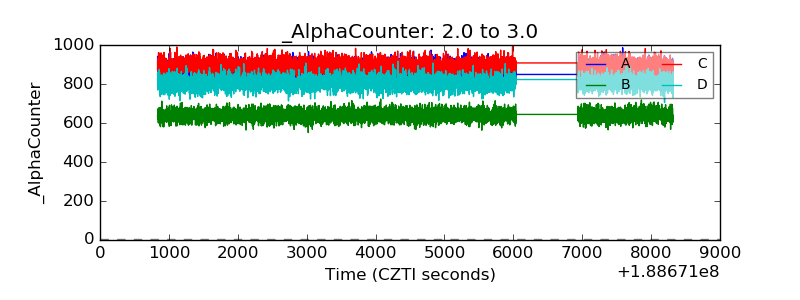 |
| _CPM_Rate | 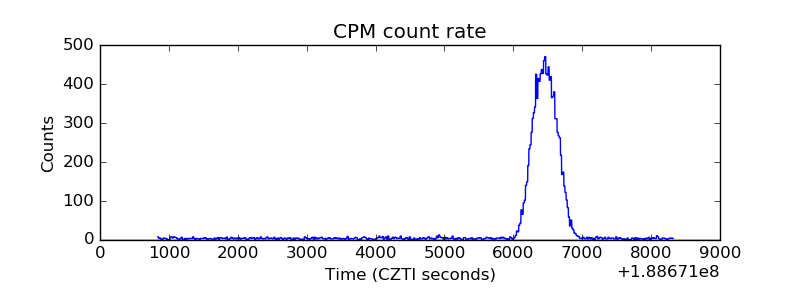 |
| CZT Counter | 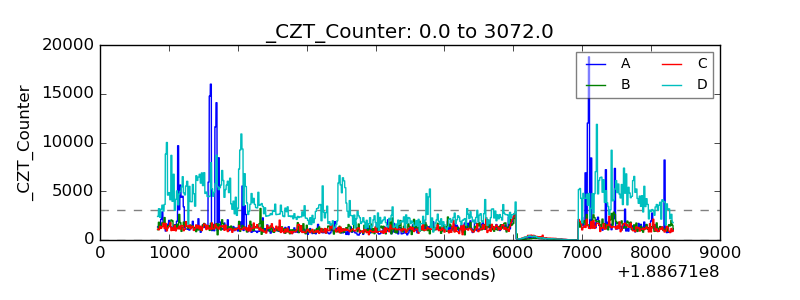 |
| +2.5 Volts monitor |  |
| +5 Volts monitor |  |
| _ROLL_ROT | 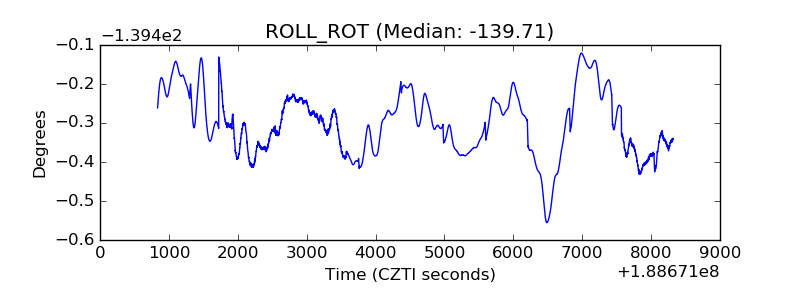 |
| _Roll_DEC | 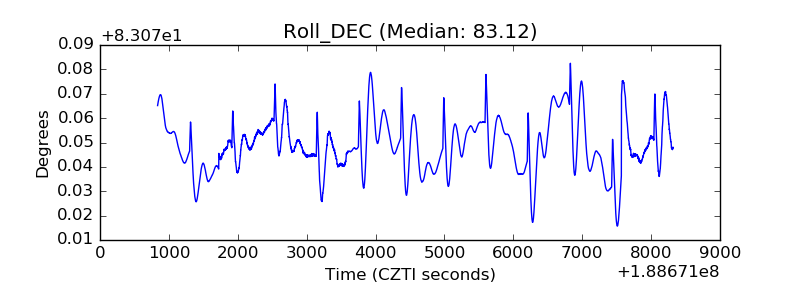 |
| _Roll_RA | 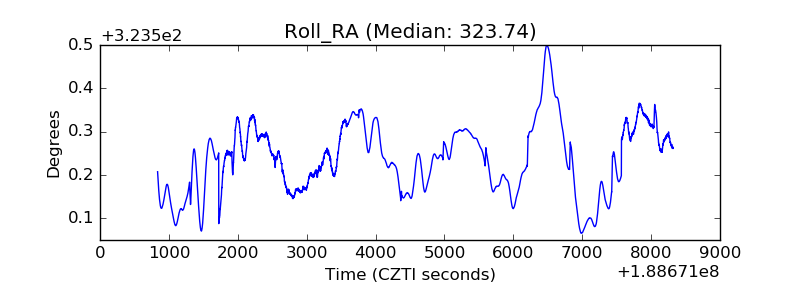 |
| Veto Counter | 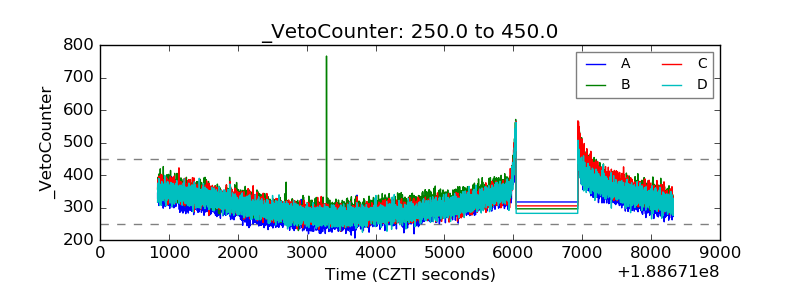 |