| Param | Original file | Final file |
|---|---|---|
| Filename | modeM0/AS1G04_002T02_9000000230_01300cztM0_level2.evt | modeM0/AS1G04_002T02_9000000230_01300cztM0_level2_quad_clean.evt |
| Size (bytes) | 1,229,679,360 | 89,104,320 |
| Size | 1.1 GB | 85.0 MB |
| Events in quadrant A | 7,443,936 | 587,577 |
| Events in quadrant B | 7,668,895 | 608,073 |
| Events in quadrant C | 6,971,799 | 600,641 |
| Events in quadrant D | 14,760,774 | 482,059 |
| Mode M9 | |||
|---|---|---|---|
| Quadrant | BADHDUFLAG | Total packets | Discarded packets |
| A | 0 | 12 | 0 |
| B | 0 | 12 | 0 |
| C | 0 | 12 | 0 |
| D | 0 | 12 | 0 |
| Mode M0 | |||
|---|---|---|---|
| Quadrant | BADHDUFLAG | Total packets | Discarded packets |
| A | 0 | 26427 | 2 |
| B | 0 | 27051 | 1 |
| C | 0 | 24974 | 1 |
| D | 0 | 48398 | 1 |
| Mode SS | |||
|---|---|---|---|
| Quadrant | BADHDUFLAG | Total packets | Discarded packets |
| A | 0 | 122 | 0 |
| B | 0 | 122 | 0 |
| C | 0 | 122 | 0 |
| D | 0 | 122 | 0 |
| Quadrant | Total seconds | Saturated seconds | Saturation percentage |
|---|---|---|---|
| A | 5996 | 219 | 3.652435% |
| B | 5996 | 19 | 0.316878% |
| C | 5996 | 5 | 0.083389% |
| D | 5996 | 2441 | 40.710474% |
Noise dominated data is calculated using 1-second bins in cleaned event files. If a bin has >2000 counts, and if more than 50% of those come from <1% of pixels, then it is considered to be noise-dominated and hence unusable.
| Quadrant | # 1 sec bins | Bins with >0 counts | Bins with >2000 counts | High rate bins dominated by noise | Noise dominated (total time) | Noise dominated (detector-on time) | Marked lightcurve |
|---|---|---|---|---|---|---|---|
| A | 7165 | 5996 | 395 | 395 | 5.51% | 6.59% | 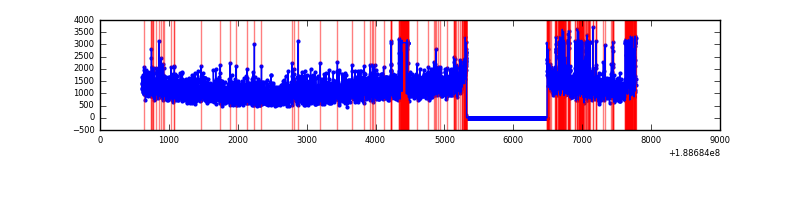 |
| B | 7166 | 5997 | 343 | 343 | 4.79% | 5.72% | 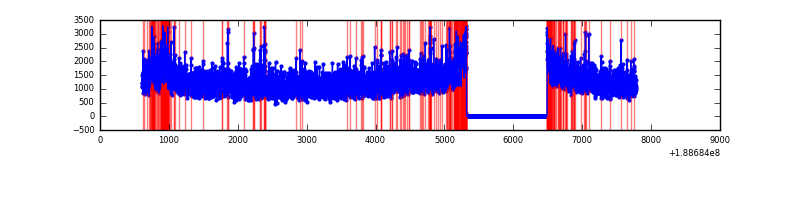 |
| C | 7166 | 5997 | 107 | 107 | 1.49% | 1.78% | 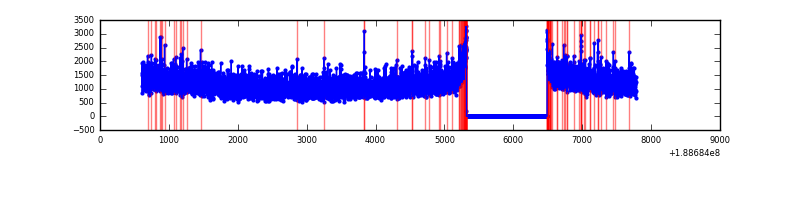 |
| D | 7166 | 5996 | 4231 | 4231 | 59.04% | 70.56% | 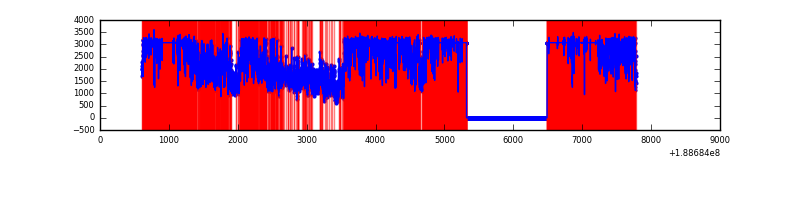 |
Top three noisy pixels from each quadrant. If the there are fewer than three noisy pixels in the level2.evt file, extra rows are filled as -1
| Pixel properties | Quadrant properties | ||||||
|---|---|---|---|---|---|---|---|
| Quadrant | DetID | PixID | Counts | Sigma | Mean | Median | Sigma |
| A | 4 | 32 | 759761 | 1848.85 | 1714 | 1725 | 410.0 |
| A | 15 | 127 | 69325 | 164.88 | 1714 | 1725 | 410.0 |
| A | 0 | 5 | 13525 | 28.78 | 1714 | 1725 | 410.0 |
| B | 8 | 4 | 203187 | 466.38 | 1853 | 1865 | 431.7 |
| B | 12 | 52 | 164870 | 377.62 | 1853 | 1865 | 431.7 |
| B | 6 | 53 | 141287 | 322.98 | 1853 | 1865 | 431.7 |
| C | 15 | 241 | 299474 | 637.62 | 1695 | 1756 | 466.9 |
| C | 3 | 111 | 18913 | 36.75 | 1695 | 1756 | 466.9 |
| C | 3 | 79 | 11284 | 20.41 | 1695 | 1756 | 466.9 |
| D | 13 | 169 | 9326736 | 21257.55 | 1420 | 1470 | 438.7 |
| D | 2 | 88 | 58094 | 129.08 | 1420 | 1470 | 438.7 |
| D | 10 | 84 | 40298 | 88.51 | 1420 | 1470 | 438.7 |
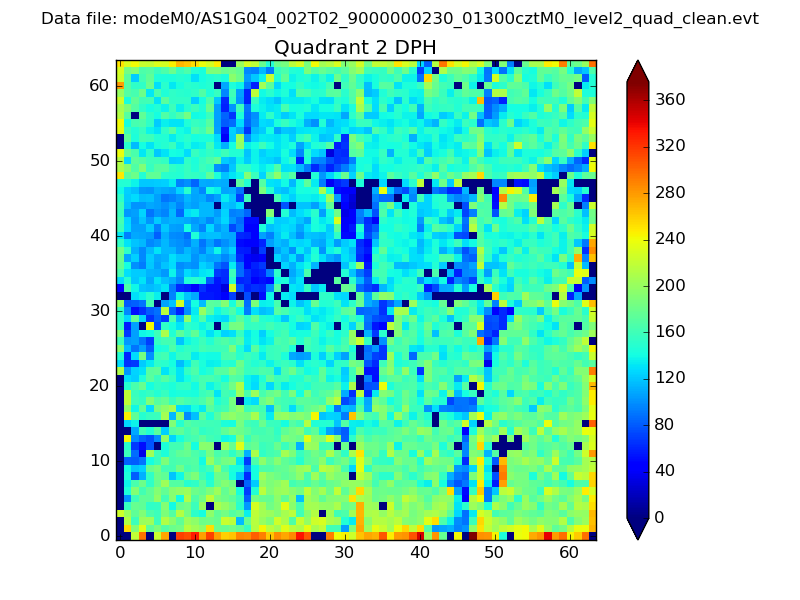
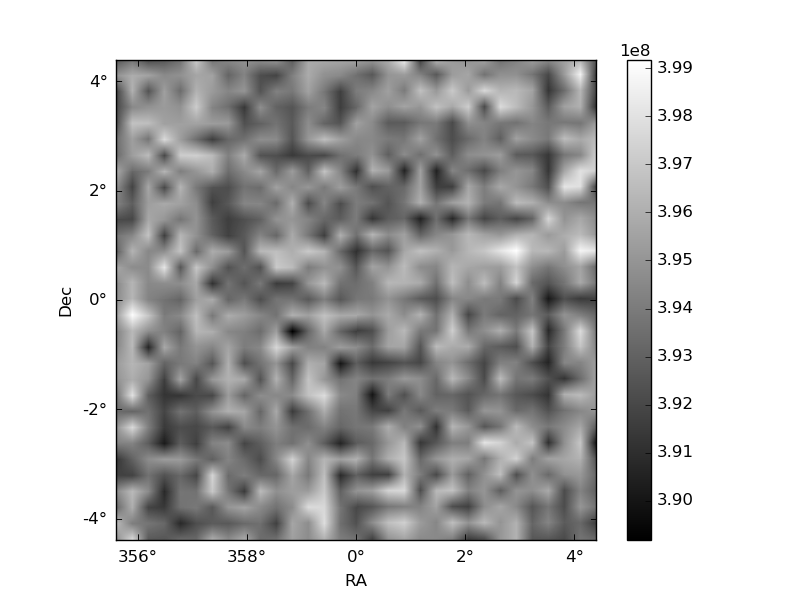
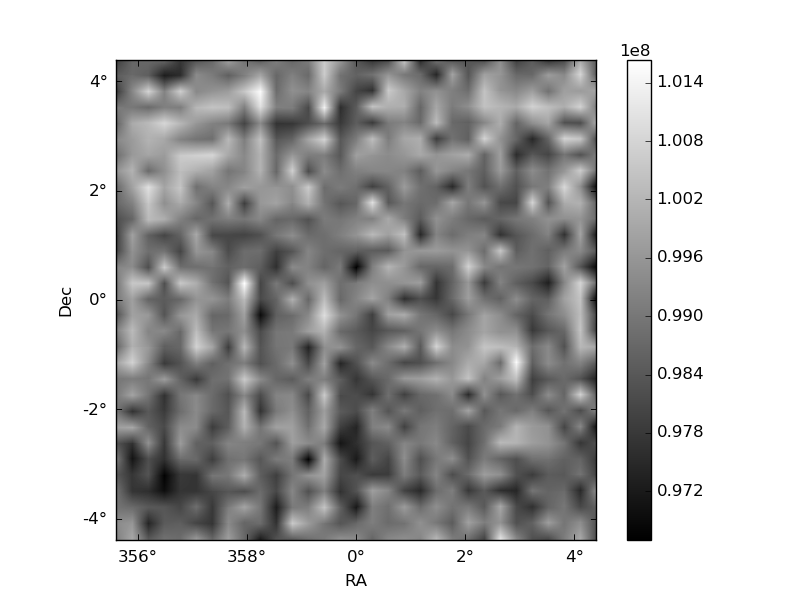
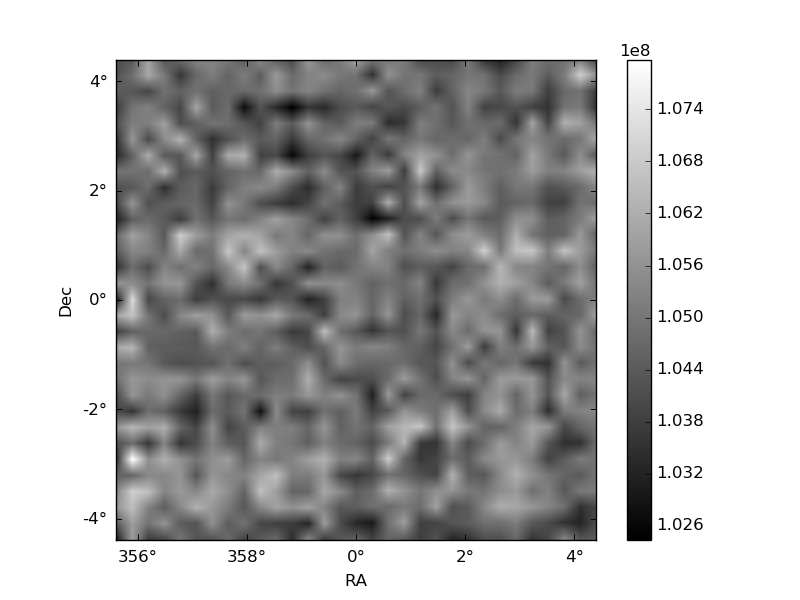
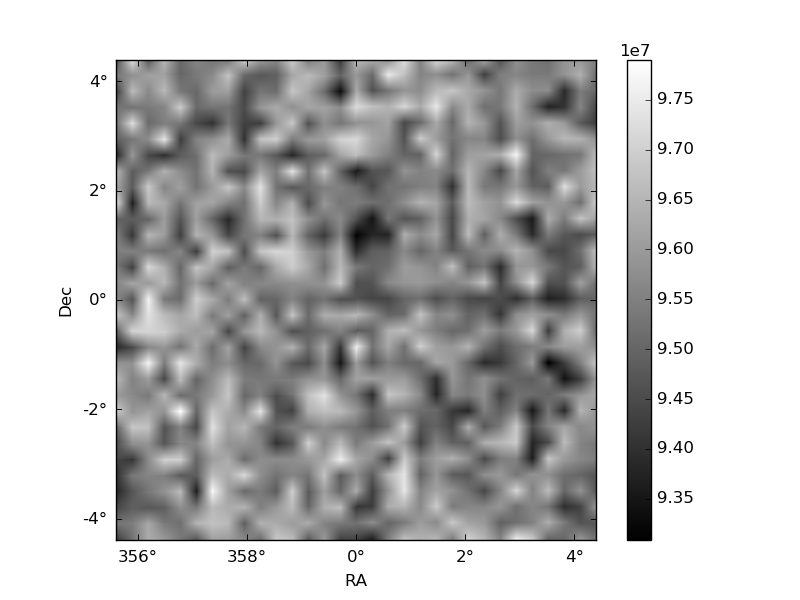
Histogram calculated using DETX and DETY for each event in the final _common_clean file
| Quadrant A | 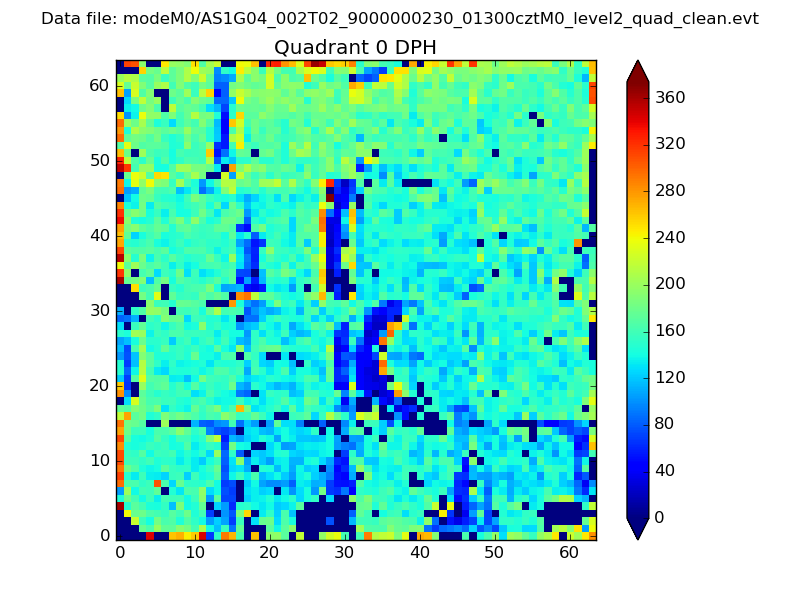 |
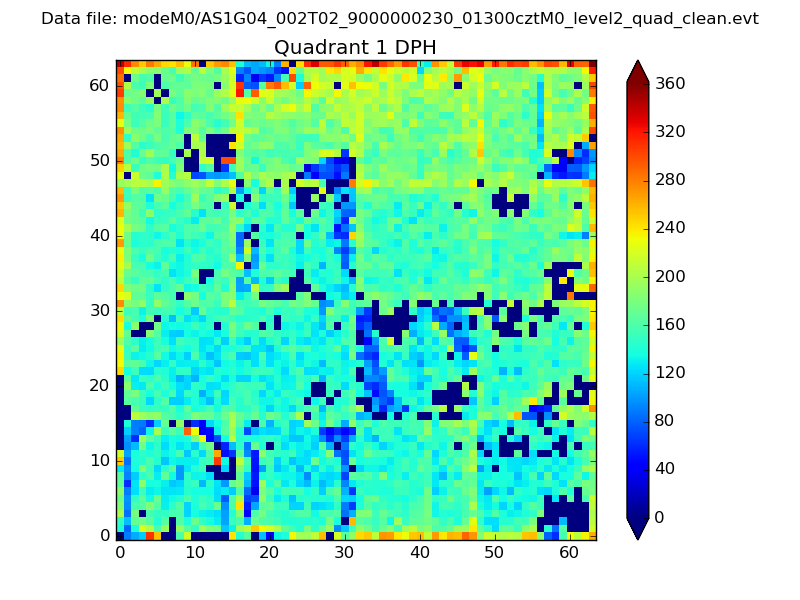 |
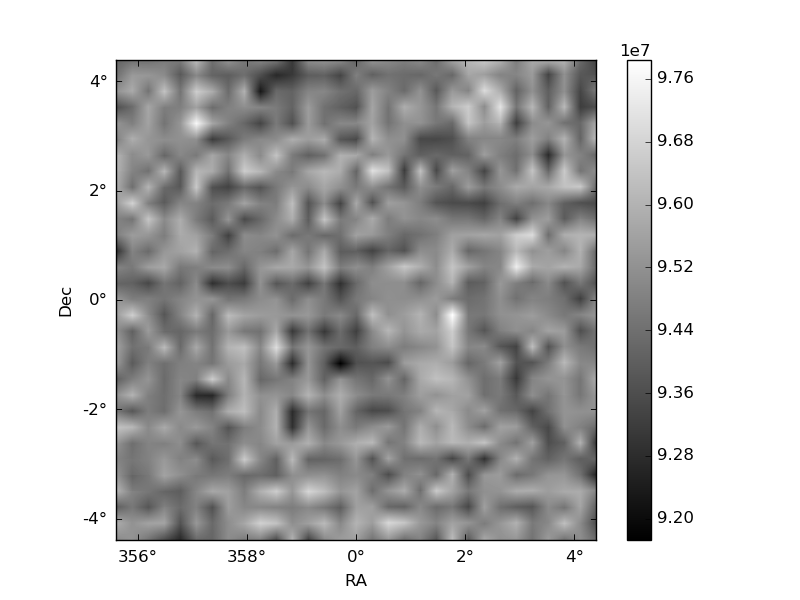
Quadrant B |
|---|---|---|---|
| Quadrant D | 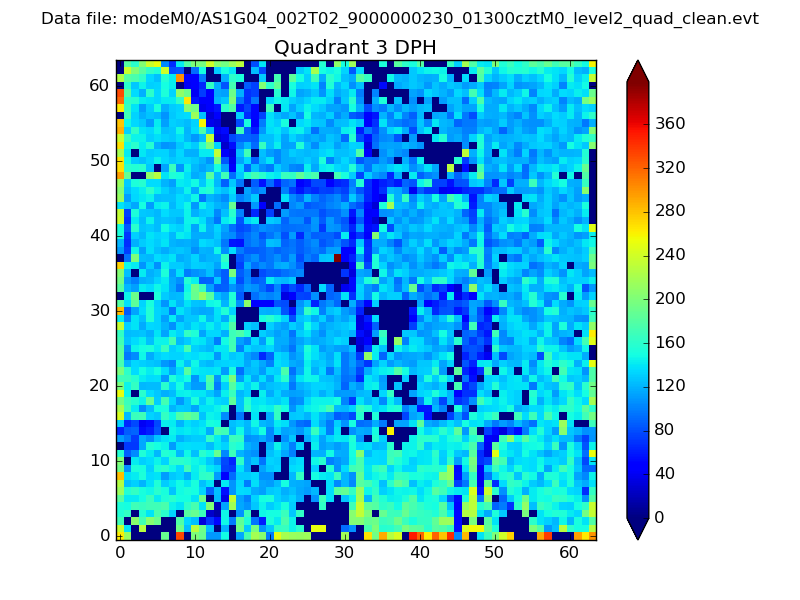 |
 |
Quadrant C |
| Plot type | Count rate plots | Images |
|---|---|---|
| Comparison with Poisson distribution Blue bars denote a histogram of data divided into 1 sec bins. Red curve is a Poisson curve with rate = median count rate of data. |
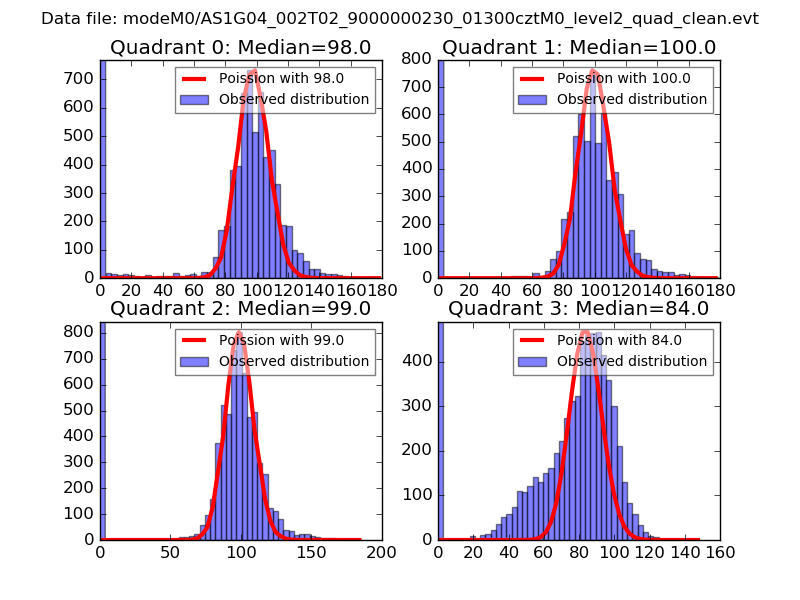 |
 |
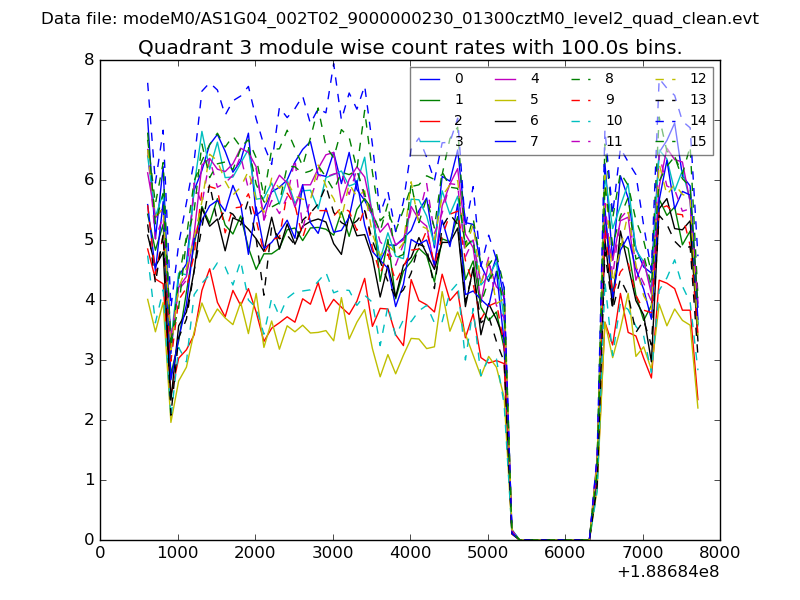
| Quadrant-wise count rates Data is divided into 100 sec bins |
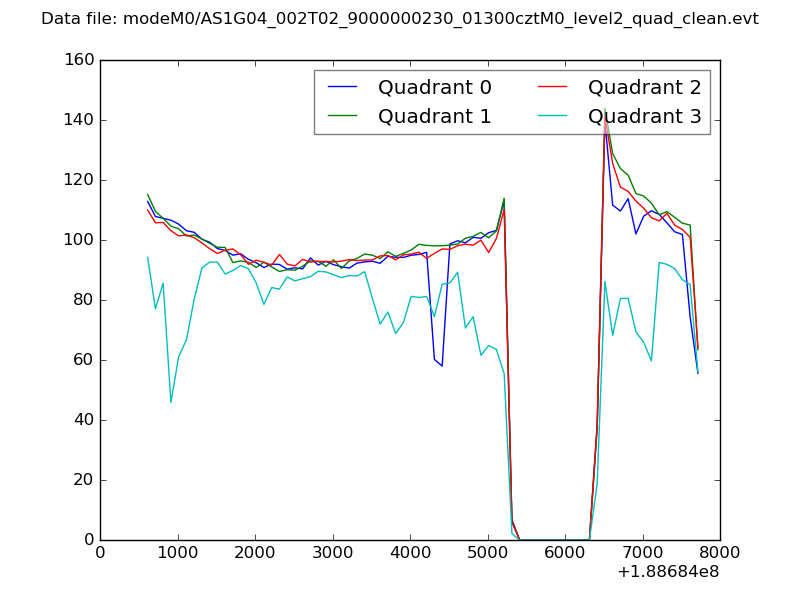 |
|
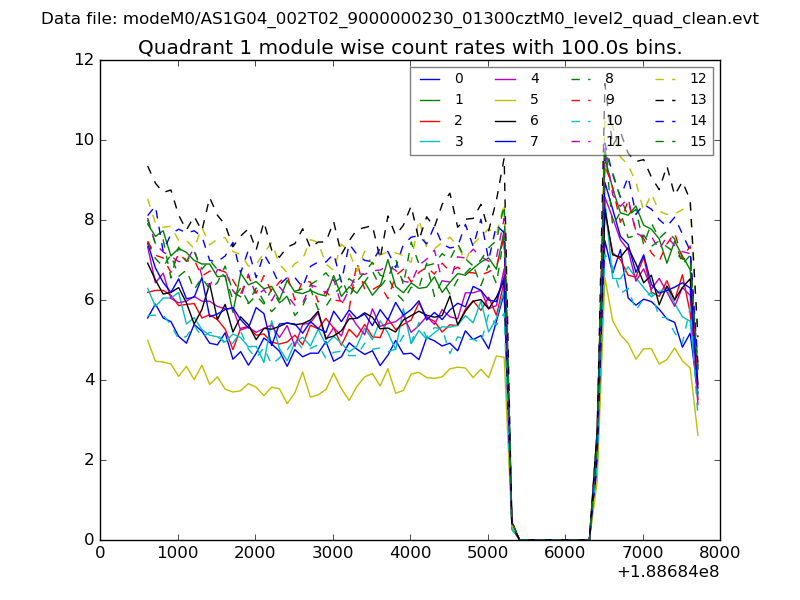
| Module-wise count rates for Quadrant A Data is divided into 100 sec bins |
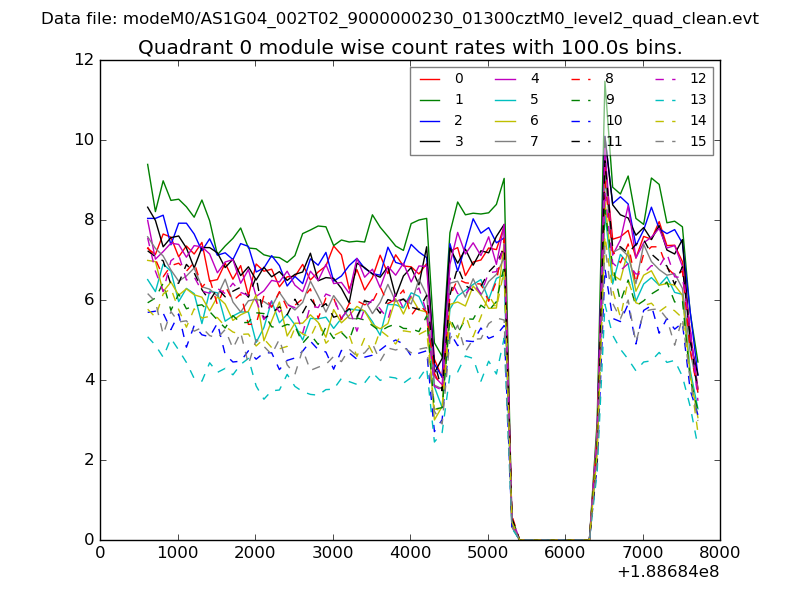 |
 |
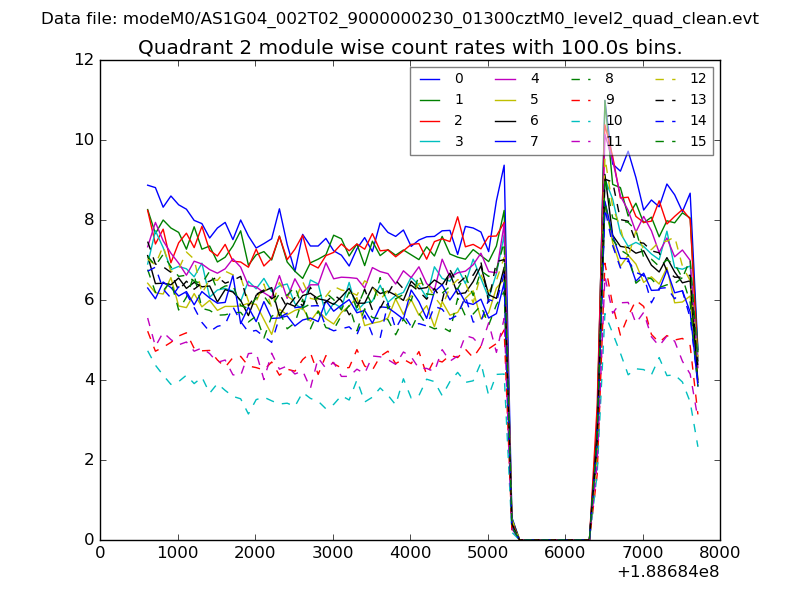
| Module-wise count rates for Quadrant B Data is divided into 100 sec bins |
 |
 |
| Module-wise count rates for Quadrant C Data is divided into 100 sec bins |
 |
 |
| Module-wise count rates for Quadrant D Data is divided into 100 sec bins |
 |
 |
| Parameter | Plot |
|---|---|
| CZT HV Monitor | 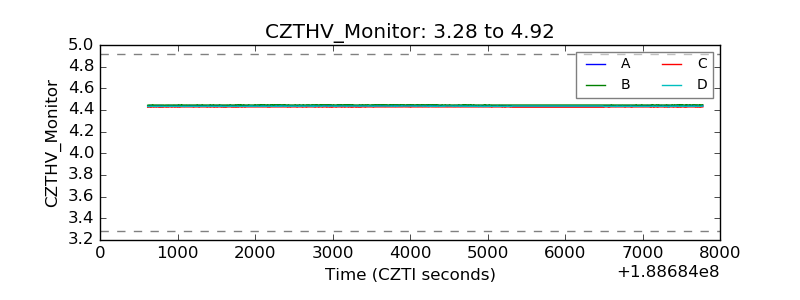 |
| D_VDD | 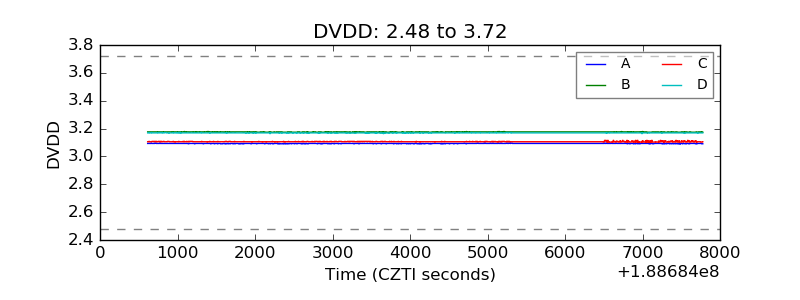 |
| Temperature 1 | 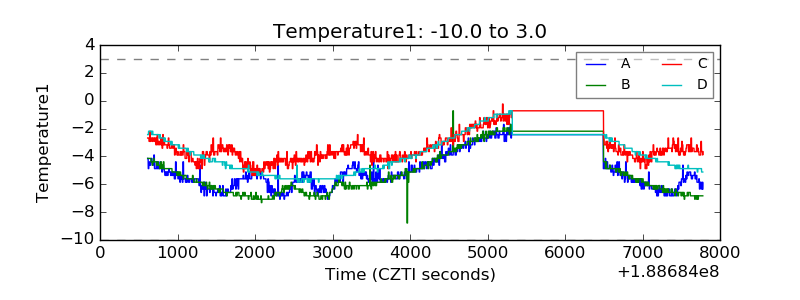 |
| Veto HV Monitor | 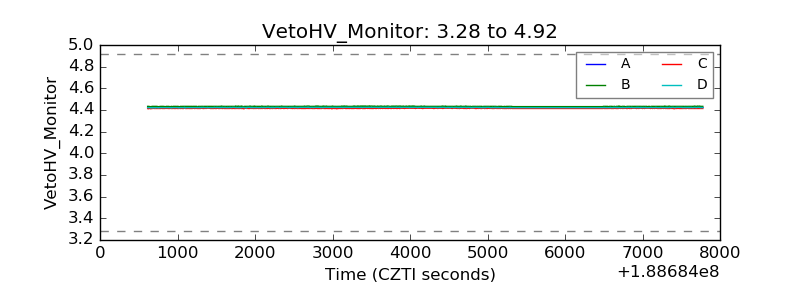 |
| Veto LLD | 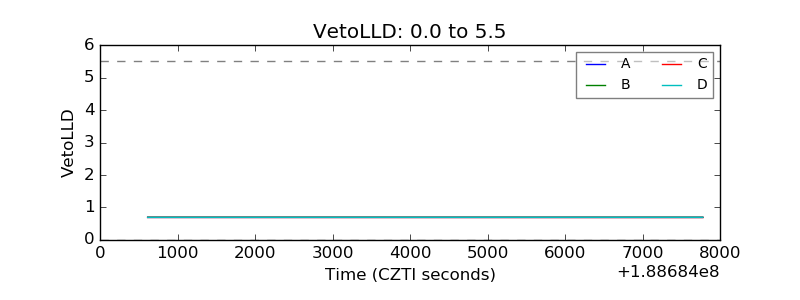 |
| Alpha Counter | 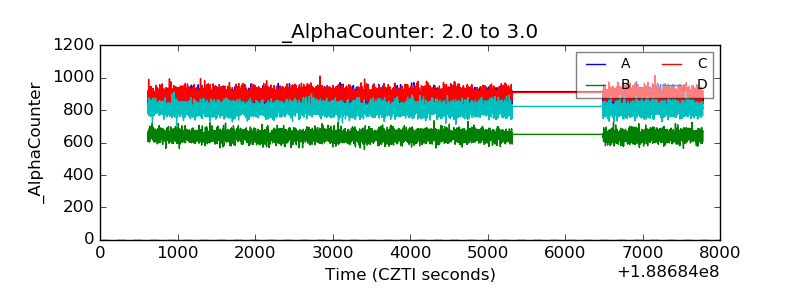 |
| _CPM_Rate | 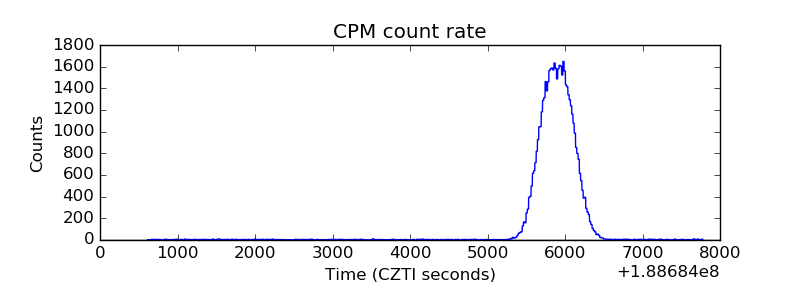 |
| CZT Counter | 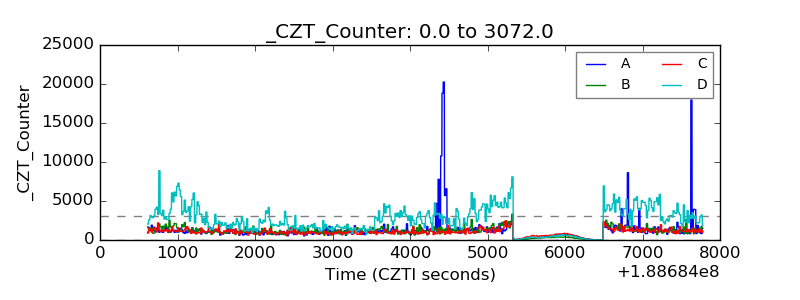 |
| +2.5 Volts monitor | 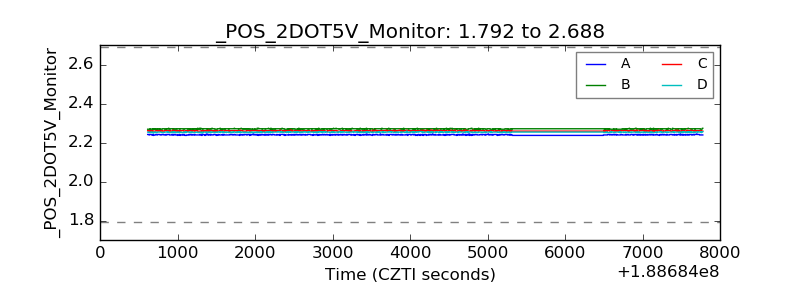 |
| +5 Volts monitor | 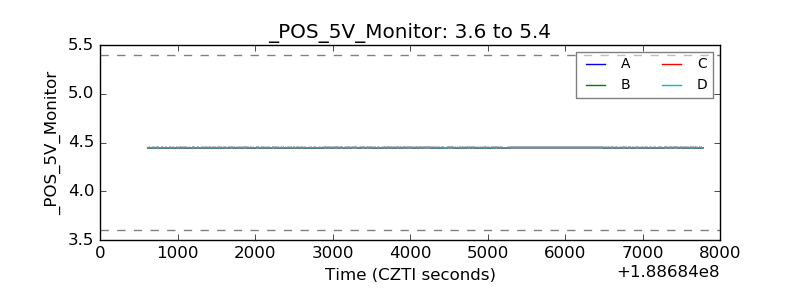 |
| _ROLL_ROT | 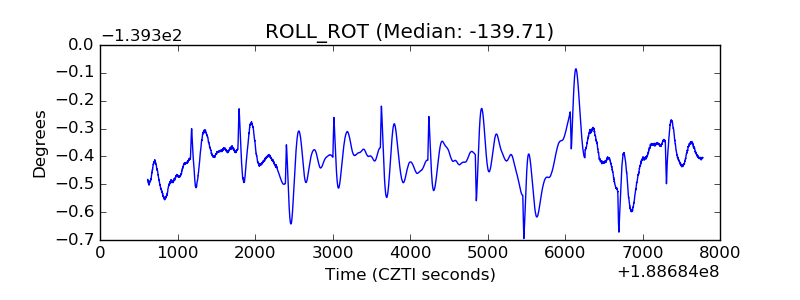 |
| _Roll_DEC | 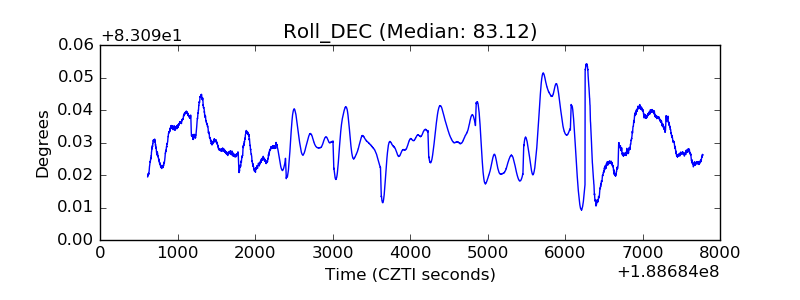 |
| _Roll_RA | 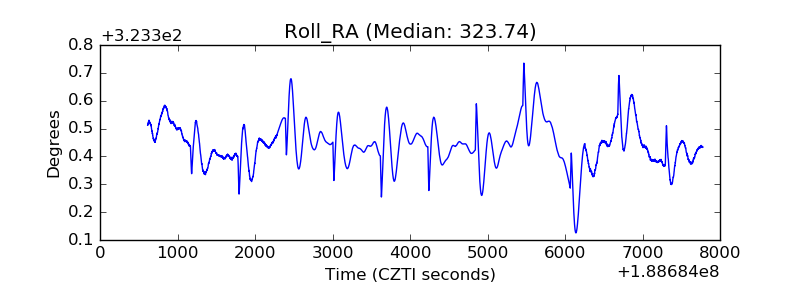 |
| Veto Counter | 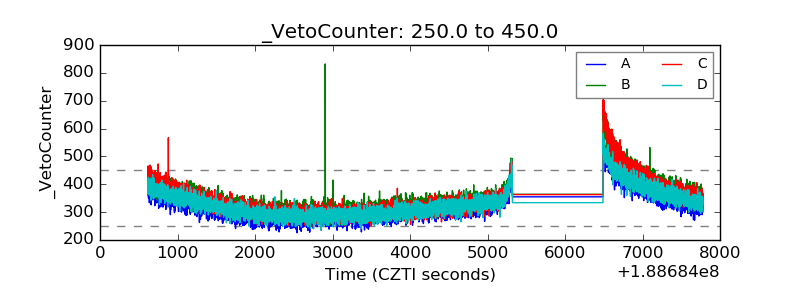 |