| Param | Original file | Final file |
|---|---|---|
| Filename | modeM0/AS1G04_002T02_9000000230_01301cztM0_level2.evt | modeM0/AS1G04_002T02_9000000230_01301cztM0_level2_quad_clean.evt |
| Size (bytes) | 1,323,051,840 | 95,149,440 |
| Size | 1.2 GB | 90.7 MB |
| Events in quadrant A | 8,807,140 | 597,084 |
| Events in quadrant B | 8,374,927 | 660,477 |
| Events in quadrant C | 7,380,928 | 649,356 |
| Events in quadrant D | 15,094,814 | 537,554 |
| Mode M9 | |||
|---|---|---|---|
| Quadrant | BADHDUFLAG | Total packets | Discarded packets |
| A | 0 | 16 | 0 |
| B | 0 | 16 | 0 |
| C | 0 | 16 | 0 |
| D | 0 | 17 | 0 |
| Mode M0 | |||
|---|---|---|---|
| Quadrant | BADHDUFLAG | Total packets | Discarded packets |
| A | 0 | 30700 | 23 |
| B | 0 | 29324 | 2 |
| C | 0 | 26321 | 2 |
| D | 0 | 49504 | 2 |
| Mode SS | |||
|---|---|---|---|
| Quadrant | BADHDUFLAG | Total packets | Discarded packets |
| A | 0 | 128 | 0 |
| B | 0 | 128 | 0 |
| C | 0 | 128 | 0 |
| D | 0 | 128 | 0 |
| Quadrant | Total seconds | Saturated seconds | Saturation percentage |
|---|---|---|---|
| A | 6239 | 643 | 10.306139% |
| B | 6241 | 75 | 1.201730% |
| C | 6241 | 5 | 0.080115% |
| D | 6241 | 2030 | 32.526839% |
Noise dominated data is calculated using 1-second bins in cleaned event files. If a bin has >2000 counts, and if more than 50% of those come from <1% of pixels, then it is considered to be noise-dominated and hence unusable.
| Quadrant | # 1 sec bins | Bins with >0 counts | Bins with >2000 counts | High rate bins dominated by noise | Noise dominated (total time) | Noise dominated (detector-on time) | Marked lightcurve |
|---|---|---|---|---|---|---|---|
| A | 7493 | 6241 | 917 | 917 | 12.24% | 14.69% | 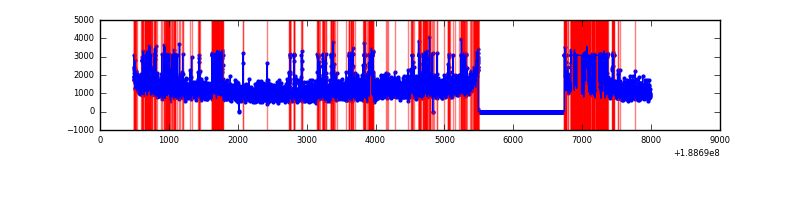 |
| B | 7493 | 6243 | 518 | 518 | 6.91% | 8.30% | 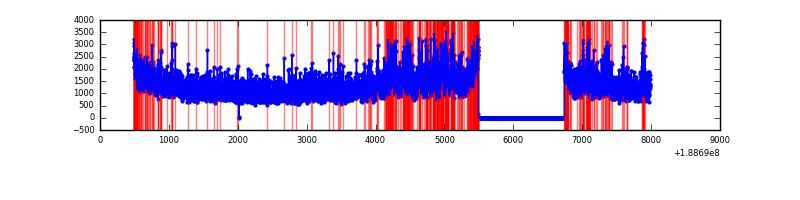 |
| C | 7493 | 6243 | 141 | 141 | 1.88% | 2.26% | 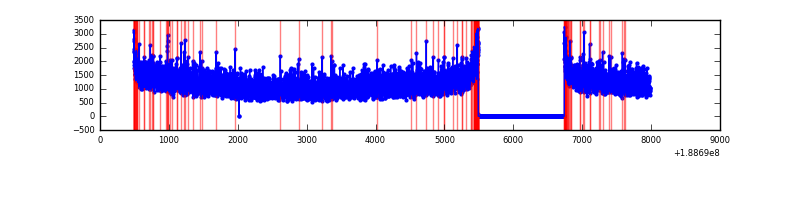 |
| D | 7493 | 6242 | 4408 | 4408 | 58.83% | 70.62% | 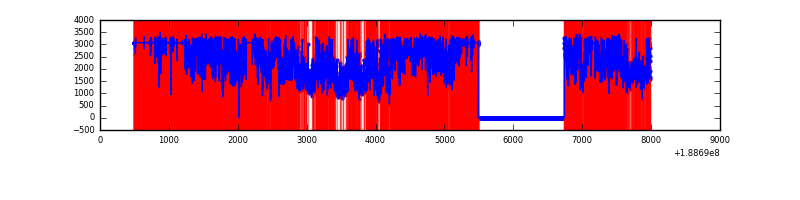 |
Top three noisy pixels from each quadrant. If the there are fewer than three noisy pixels in the level2.evt file, extra rows are filled as -1
| Pixel properties | Quadrant properties | ||||||
|---|---|---|---|---|---|---|---|
| Quadrant | DetID | PixID | Counts | Sigma | Mean | Median | Sigma |
| A | 4 | 32 | 2080075 | 4977.24 | 1739 | 1751 | 417.6 |
| A | 15 | 127 | 31603 | 71.49 | 1739 | 1751 | 417.6 |
| A | 0 | 5 | 13471 | 28.07 | 1739 | 1751 | 417.6 |
| B | 8 | 4 | 589674 | 1300.44 | 1955 | 1965 | 451.9 |
| B | 12 | 52 | 133265 | 290.53 | 1955 | 1965 | 451.9 |
| B | 6 | 53 | 129437 | 282.06 | 1955 | 1965 | 451.9 |
| C | 15 | 241 | 320022 | 642.37 | 1794 | 1853 | 495.3 |
| C | 3 | 111 | 22923 | 42.54 | 1794 | 1853 | 495.3 |
| C | 3 | 79 | 16331 | 29.23 | 1794 | 1853 | 495.3 |
| D | 13 | 169 | 8675125 | 18223.42 | 1540 | 1596 | 476.0 |
| D | 10 | 84 | 455356 | 953.37 | 1540 | 1596 | 476.0 |
| D | 12 | 22 | 105939 | 219.23 | 1540 | 1596 | 476.0 |
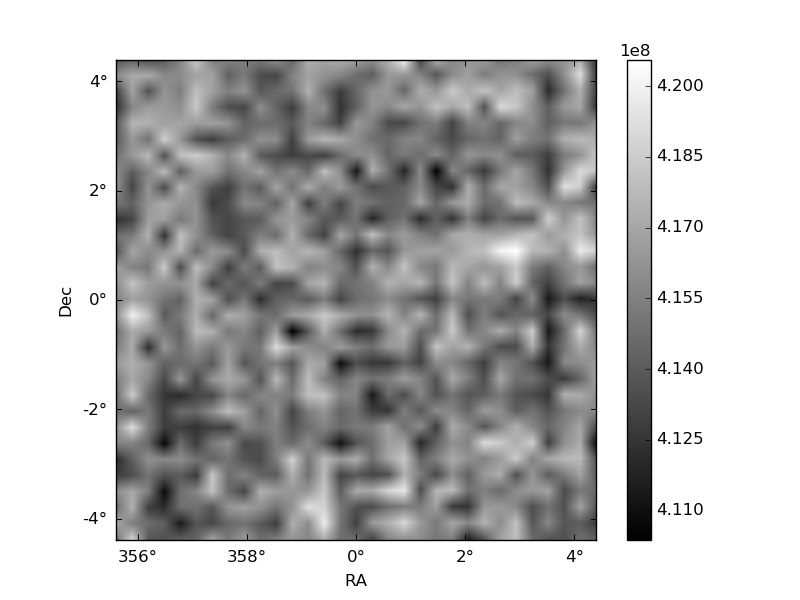
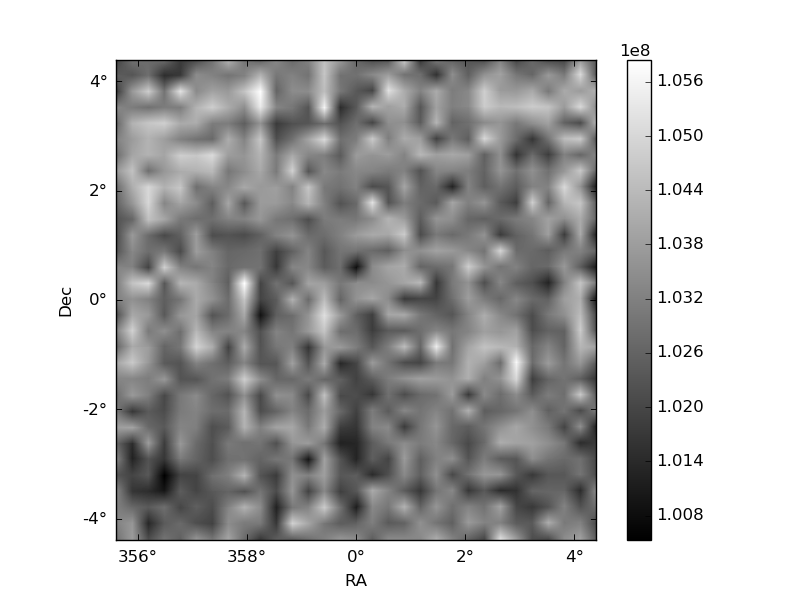
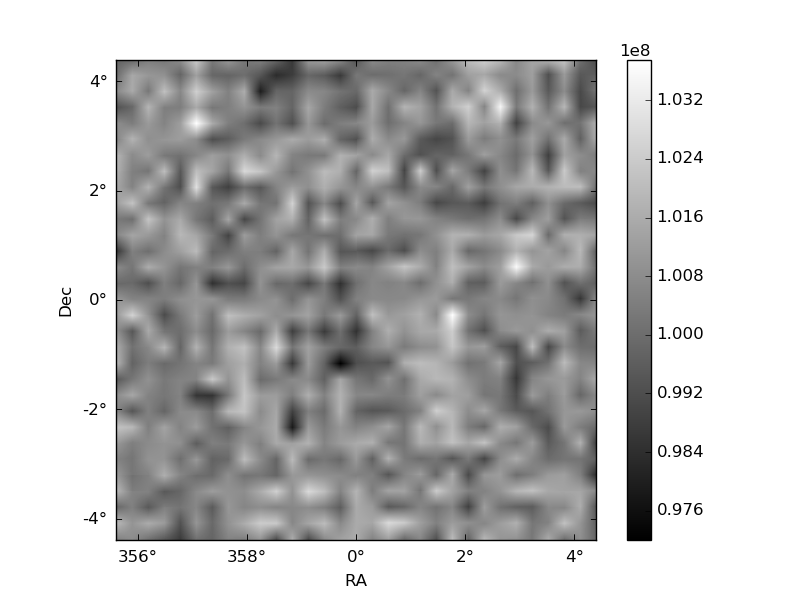
Histogram calculated using DETX and DETY for each event in the final _common_clean file
| Quadrant A | 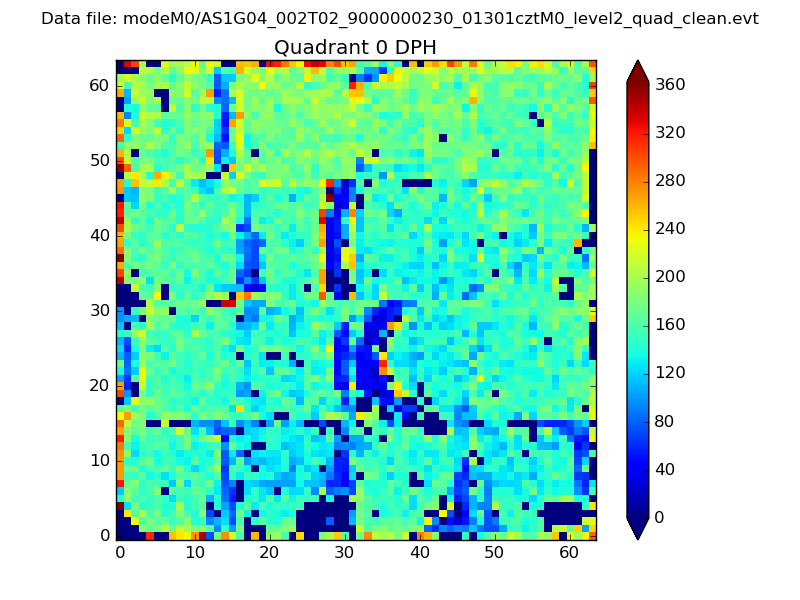 |
 |
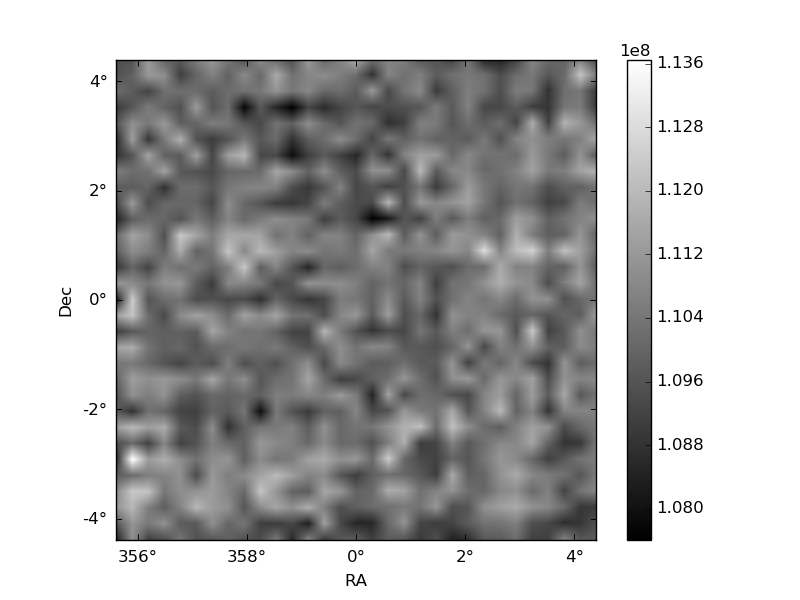
Quadrant B |
|---|---|---|---|
| Quadrant D | 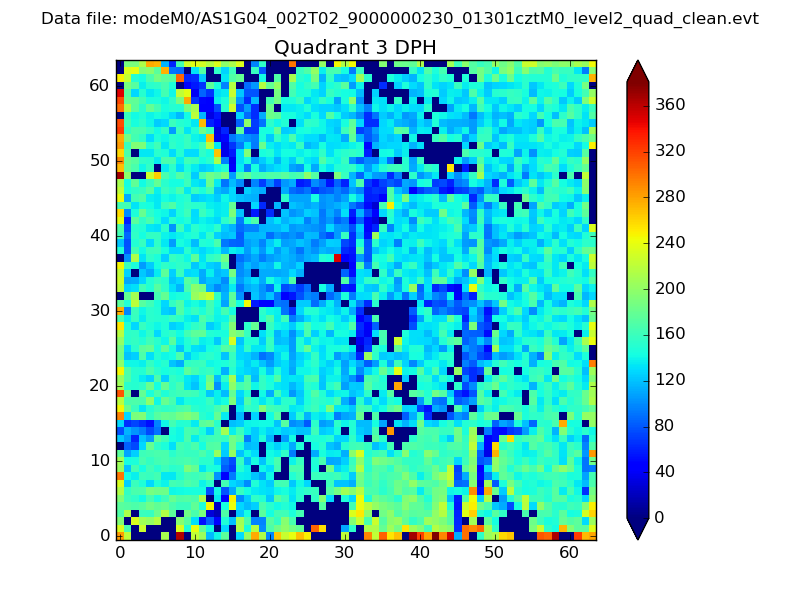 |
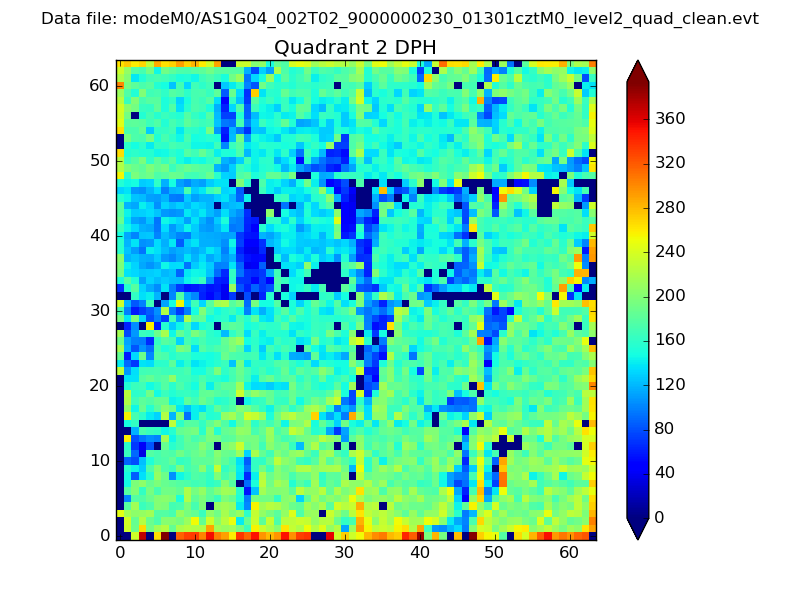 |
Quadrant C |
| Plot type | Count rate plots | Images |
|---|---|---|
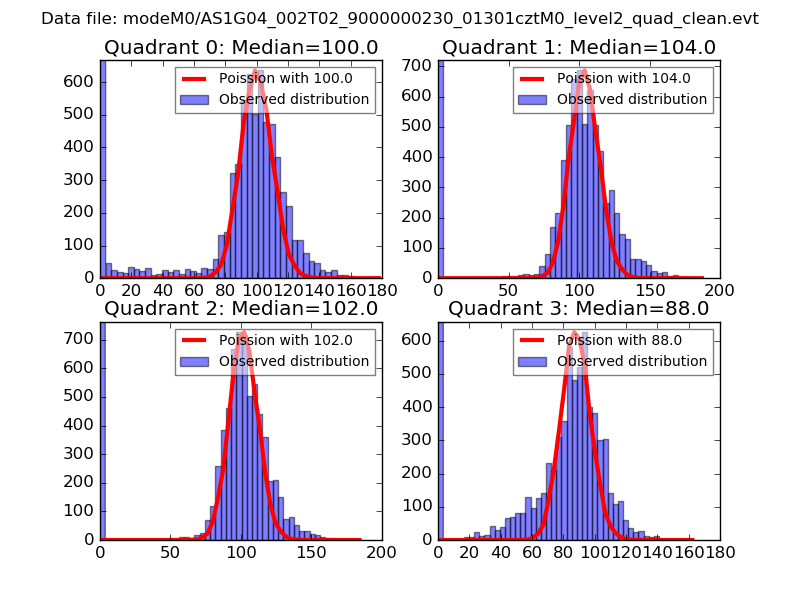
| Comparison with Poisson distribution Blue bars denote a histogram of data divided into 1 sec bins. Red curve is a Poisson curve with rate = median count rate of data. |
 |
 |
| Quadrant-wise count rates Data is divided into 100 sec bins |
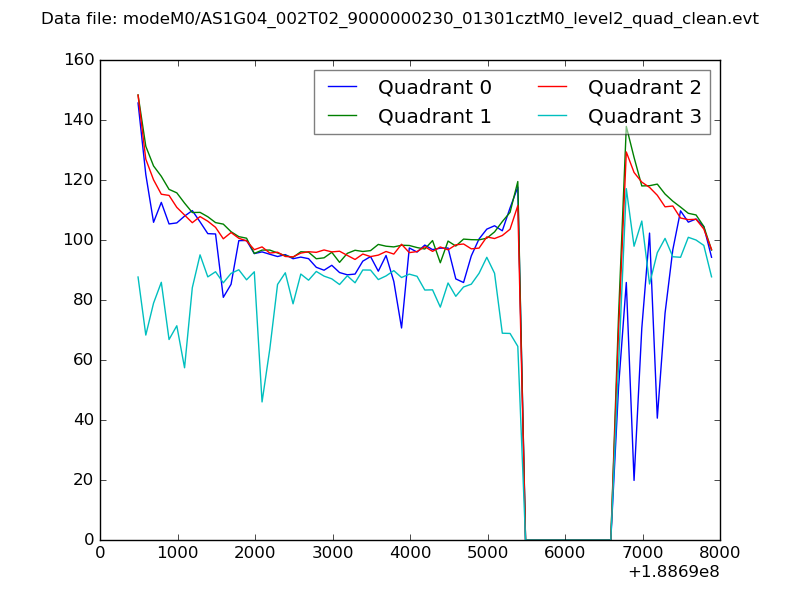 |
|
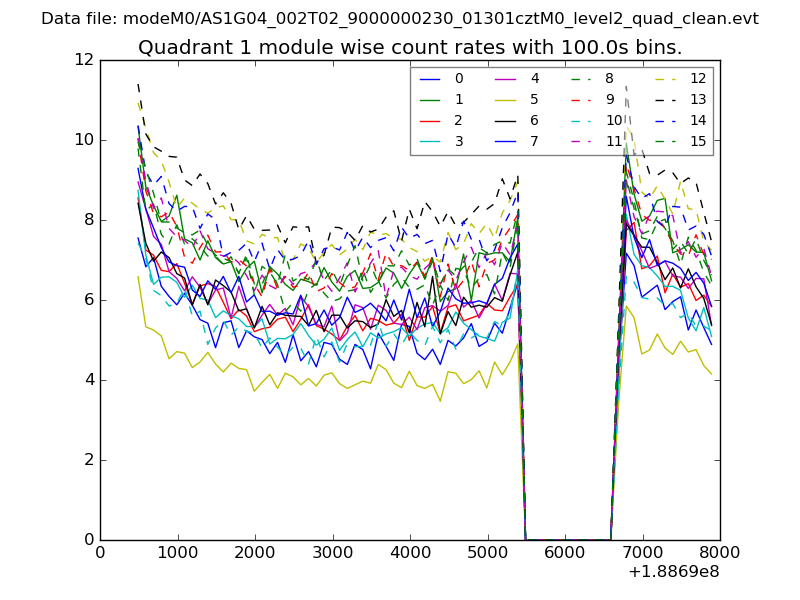
| Module-wise count rates for Quadrant A Data is divided into 100 sec bins |
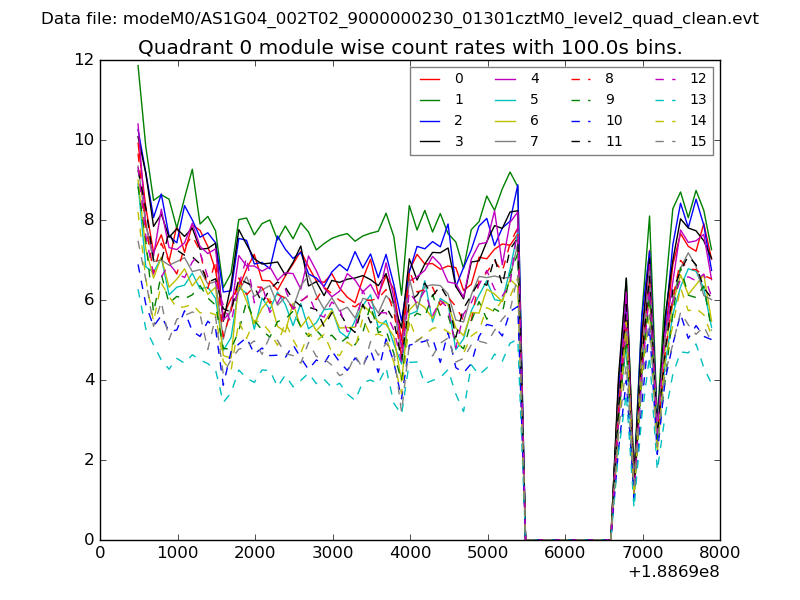 |
 |
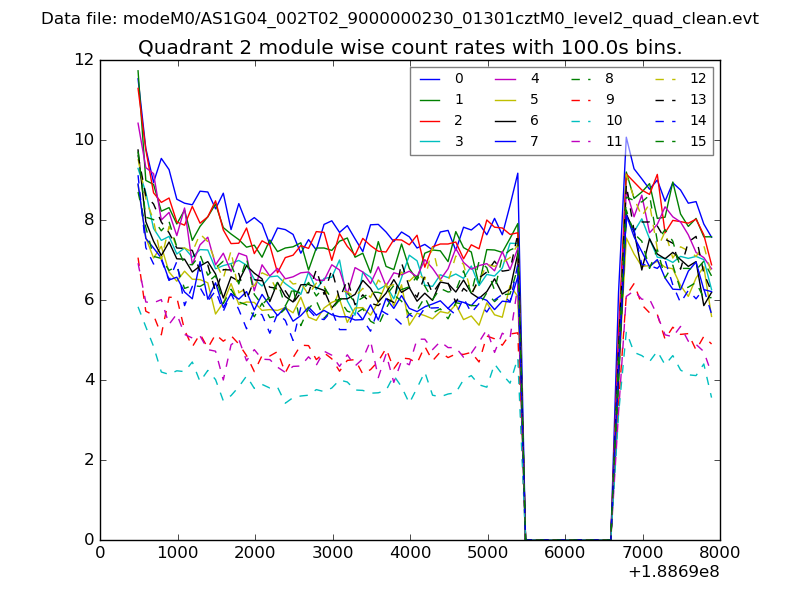
| Module-wise count rates for Quadrant B Data is divided into 100 sec bins |
 |
 |
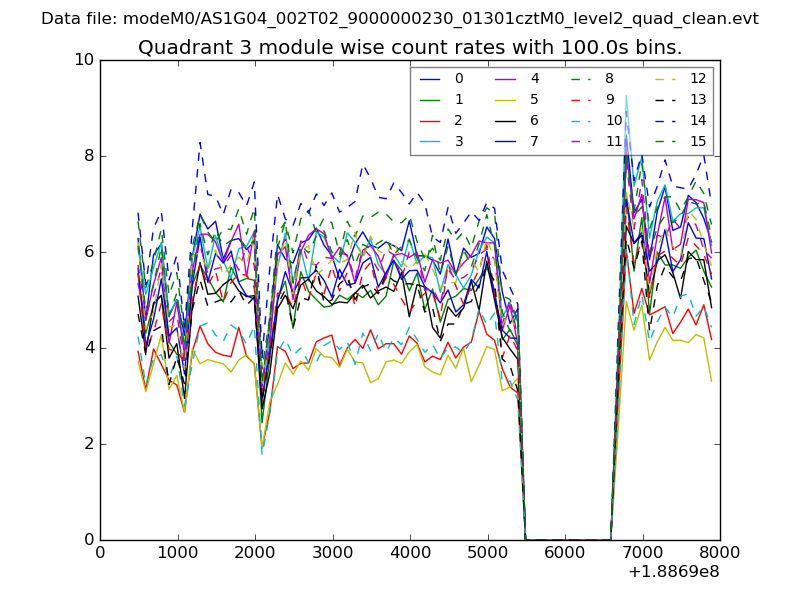
| Module-wise count rates for Quadrant C Data is divided into 100 sec bins |
 |
 |
| Module-wise count rates for Quadrant D Data is divided into 100 sec bins |
 |
 |
| Parameter | Plot |
|---|---|
| CZT HV Monitor | 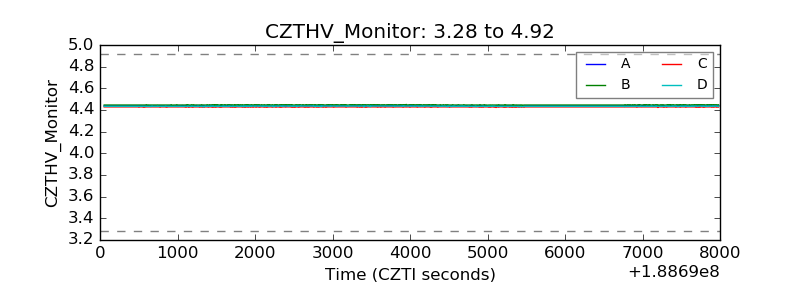 |
| D_VDD | 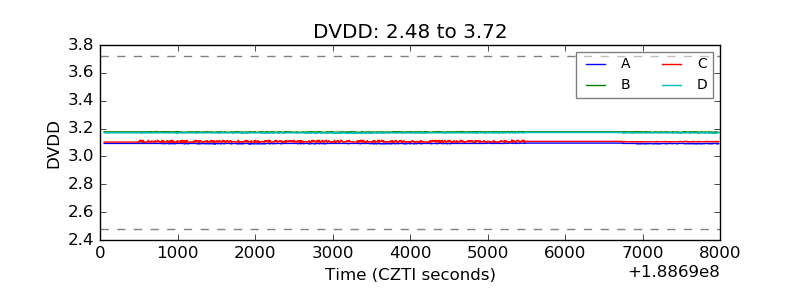 |
| Temperature 1 | 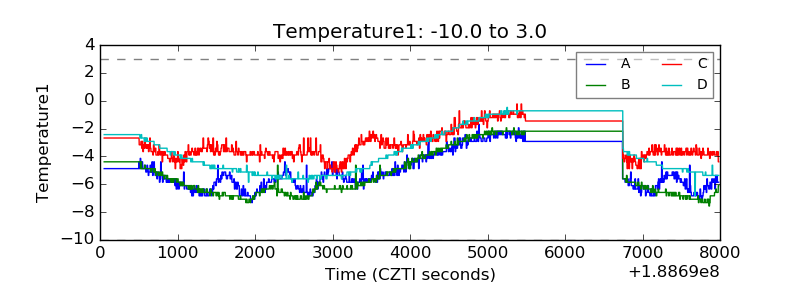 |
| Veto HV Monitor | 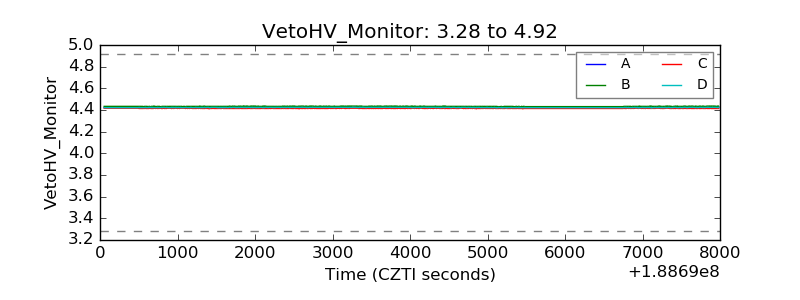 |
| Veto LLD | 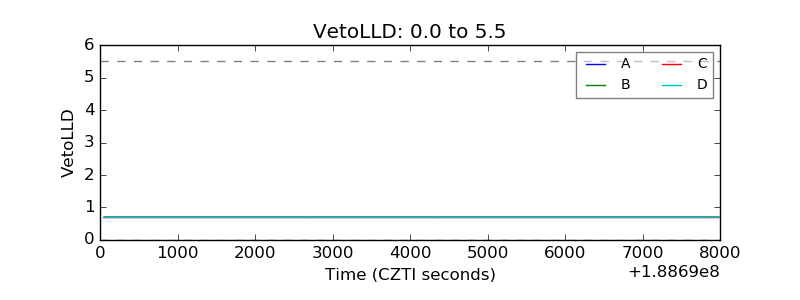 |
| Alpha Counter | 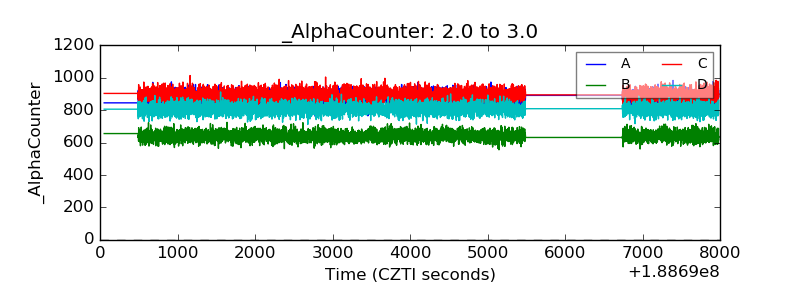 |
| _CPM_Rate | 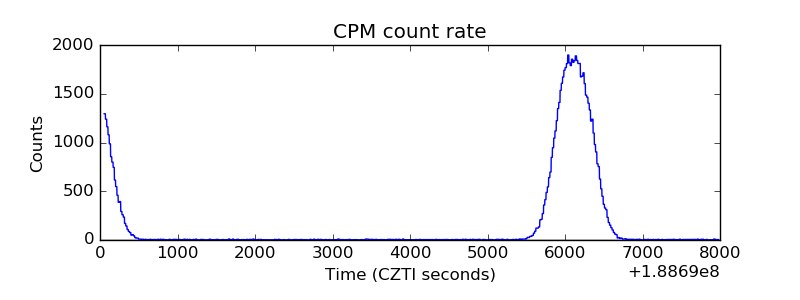 |
| CZT Counter | 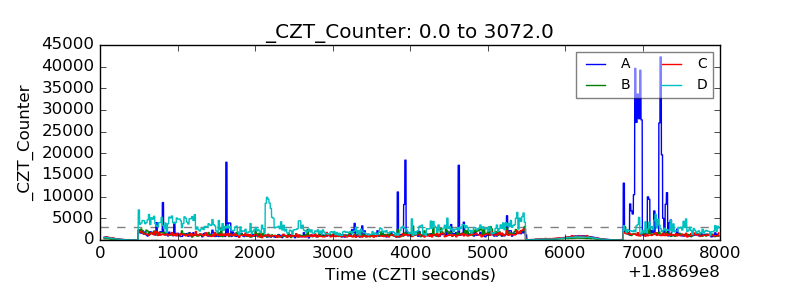 |
| +2.5 Volts monitor |  |
| +5 Volts monitor |  |
| _ROLL_ROT | 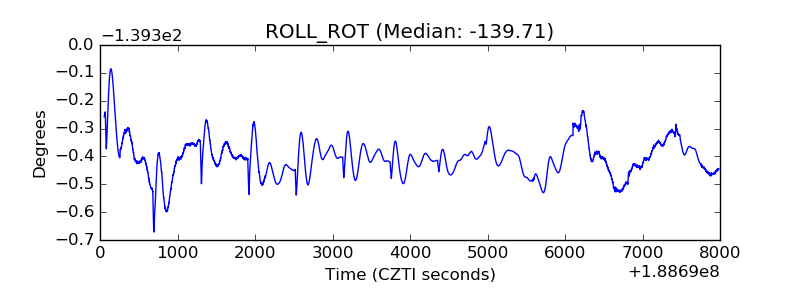 |
| _Roll_DEC | 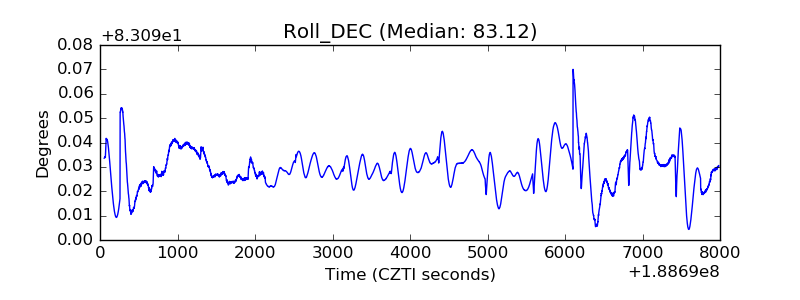 |
| _Roll_RA | 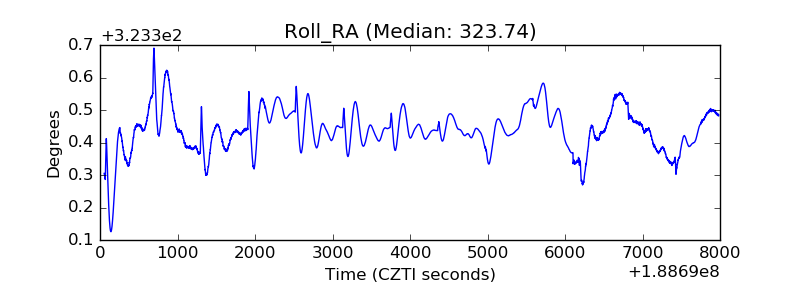 |
| Veto Counter | 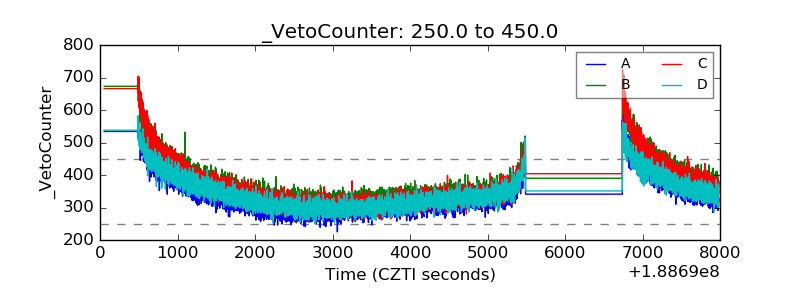 |