| Param | Original file | Final file |
|---|---|---|
| Filename | modeM0/AS1G04_002T02_9000000230_01302cztM0_level2.evt | modeM0/AS1G04_002T02_9000000230_01302cztM0_level2_quad_clean.evt |
| Size (bytes) | 1,254,888,000 | 100,831,680 |
| Size | 1.2 GB | 96.2 MB |
| Events in quadrant A | 8,291,356 | 650,279 |
| Events in quadrant B | 8,519,172 | 698,121 |
| Events in quadrant C | 7,674,452 | 678,738 |
| Events in quadrant D | 13,088,622 | 570,407 |
| Mode M9 | |||
|---|---|---|---|
| Quadrant | BADHDUFLAG | Total packets | Discarded packets |
| A | 0 | 16 | 0 |
| B | 0 | 16 | 0 |
| C | 0 | 16 | 0 |
| D | 0 | 17 | 0 |
| Mode M0 | |||
|---|---|---|---|
| Quadrant | BADHDUFLAG | Total packets | Discarded packets |
| A | 0 | 29289 | 3 |
| B | 0 | 29984 | 2 |
| C | 0 | 27439 | 2 |
| D | 0 | 43650 | 2 |
| Mode SS | |||
|---|---|---|---|
| Quadrant | BADHDUFLAG | Total packets | Discarded packets |
| A | 0 | 134 | 0 |
| B | 0 | 134 | 0 |
| C | 0 | 134 | 0 |
| D | 0 | 134 | 0 |
| Quadrant | Total seconds | Saturated seconds | Saturation percentage |
|---|---|---|---|
| A | 6524 | 374 | 5.732679% |
| B | 6524 | 51 | 0.781729% |
| C | 6524 | 4 | 0.061312% |
| D | 6524 | 1339 | 20.524218% |
Noise dominated data is calculated using 1-second bins in cleaned event files. If a bin has >2000 counts, and if more than 50% of those come from <1% of pixels, then it is considered to be noise-dominated and hence unusable.
| Quadrant | # 1 sec bins | Bins with >0 counts | Bins with >2000 counts | High rate bins dominated by noise | Noise dominated (total time) | Noise dominated (detector-on time) | Marked lightcurve |
|---|---|---|---|---|---|---|---|
| A | 7814 | 6525 | 560 | 560 | 7.17% | 8.58% | 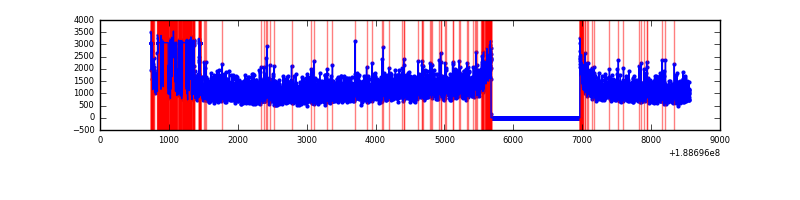 |
| B | 7814 | 6525 | 423 | 423 | 5.41% | 6.48% | 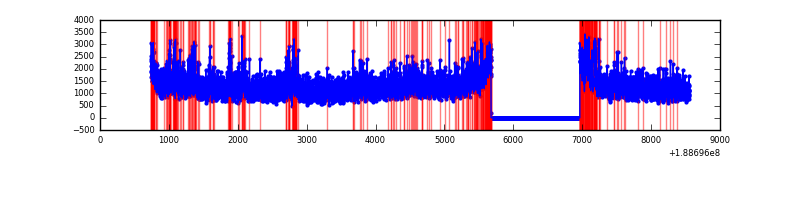 |
| C | 7814 | 6525 | 172 | 172 | 2.20% | 2.64% | 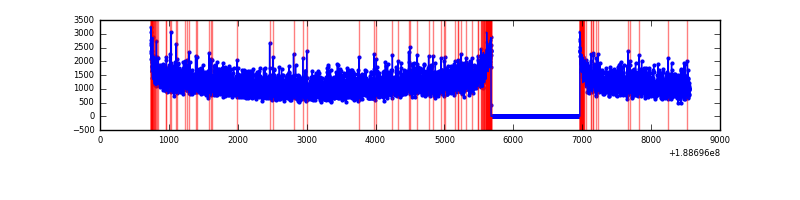 |
| D | 7814 | 6524 | 2844 | 2844 | 36.40% | 43.59% | 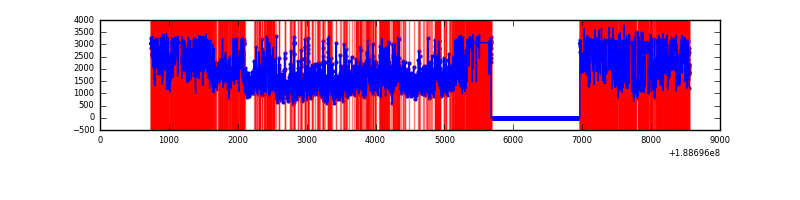 |
Top three noisy pixels from each quadrant. If the there are fewer than three noisy pixels in the level2.evt file, extra rows are filled as -1
| Pixel properties | Quadrant properties | ||||||
|---|---|---|---|---|---|---|---|
| Quadrant | DetID | PixID | Counts | Sigma | Mean | Median | Sigma |
| A | 4 | 32 | 1086317 | 2447.86 | 1862 | 1873 | 443.0 |
| A | 15 | 127 | 30028 | 63.55 | 1862 | 1873 | 443.0 |
| A | 0 | 253 | 14866 | 29.33 | 1862 | 1873 | 443.0 |
| B | 8 | 4 | 350661 | 729.79 | 2043 | 2052 | 477.7 |
| B | 12 | 52 | 204965 | 424.79 | 2043 | 2052 | 477.7 |
| B | 6 | 53 | 146766 | 302.95 | 2043 | 2052 | 477.7 |
| C | 15 | 241 | 327053 | 636.81 | 1851 | 1910 | 510.6 |
| C | 8 | 208 | 66418 | 126.34 | 1851 | 1910 | 510.6 |
| C | 3 | 111 | 20848 | 37.09 | 1851 | 1910 | 510.6 |
| D | 13 | 169 | 4508761 | 9318.53 | 1582 | 1634 | 483.7 |
| D | 12 | 22 | 1896368 | 3917.38 | 1582 | 1634 | 483.7 |
| D | 10 | 84 | 713022 | 1470.8 | 1582 | 1634 | 483.7 |
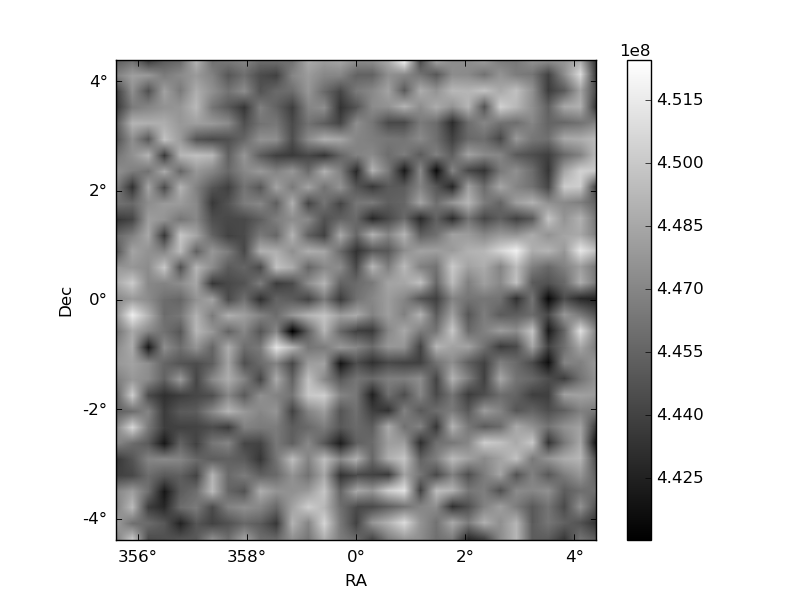
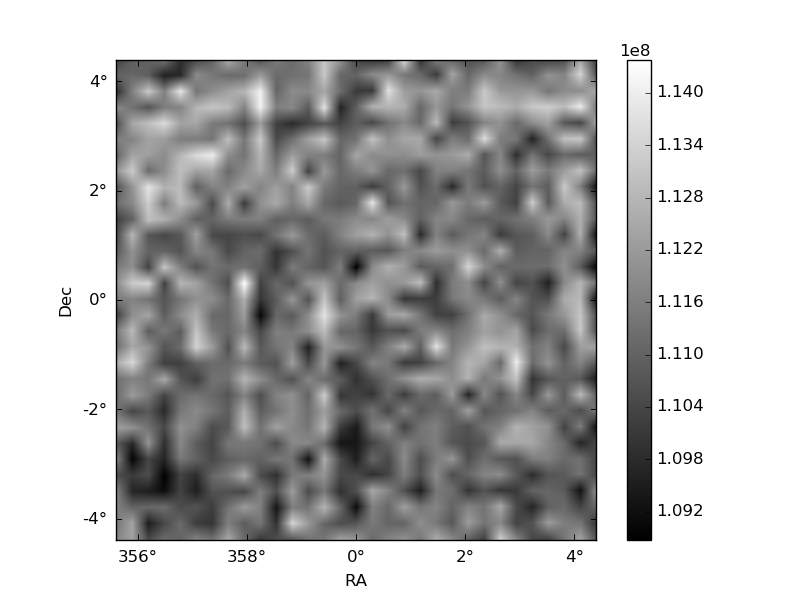
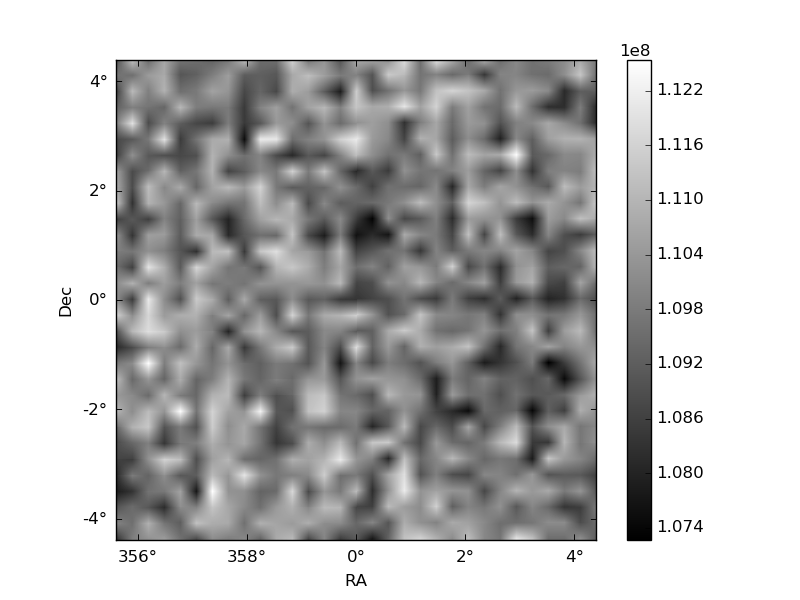
Histogram calculated using DETX and DETY for each event in the final _common_clean file
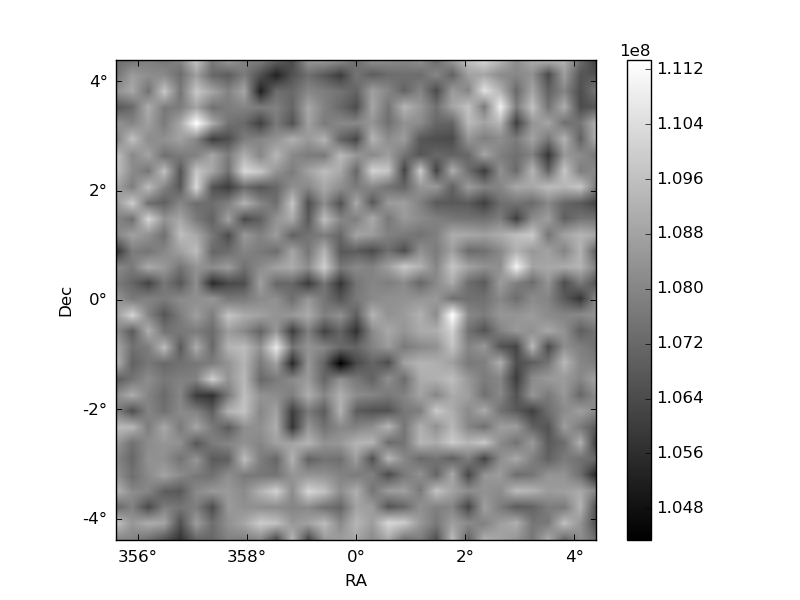
| Quadrant A | 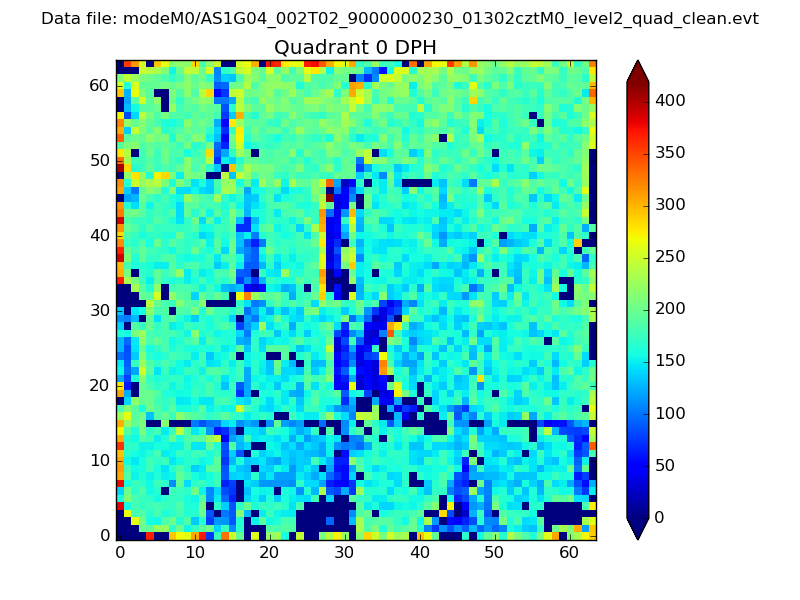 |
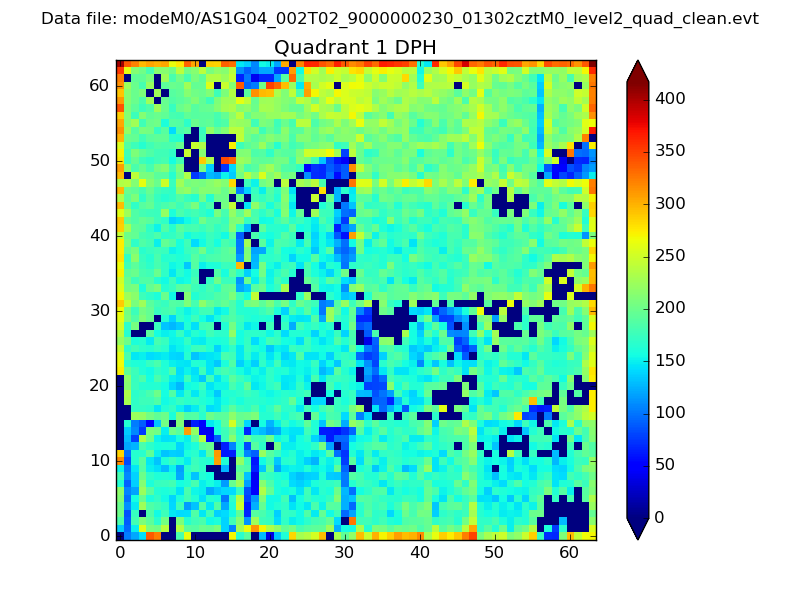 |
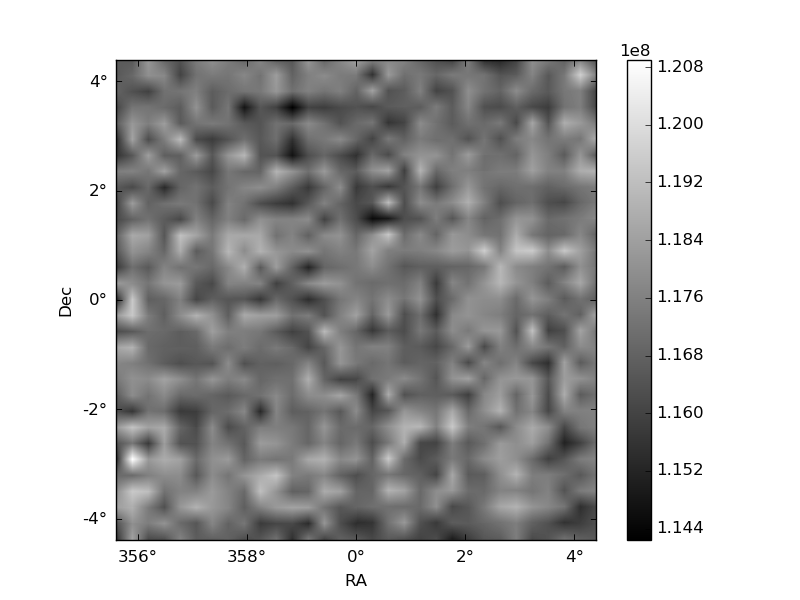
Quadrant B |
|---|---|---|---|
| Quadrant D | 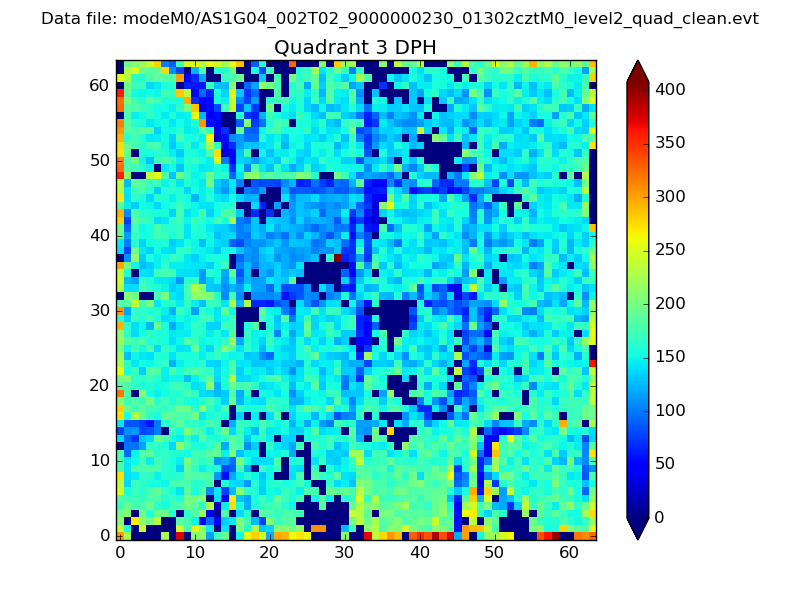 |
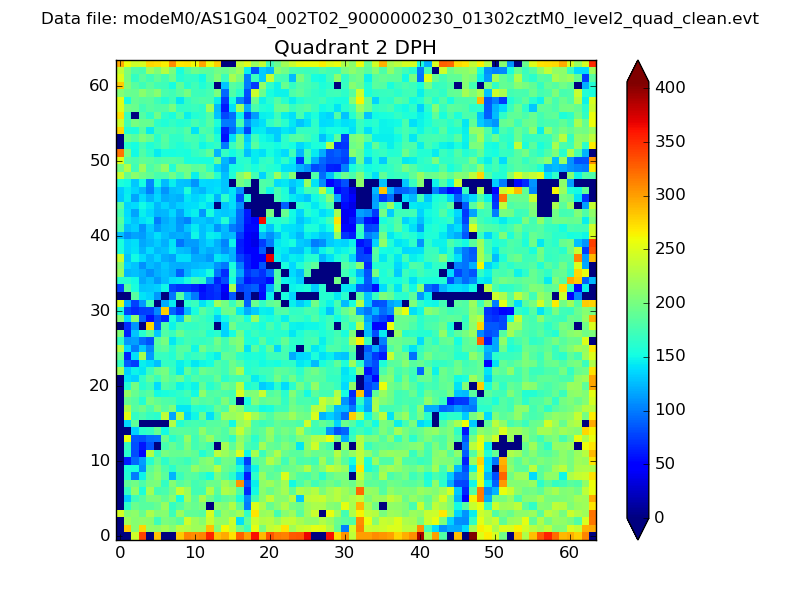 |
Quadrant C |
| Plot type | Count rate plots | Images |
|---|---|---|
| Comparison with Poisson distribution Blue bars denote a histogram of data divided into 1 sec bins. Red curve is a Poisson curve with rate = median count rate of data. |
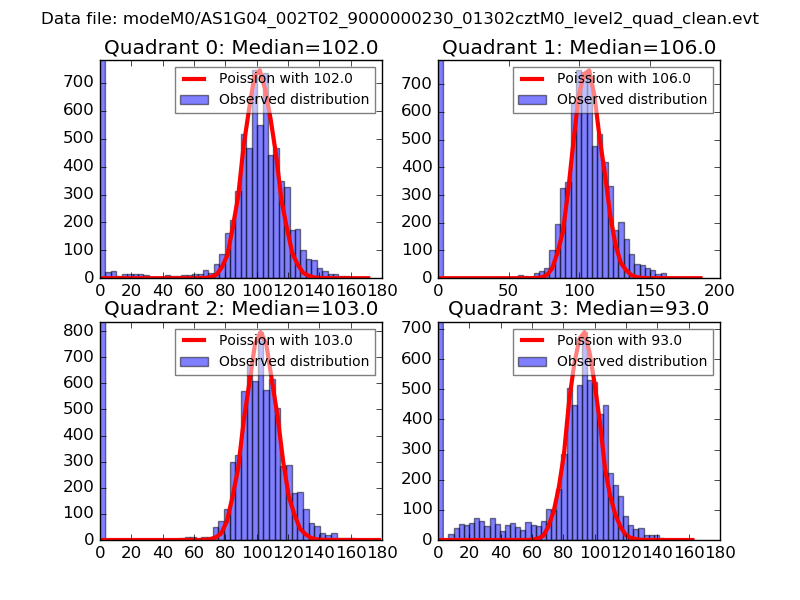 |
 |
| Quadrant-wise count rates Data is divided into 100 sec bins |
 |
|
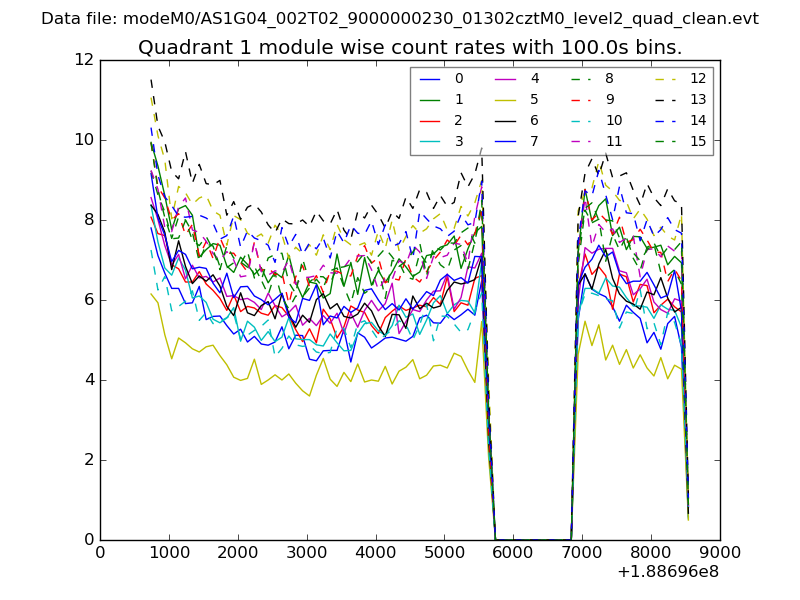
| Module-wise count rates for Quadrant A Data is divided into 100 sec bins |
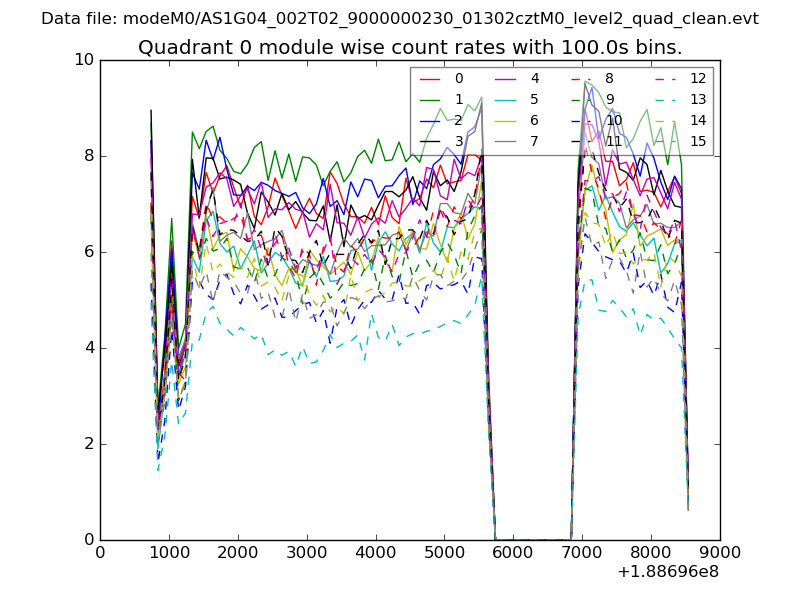 |
 |
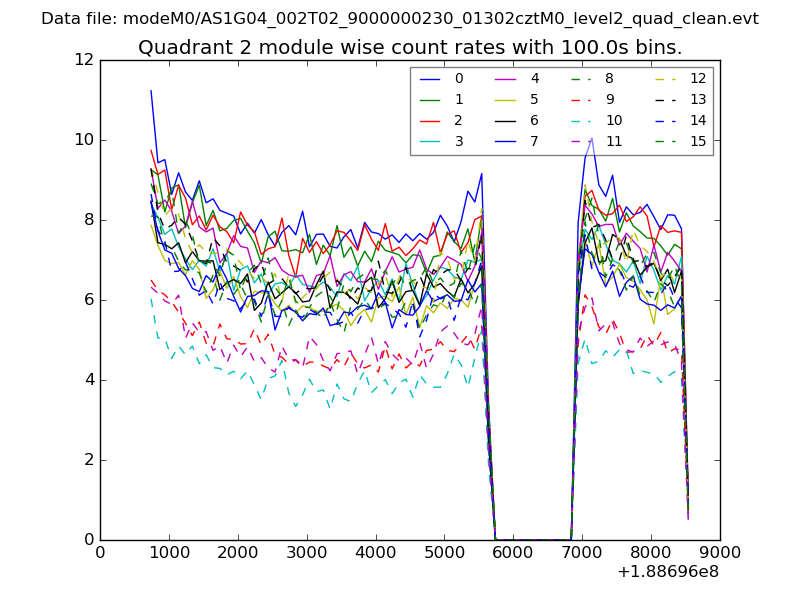
| Module-wise count rates for Quadrant B Data is divided into 100 sec bins |
 |
 |
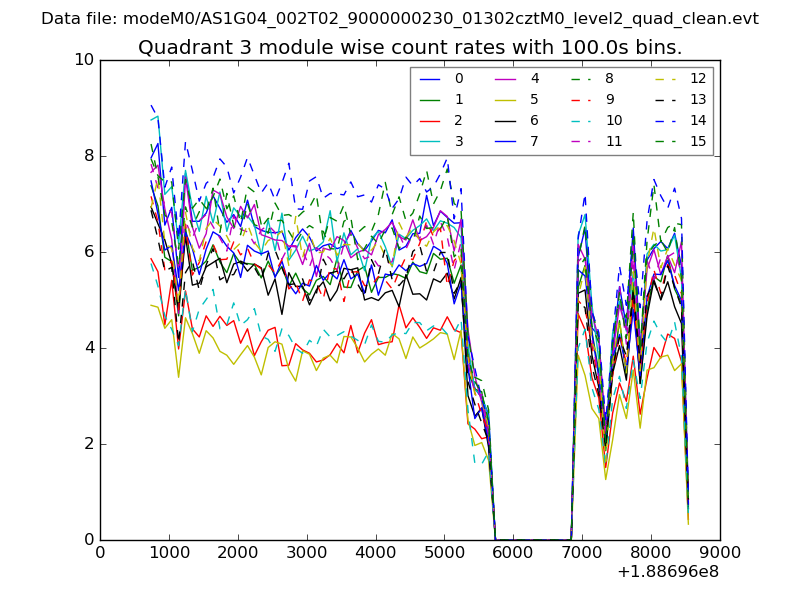
| Module-wise count rates for Quadrant C Data is divided into 100 sec bins |
 |
 |
| Module-wise count rates for Quadrant D Data is divided into 100 sec bins |
 |
 |
| Parameter | Plot |
|---|---|
| CZT HV Monitor | 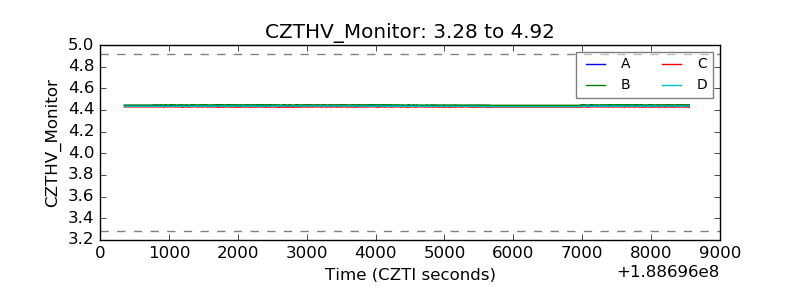 |
| D_VDD | 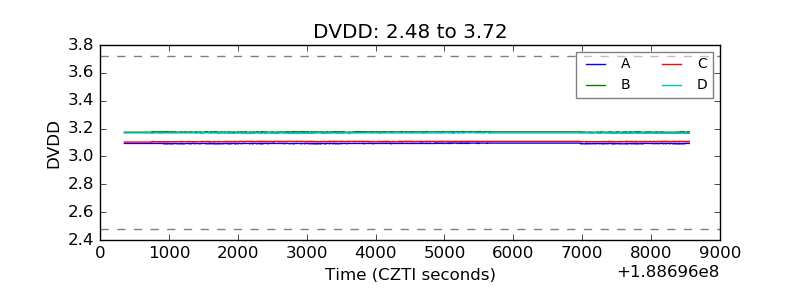 |
| Temperature 1 | 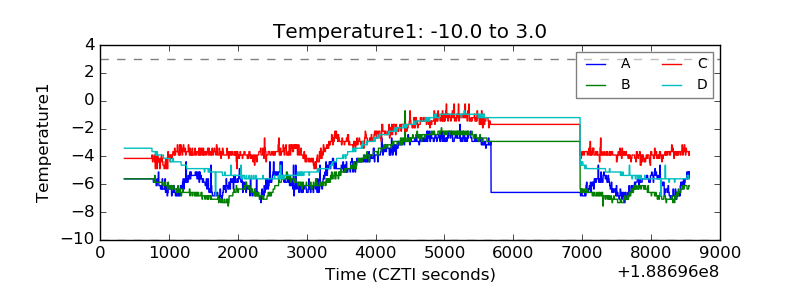 |
| Veto HV Monitor | 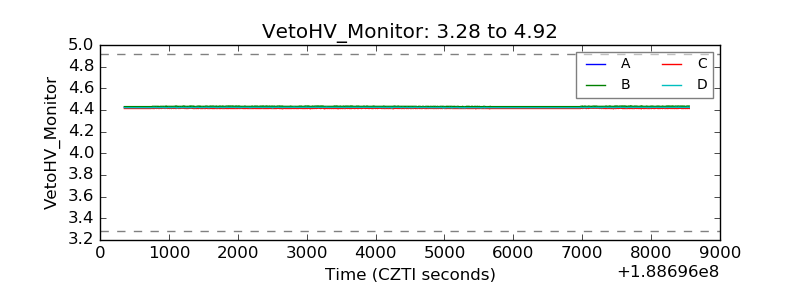 |
| Veto LLD | 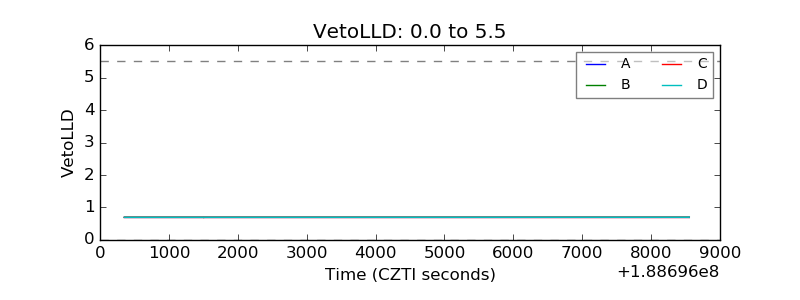 |
| Alpha Counter | 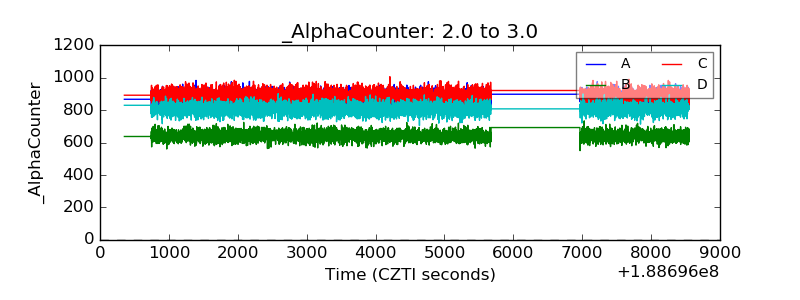 |
| _CPM_Rate | 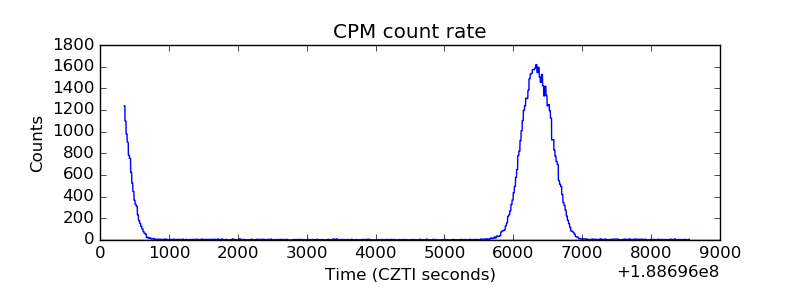 |
| CZT Counter | 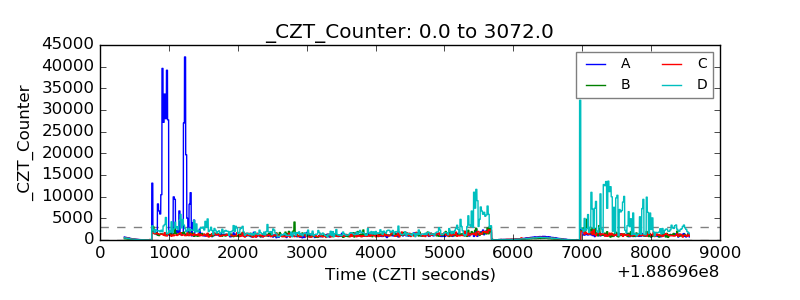 |
| +2.5 Volts monitor |  |
| +5 Volts monitor |  |
| _ROLL_ROT | 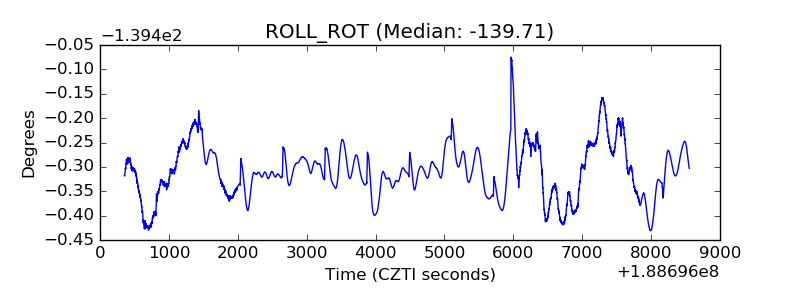 |
| _Roll_DEC | 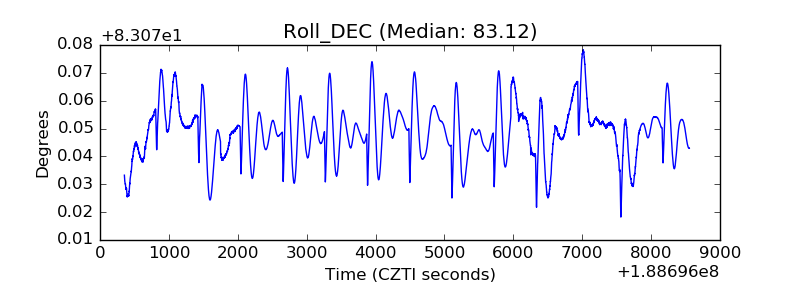 |
| _Roll_RA | 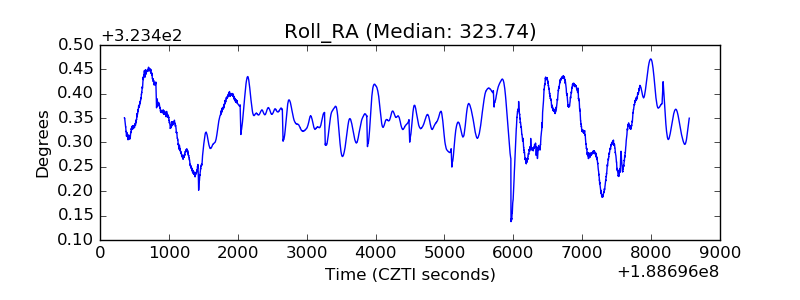 |
| Veto Counter | 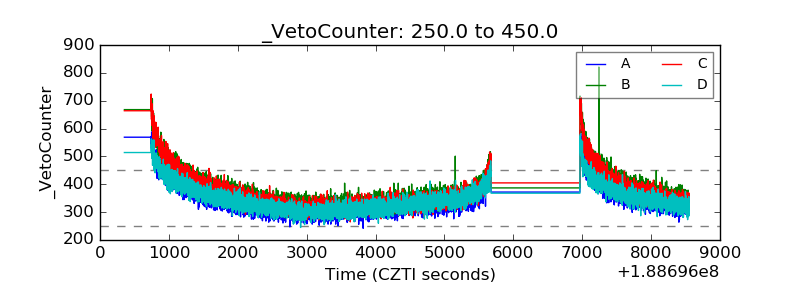 |