| Param | Original file | Final file |
|---|---|---|
| Filename | modeM0/AS1G04_002T02_9000000230_01303cztM0_level2.evt | modeM0/AS1G04_002T02_9000000230_01303cztM0_level2_quad_clean.evt |
| Size (bytes) | 1,201,844,160 | 97,246,080 |
| Size | 1.1 GB | 92.7 MB |
| Events in quadrant A | 7,262,954 | 653,729 |
| Events in quadrant B | 7,938,262 | 663,150 |
| Events in quadrant C | 7,306,647 | 640,612 |
| Events in quadrant D | 13,470,814 | 543,716 |
| Mode M9 | |||
|---|---|---|---|
| Quadrant | BADHDUFLAG | Total packets | Discarded packets |
| A | 0 | 13 | 0 |
| B | 0 | 13 | 0 |
| C | 0 | 13 | 0 |
| D | 0 | 13 | 0 |
| Mode M0 | |||
|---|---|---|---|
| Quadrant | BADHDUFLAG | Total packets | Discarded packets |
| A | 0 | 26093 | 2 |
| B | 0 | 28085 | 1 |
| C | 0 | 26179 | 1 |
| D | 0 | 44677 | 1 |
| Mode SS | |||
|---|---|---|---|
| Quadrant | BADHDUFLAG | Total packets | Discarded packets |
| A | 0 | 130 | 0 |
| B | 0 | 130 | 0 |
| C | 0 | 130 | 0 |
| D | 0 | 130 | 0 |
| Quadrant | Total seconds | Saturated seconds | Saturation percentage |
|---|---|---|---|
| A | 6349 | 2 | 0.031501% |
| B | 6349 | 28 | 0.441014% |
| C | 6349 | 7 | 0.110254% |
| D | 6349 | 1377 | 21.688455% |
Noise dominated data is calculated using 1-second bins in cleaned event files. If a bin has >2000 counts, and if more than 50% of those come from <1% of pixels, then it is considered to be noise-dominated and hence unusable.
| Quadrant | # 1 sec bins | Bins with >0 counts | Bins with >2000 counts | High rate bins dominated by noise | Noise dominated (total time) | Noise dominated (detector-on time) | Marked lightcurve |
|---|---|---|---|---|---|---|---|
| A | 7669 | 6350 | 142 | 142 | 1.85% | 2.24% | 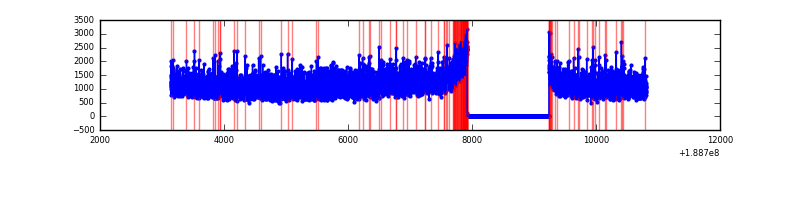 |
| B | 7669 | 6350 | 293 | 293 | 3.82% | 4.61% | 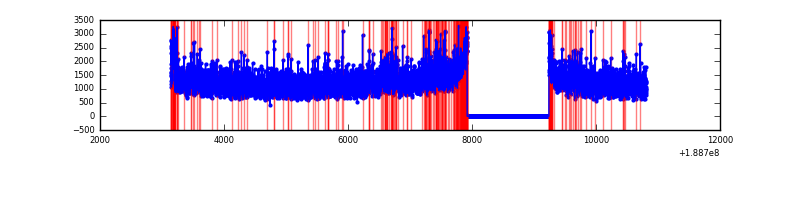 |
| C | 7669 | 6350 | 134 | 134 | 1.75% | 2.11% | 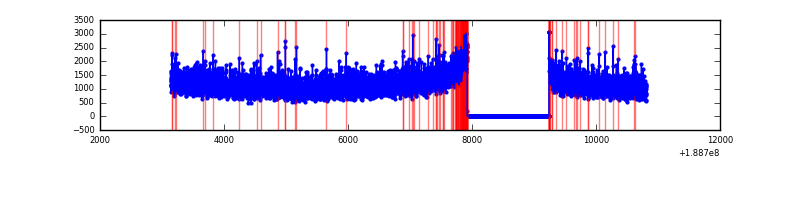 |
| D | 7669 | 6349 | 3223 | 3223 | 42.03% | 50.76% | 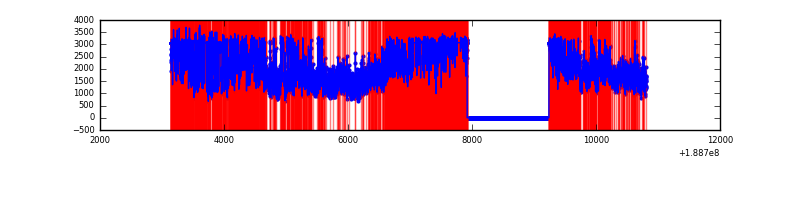 |
Top three noisy pixels from each quadrant. If the there are fewer than three noisy pixels in the level2.evt file, extra rows are filled as -1
| Pixel properties | Quadrant properties | ||||||
|---|---|---|---|---|---|---|---|
| Quadrant | DetID | PixID | Counts | Sigma | Mean | Median | Sigma |
| A | 15 | 233 | 19629 | 39.4 | 1879 | 1891 | 450.2 |
| A | 12 | 243 | 19277 | 38.62 | 1879 | 1891 | 450.2 |
| A | 11 | 79 | 7453 | 12.36 | 1879 | 1891 | 450.2 |
| B | 8 | 4 | 165370 | 351.77 | 1974 | 1984 | 464.5 |
| B | 6 | 53 | 107388 | 226.93 | 1974 | 1984 | 464.5 |
| B | 12 | 52 | 83332 | 175.14 | 1974 | 1984 | 464.5 |
| C | 15 | 241 | 307895 | 627.07 | 1762 | 1820 | 488.1 |
| C | 8 | 208 | 36304 | 70.65 | 1762 | 1820 | 488.1 |
| C | 10 | 19 | 22482 | 42.33 | 1762 | 1820 | 488.1 |
| D | 13 | 169 | 5242661 | 11049.52 | 1542 | 1590 | 474.3 |
| D | 12 | 22 | 2284144 | 4812.21 | 1542 | 1590 | 474.3 |
| D | 10 | 84 | 73605 | 151.83 | 1542 | 1590 | 474.3 |
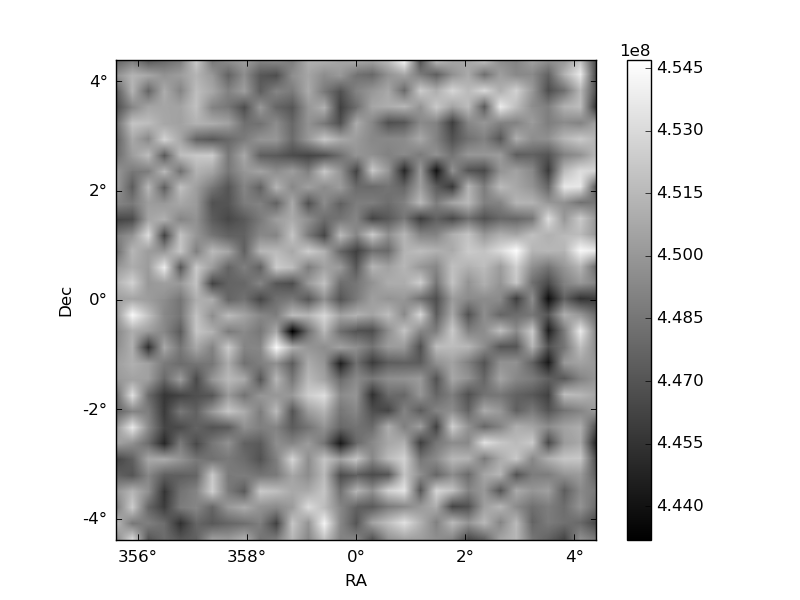
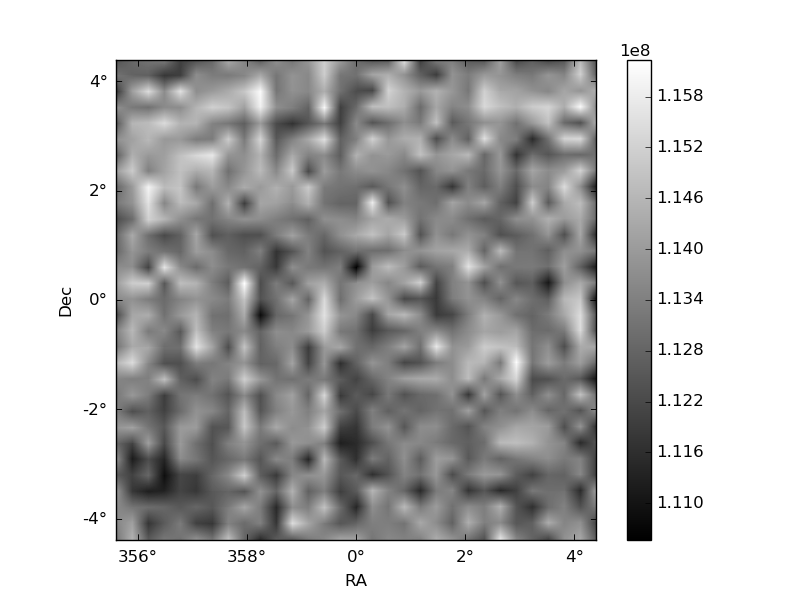
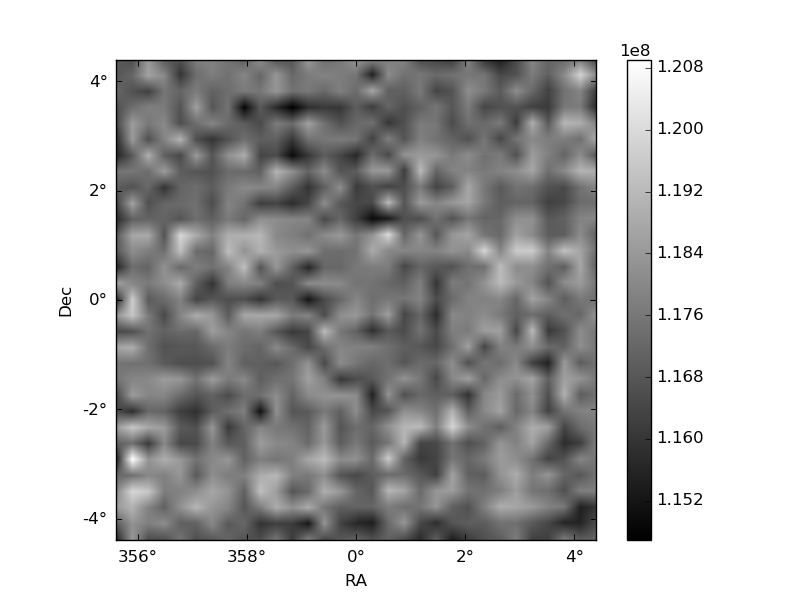
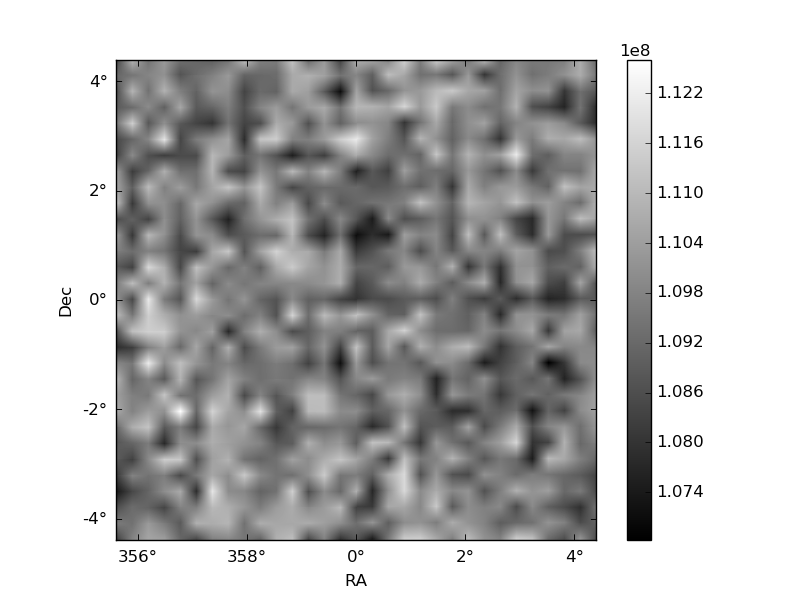
Histogram calculated using DETX and DETY for each event in the final _common_clean file
| Quadrant A | 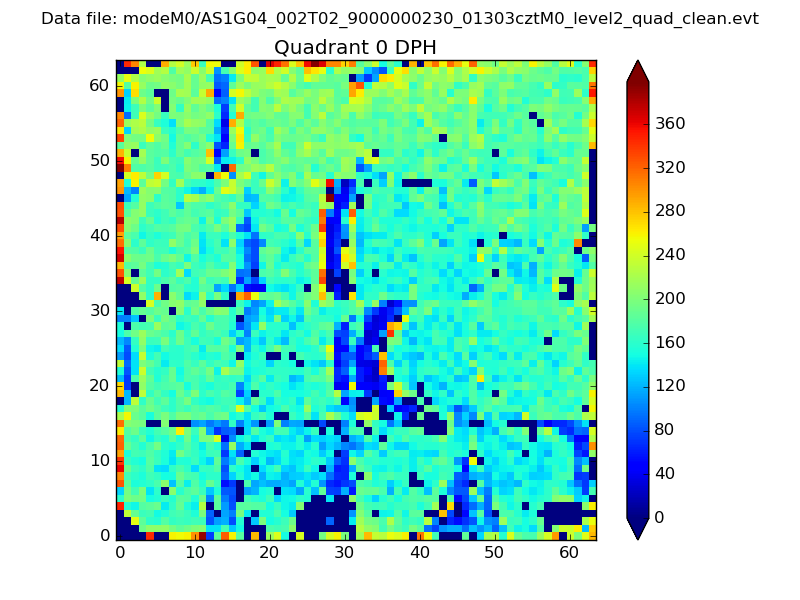 |
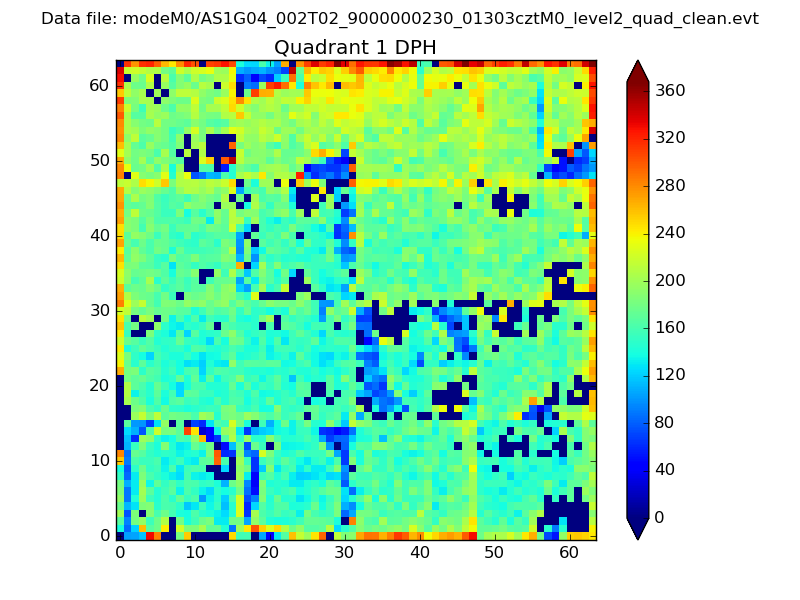 |
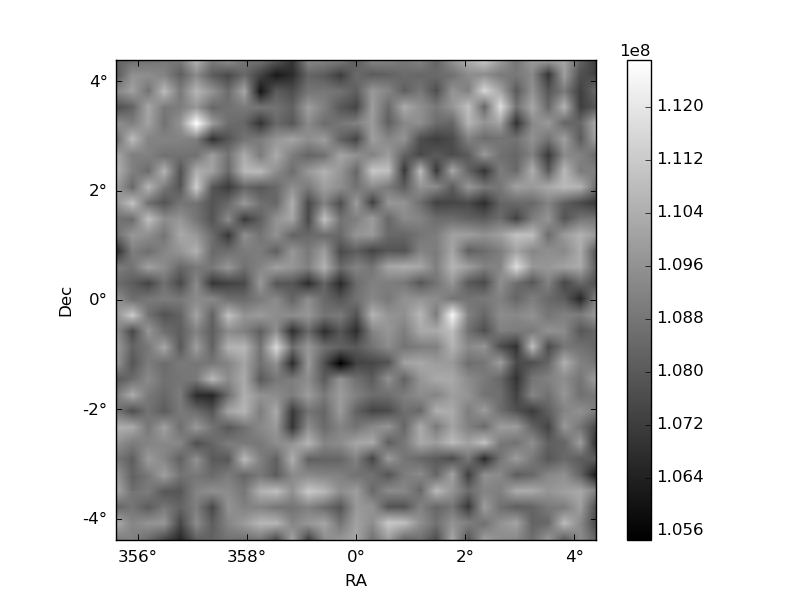
Quadrant B |
|---|---|---|---|
| Quadrant D | 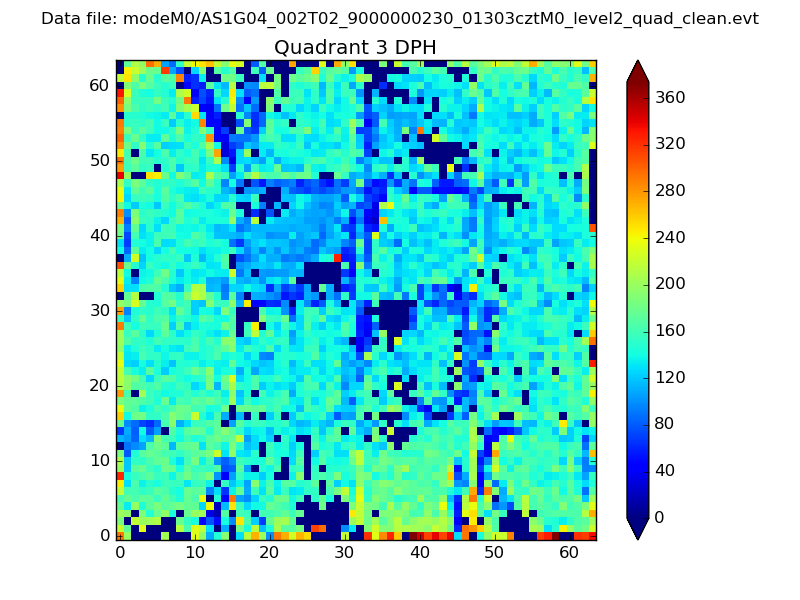 |
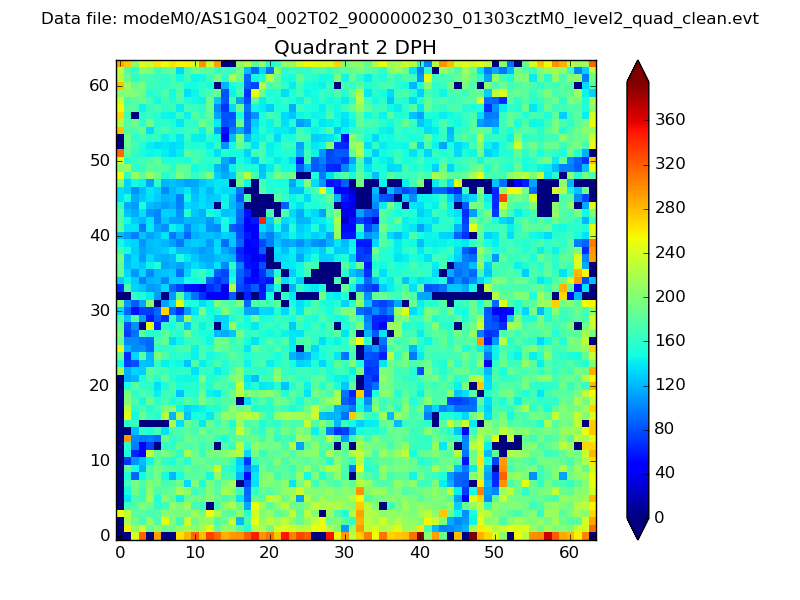 |
Quadrant C |
| Plot type | Count rate plots | Images |
|---|---|---|
| Comparison with Poisson distribution Blue bars denote a histogram of data divided into 1 sec bins. Red curve is a Poisson curve with rate = median count rate of data. |
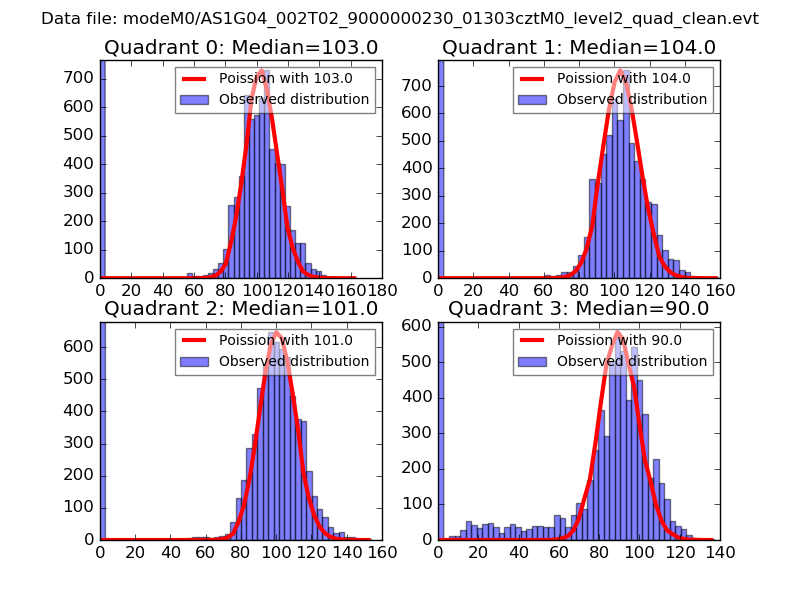 |
 |
| Quadrant-wise count rates Data is divided into 100 sec bins |
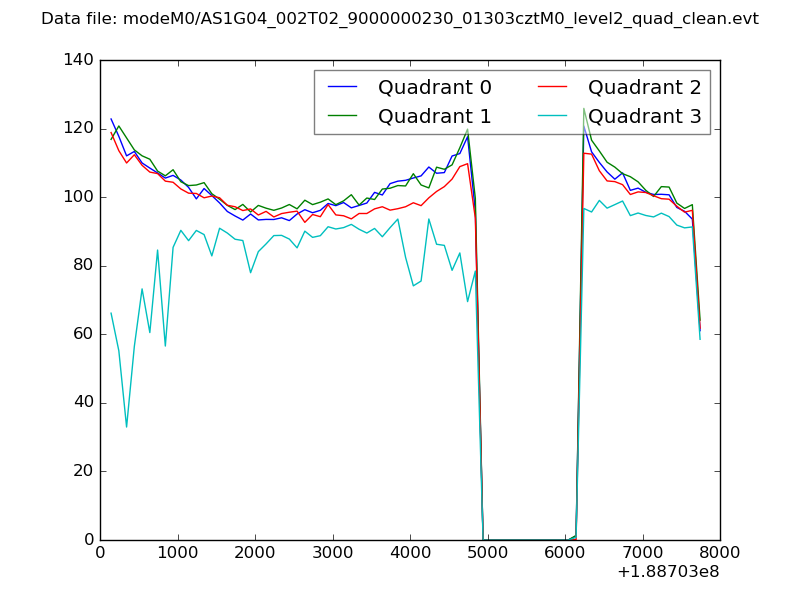 |
|
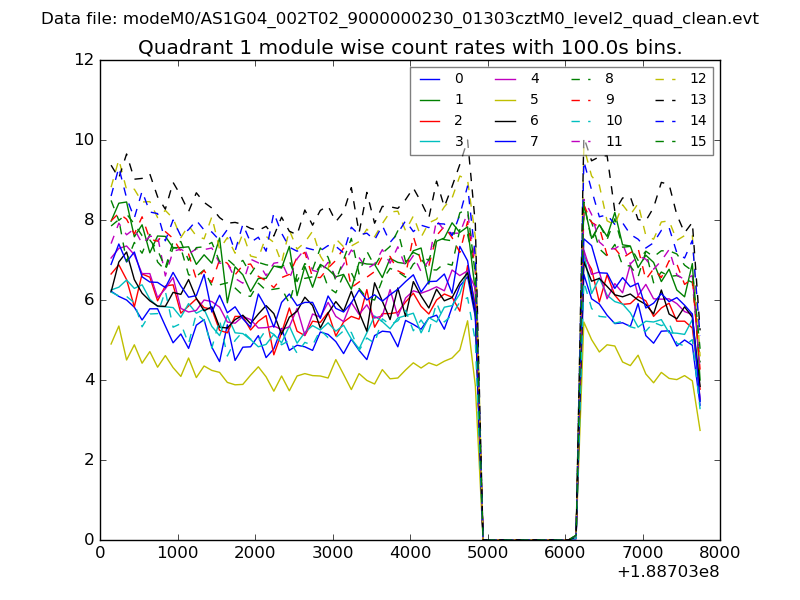
| Module-wise count rates for Quadrant A Data is divided into 100 sec bins |
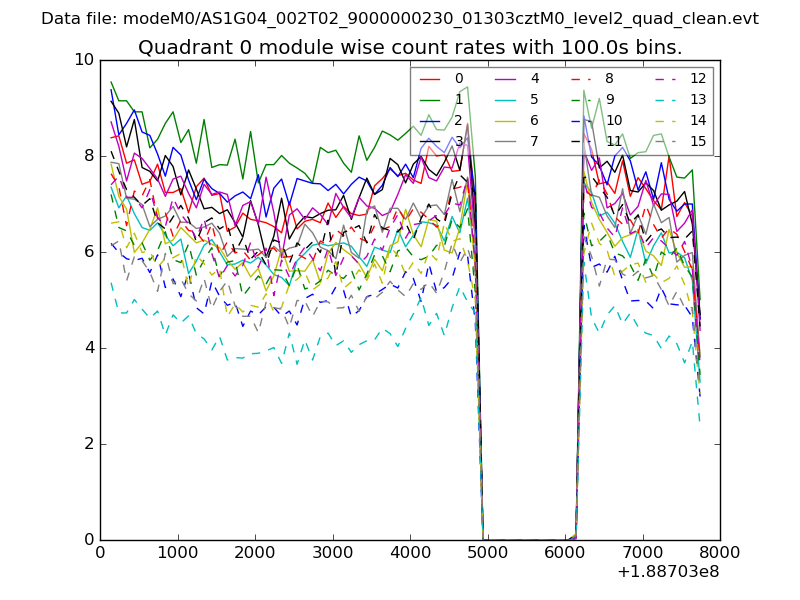 |
 |
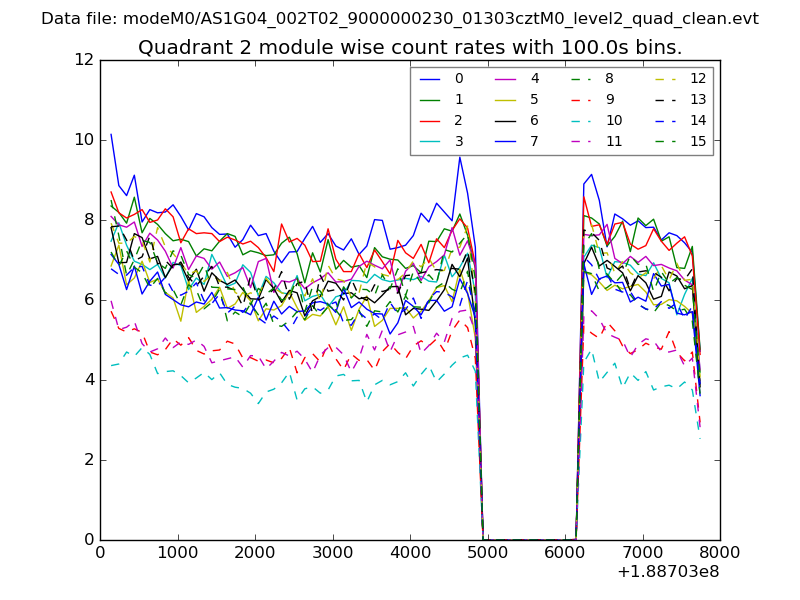
| Module-wise count rates for Quadrant B Data is divided into 100 sec bins |
 |
 |
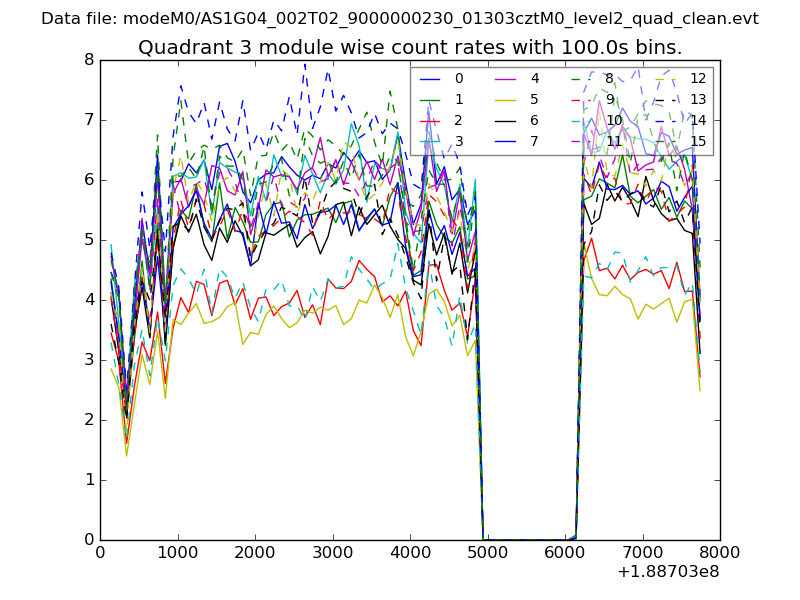
| Module-wise count rates for Quadrant C Data is divided into 100 sec bins |
 |
 |
| Module-wise count rates for Quadrant D Data is divided into 100 sec bins |
 |
 |
| Parameter | Plot |
|---|---|
| CZT HV Monitor | 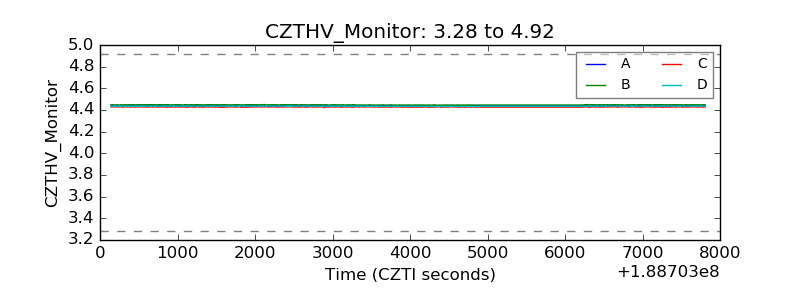 |
| D_VDD | 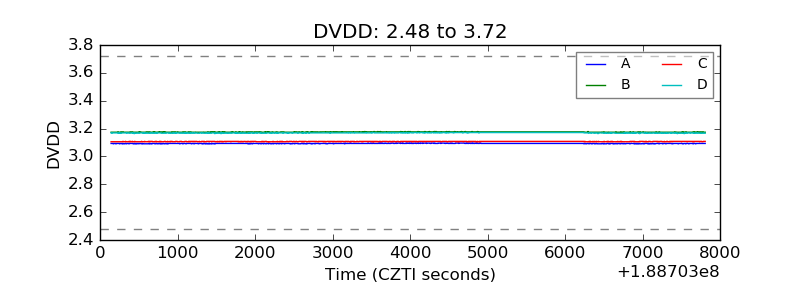 |
| Temperature 1 | 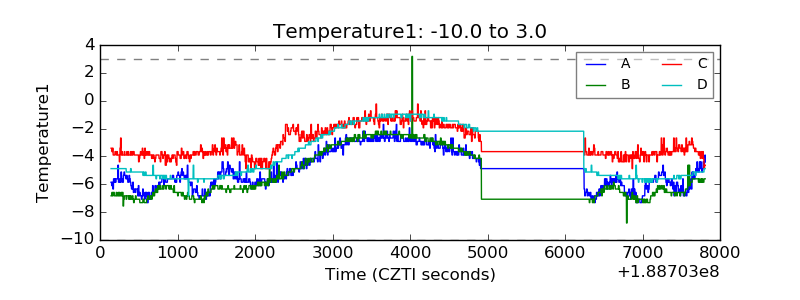 |
| Veto HV Monitor | 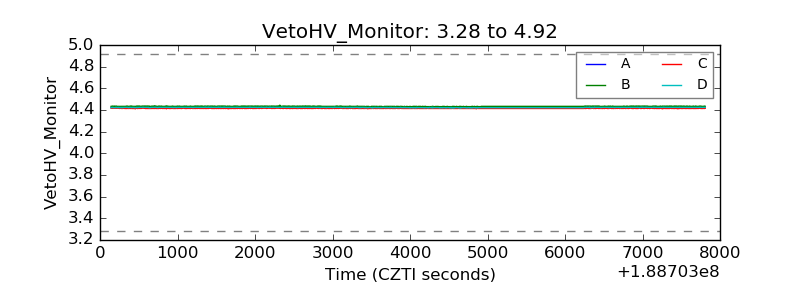 |
| Veto LLD | 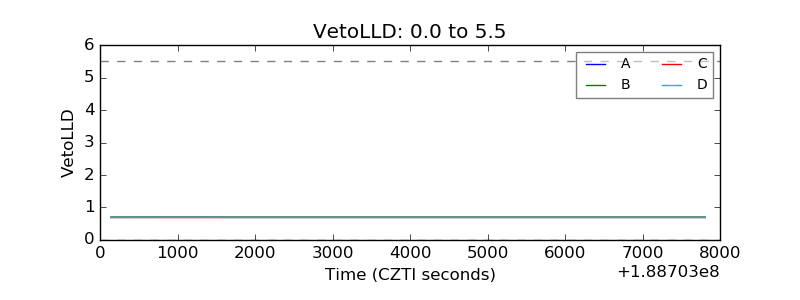 |
| Alpha Counter | 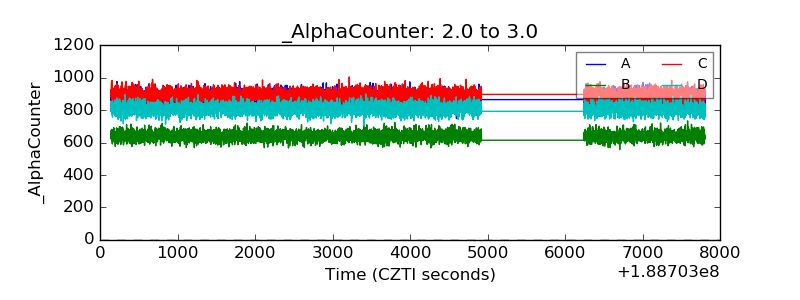 |
| _CPM_Rate | 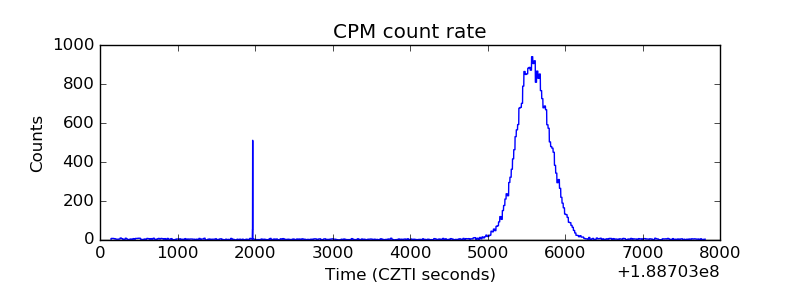 |
| CZT Counter | 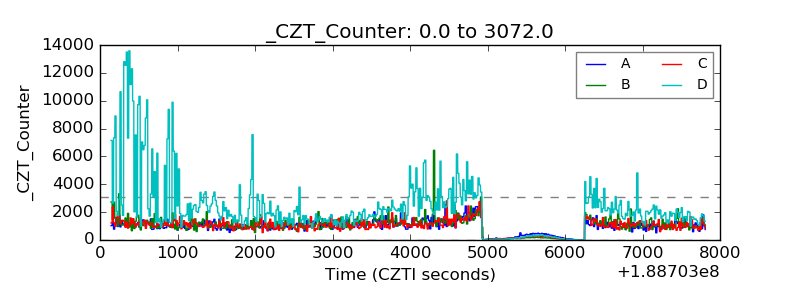 |
| +2.5 Volts monitor |  |
| +5 Volts monitor |  |
| _ROLL_ROT | 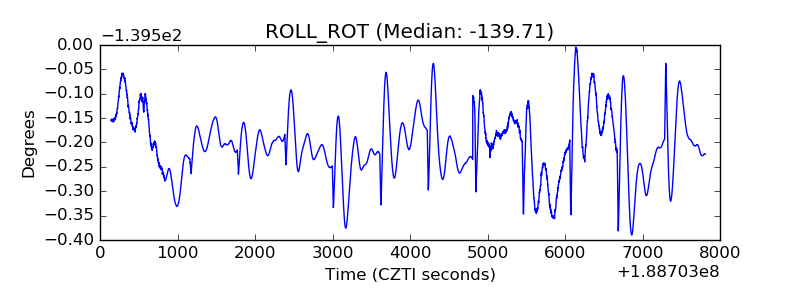 |
| _Roll_DEC | 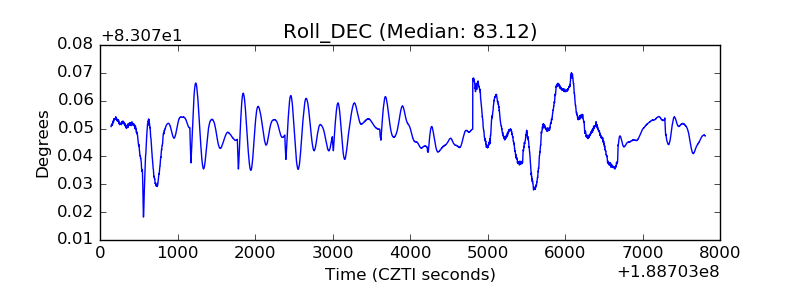 |
| _Roll_RA | 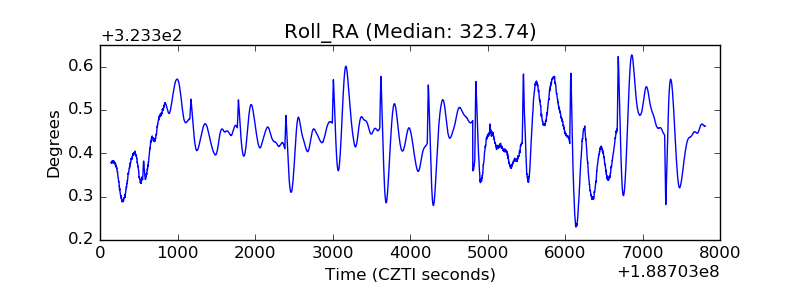 |
| Veto Counter | 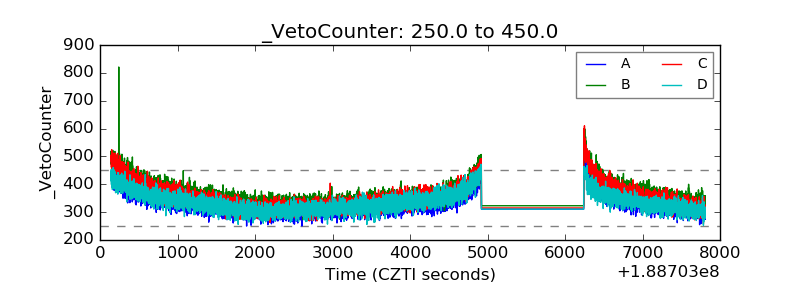 |