| Param | Original file | Final file |
|---|---|---|
| Filename | modeM0/AS1G04_002T02_9000000230_01304cztM0_level2.evt | modeM0/AS1G04_002T02_9000000230_01304cztM0_level2_quad_clean.evt |
| Size (bytes) | 1,136,033,280 | 89,009,280 |
| Size | 1.1 GB | 84.9 MB |
| Events in quadrant A | 7,020,704 | 586,823 |
| Events in quadrant B | 7,894,714 | 594,359 |
| Events in quadrant C | 6,843,975 | 574,866 |
| Events in quadrant D | 12,255,626 | 525,771 |
| Mode M9 | |||
|---|---|---|---|
| Quadrant | BADHDUFLAG | Total packets | Discarded packets |
| A | 0 | 11 | 0 |
| B | 0 | 11 | 0 |
| C | 0 | 11 | 0 |
| D | 0 | 11 | 0 |
| Mode M0 | |||
|---|---|---|---|
| Quadrant | BADHDUFLAG | Total packets | Discarded packets |
| A | 0 | 25050 | 2 |
| B | 0 | 27656 | 1 |
| C | 0 | 24562 | 1 |
| D | 0 | 40592 | 1 |
| Mode SS | |||
|---|---|---|---|
| Quadrant | BADHDUFLAG | Total packets | Discarded packets |
| A | 0 | 120 | 0 |
| B | 0 | 120 | 0 |
| C | 0 | 120 | 0 |
| D | 0 | 120 | 0 |
| Quadrant | Total seconds | Saturated seconds | Saturation percentage |
|---|---|---|---|
| A | 5917 | 29 | 0.490113% |
| B | 5917 | 57 | 0.963326% |
| C | 5917 | 20 | 0.338009% |
| D | 5917 | 556 | 9.396654% |
Noise dominated data is calculated using 1-second bins in cleaned event files. If a bin has >2000 counts, and if more than 50% of those come from <1% of pixels, then it is considered to be noise-dominated and hence unusable.
| Quadrant | # 1 sec bins | Bins with >0 counts | Bins with >2000 counts | High rate bins dominated by noise | Noise dominated (total time) | Noise dominated (detector-on time) | Marked lightcurve |
|---|---|---|---|---|---|---|---|
| A | 7042 | 5918 | 221 | 221 | 3.14% | 3.73% | 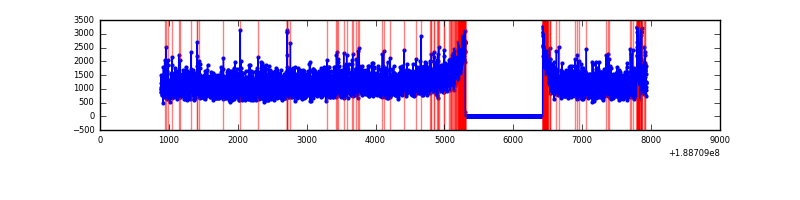 |
| B | 7042 | 5918 | 533 | 533 | 7.57% | 9.01% | 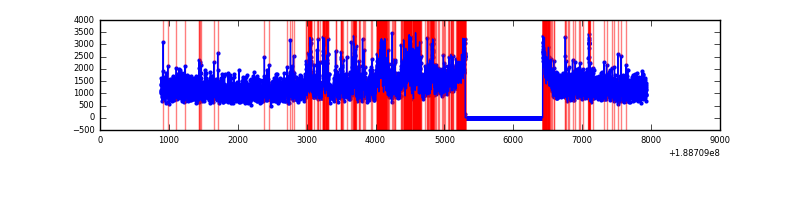 |
| C | 7042 | 5918 | 182 | 182 | 2.58% | 3.08% | 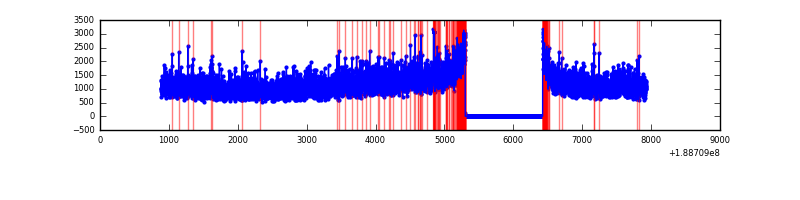 |
| D | 7042 | 5918 | 2945 | 2945 | 41.82% | 49.76% | 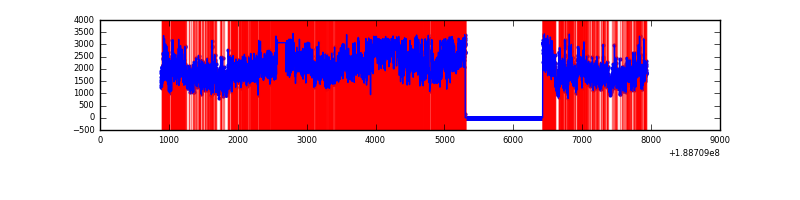 |
Top three noisy pixels from each quadrant. If the there are fewer than three noisy pixels in the level2.evt file, extra rows are filled as -1
| Pixel properties | Quadrant properties | ||||||
|---|---|---|---|---|---|---|---|
| Quadrant | DetID | PixID | Counts | Sigma | Mean | Median | Sigma |
| A | 4 | 32 | 104511 | 239.57 | 1786 | 1798 | 428.7 |
| A | 12 | 243 | 27492 | 59.93 | 1786 | 1798 | 428.7 |
| A | 15 | 127 | 16676 | 34.7 | 1786 | 1798 | 428.7 |
| B | 8 | 4 | 625155 | 1416.87 | 1856 | 1864 | 439.9 |
| B | 6 | 53 | 65909 | 145.59 | 1856 | 1864 | 439.9 |
| B | 15 | 22 | 62983 | 138.94 | 1856 | 1864 | 439.9 |
| C | 15 | 241 | 282585 | 616.84 | 1641 | 1694 | 455.4 |
| C | 12 | 4 | 44553 | 94.12 | 1641 | 1694 | 455.4 |
| C | 8 | 208 | 42638 | 89.91 | 1641 | 1694 | 455.4 |
| D | 13 | 169 | 5985437 | 13128.57 | 1583 | 1614 | 455.8 |
| D | 10 | 84 | 308575 | 673.47 | 1583 | 1614 | 455.8 |
| D | 12 | 22 | 20644 | 41.75 | 1583 | 1614 | 455.8 |
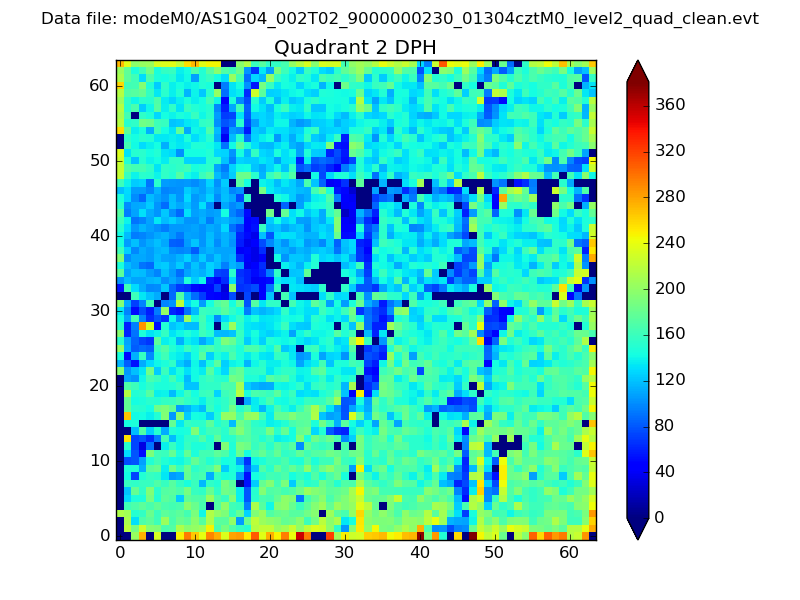
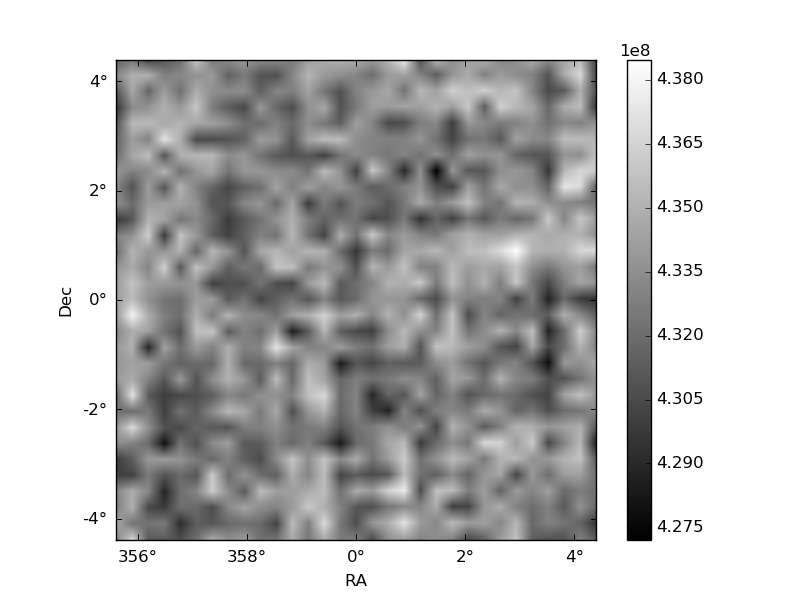
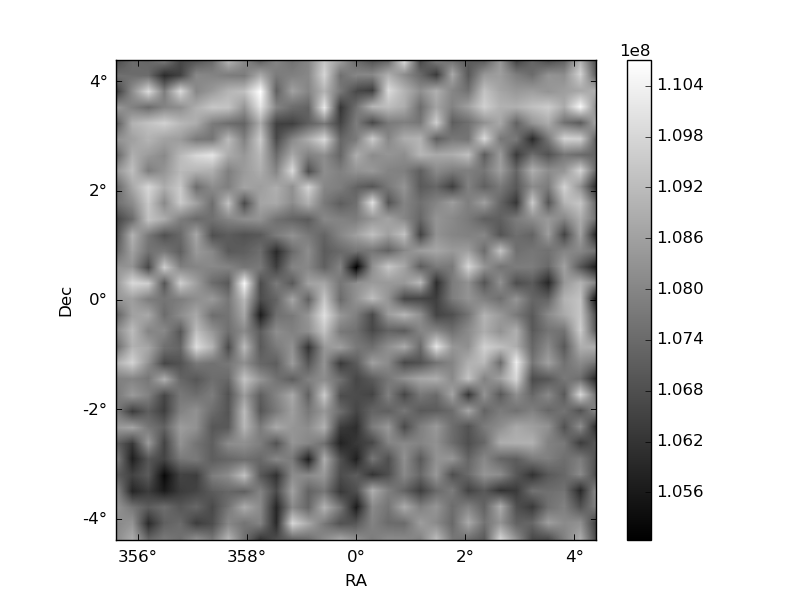
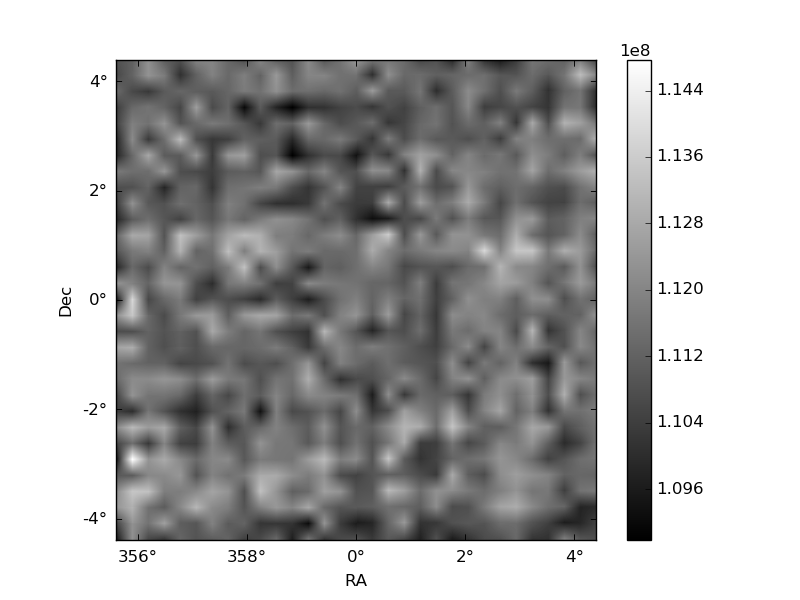
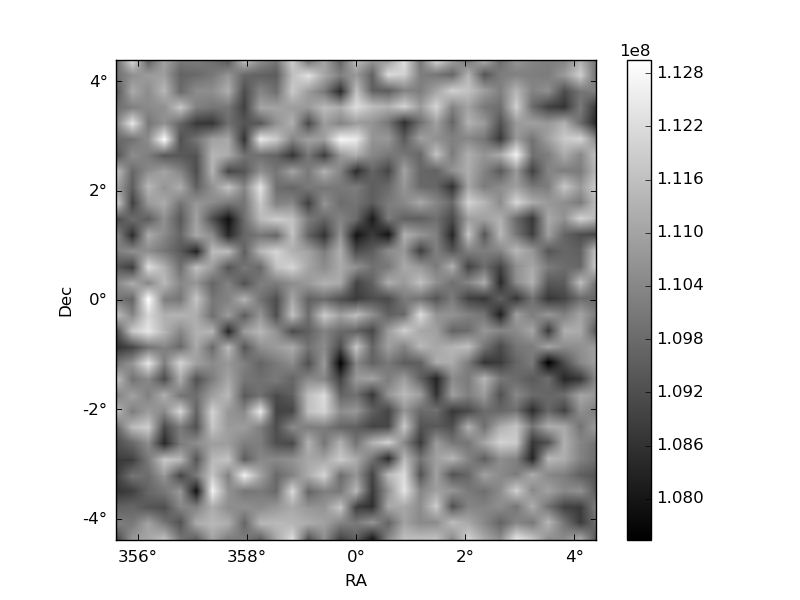
Histogram calculated using DETX and DETY for each event in the final _common_clean file
| Quadrant A | 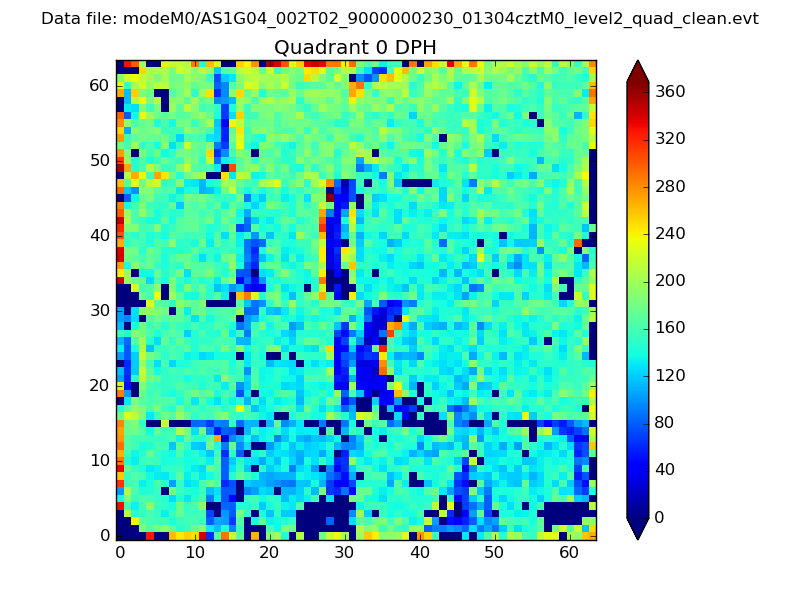 |
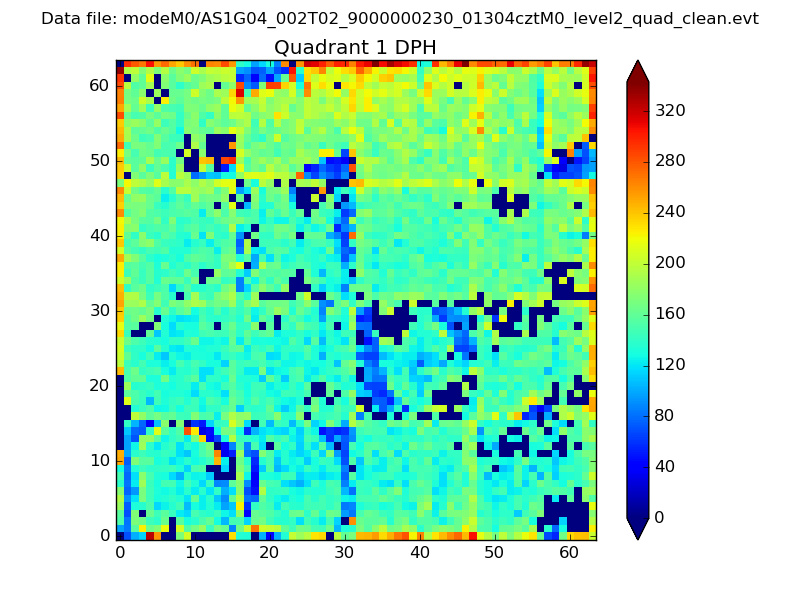 |
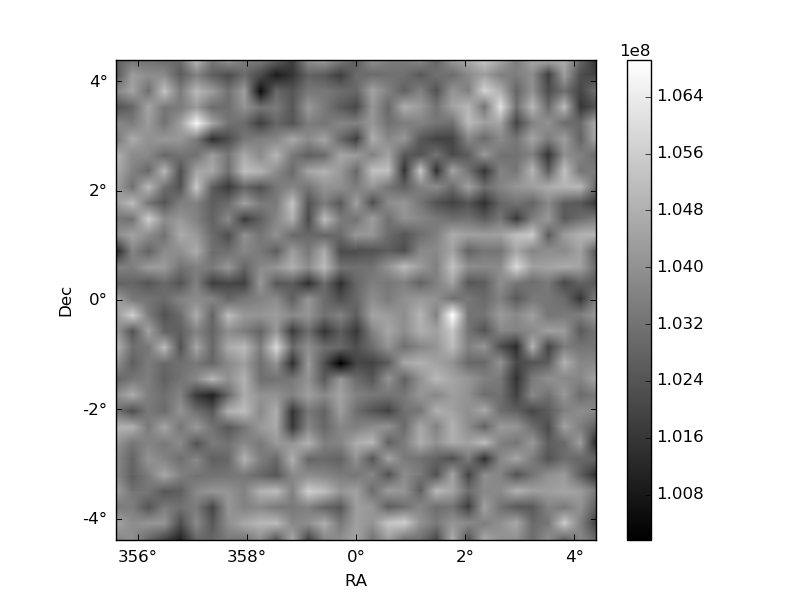
Quadrant B |
|---|---|---|---|
| Quadrant D | 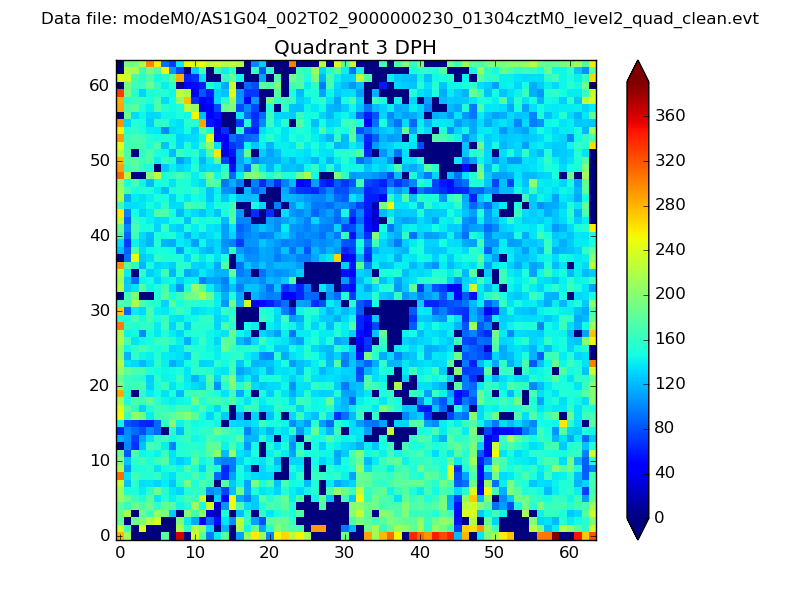 |
 |
Quadrant C |
| Plot type | Count rate plots | Images |
|---|---|---|
| Comparison with Poisson distribution Blue bars denote a histogram of data divided into 1 sec bins. Red curve is a Poisson curve with rate = median count rate of data. |
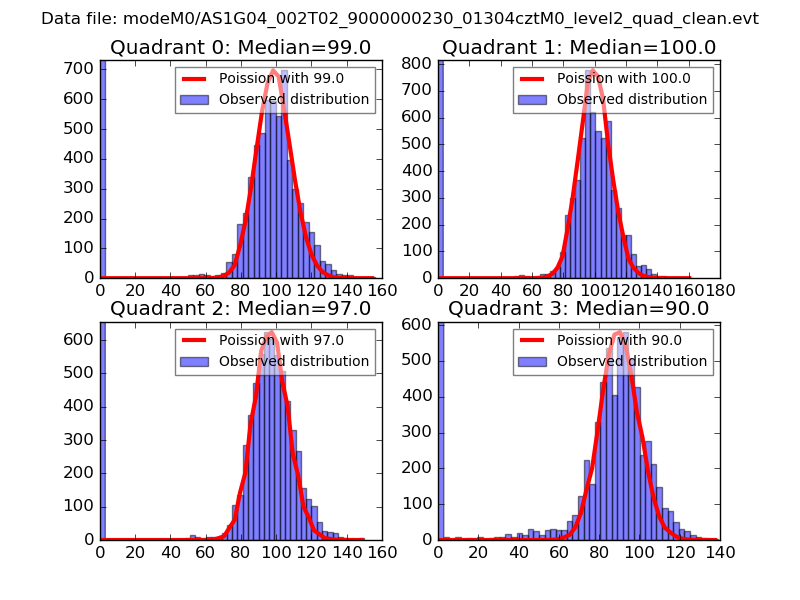 |
 |
| Quadrant-wise count rates Data is divided into 100 sec bins |
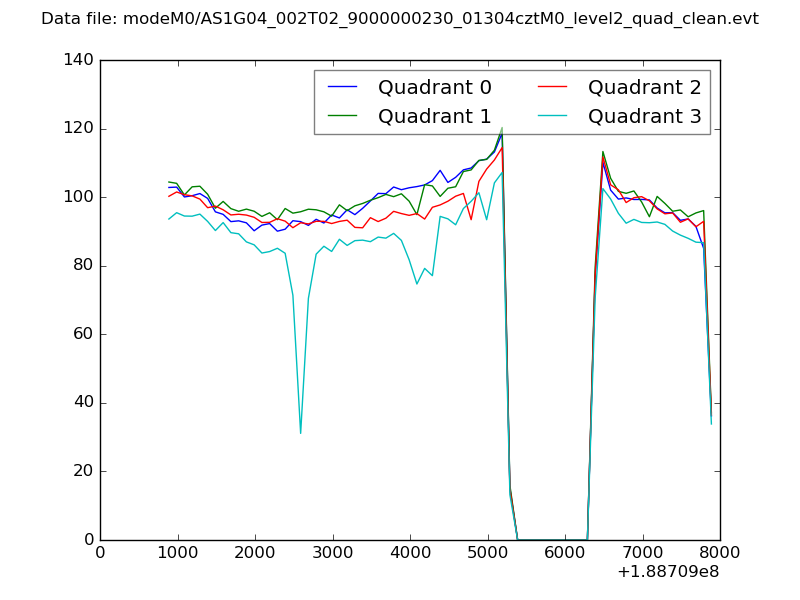 |
|
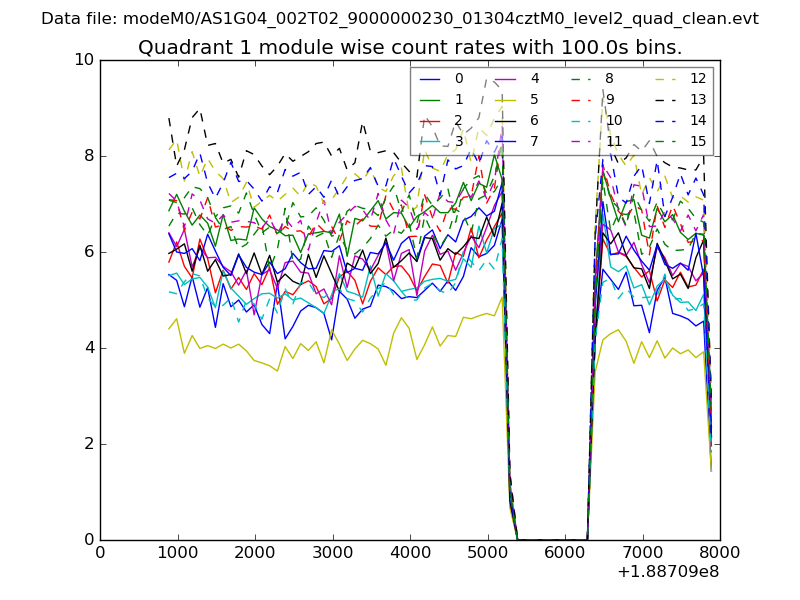
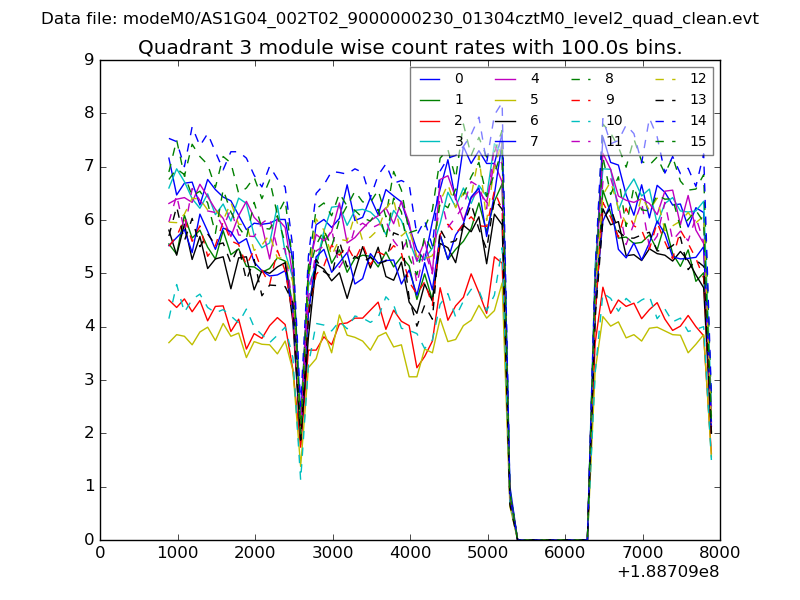
| Module-wise count rates for Quadrant A Data is divided into 100 sec bins |
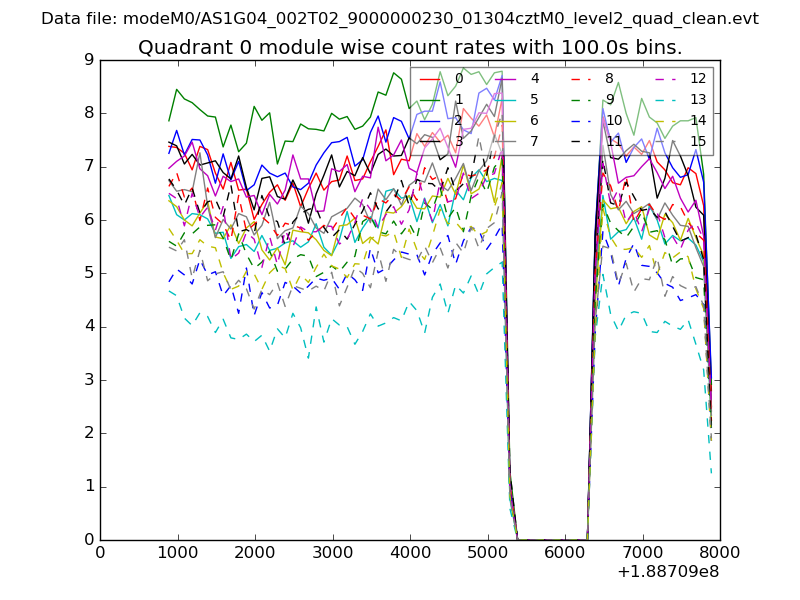 |
 |
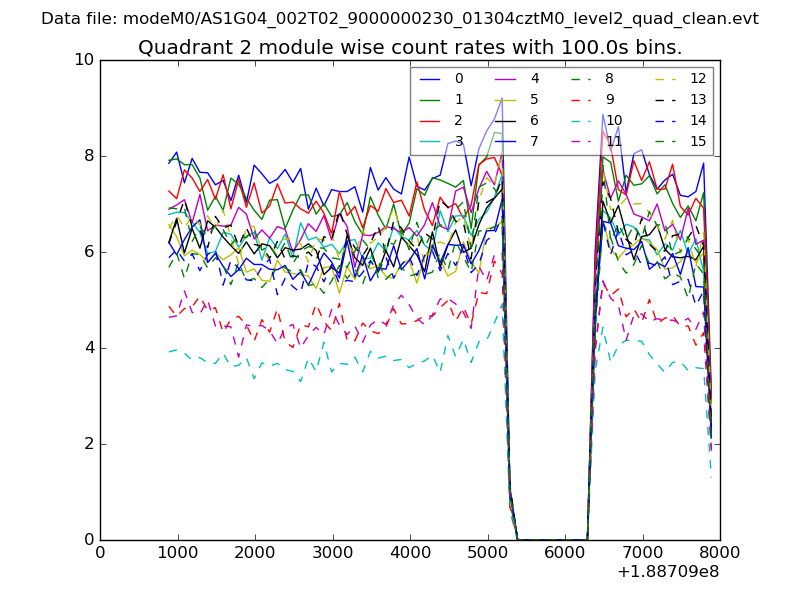
| Module-wise count rates for Quadrant B Data is divided into 100 sec bins |
 |
 |
| Module-wise count rates for Quadrant C Data is divided into 100 sec bins |
 |
 |
| Module-wise count rates for Quadrant D Data is divided into 100 sec bins |
 |
 |
| Parameter | Plot |
|---|---|
| CZT HV Monitor | 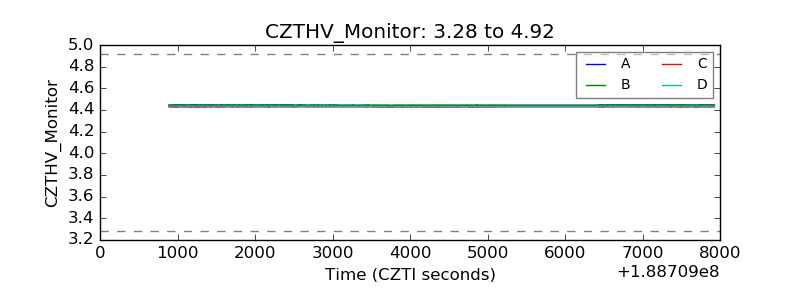 |
| D_VDD | 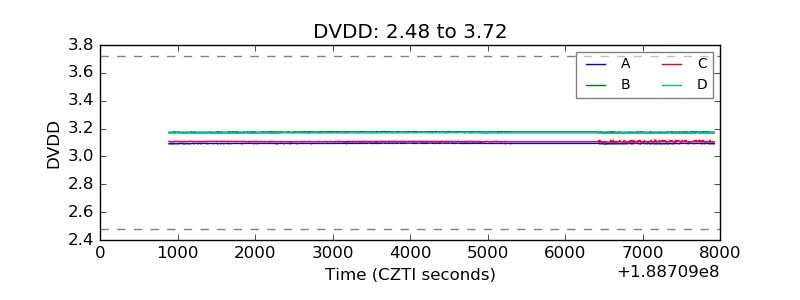 |
| Temperature 1 | 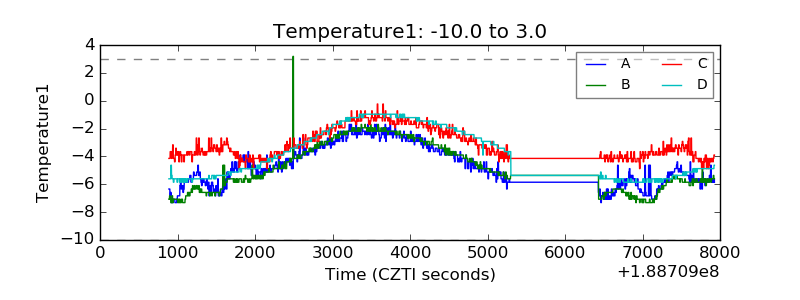 |
| Veto HV Monitor | 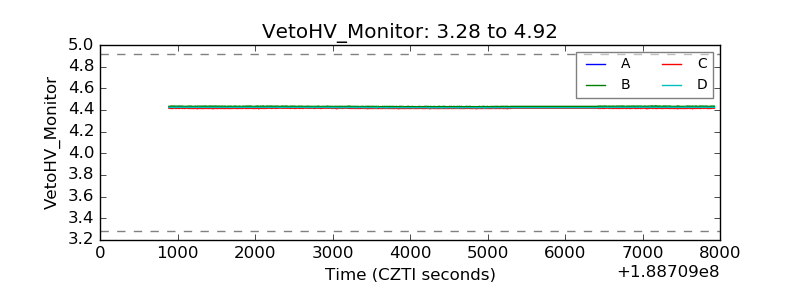 |
| Veto LLD | 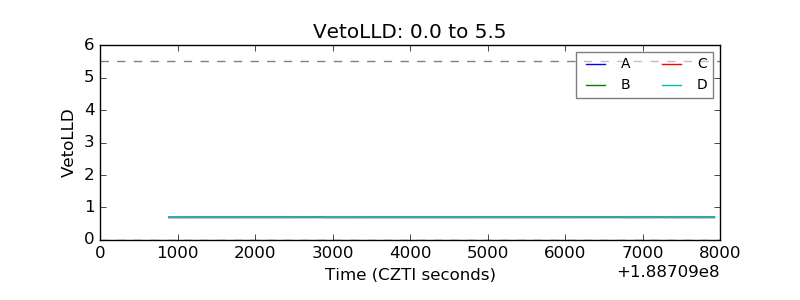 |
| Alpha Counter | 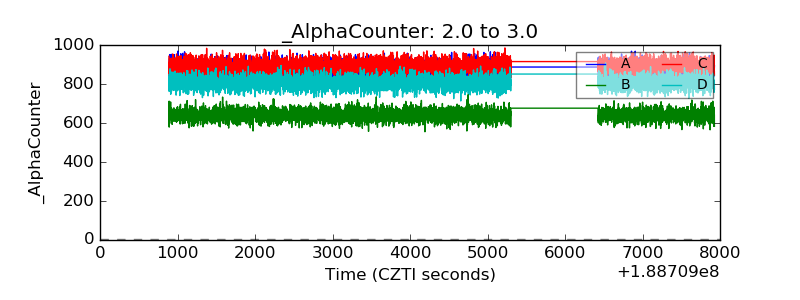 |
| _CPM_Rate | 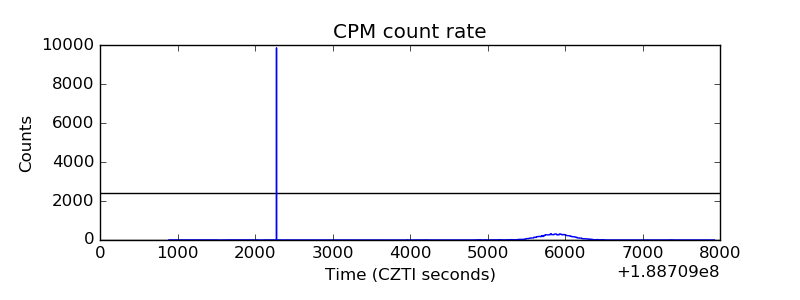 |
| CZT Counter | 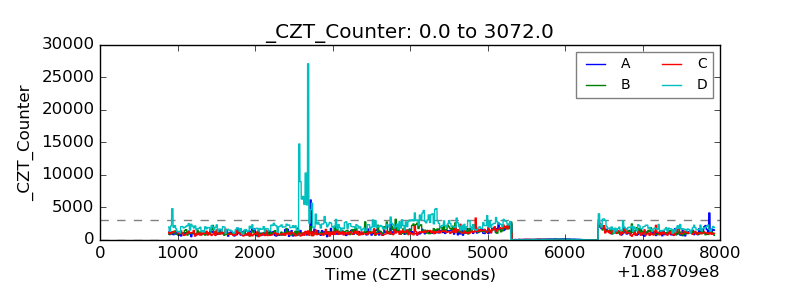 |
| +2.5 Volts monitor | 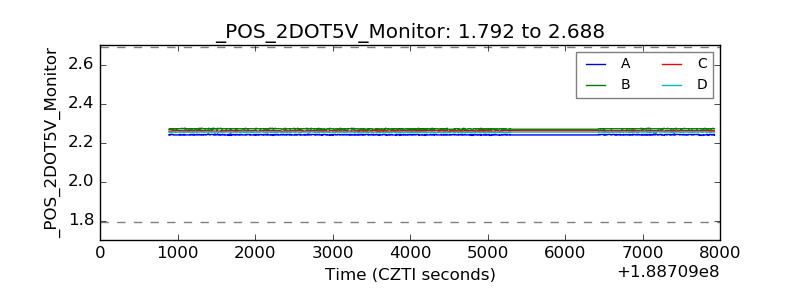 |
| +5 Volts monitor | 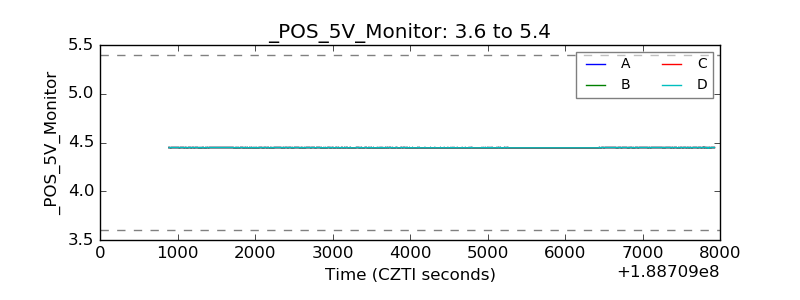 |
| _ROLL_ROT | 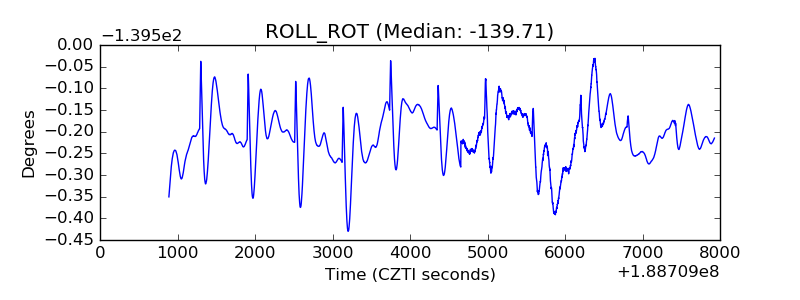 |
| _Roll_DEC | 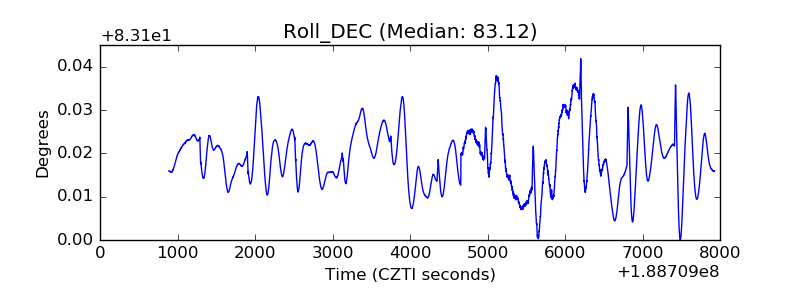 |
| _Roll_RA | 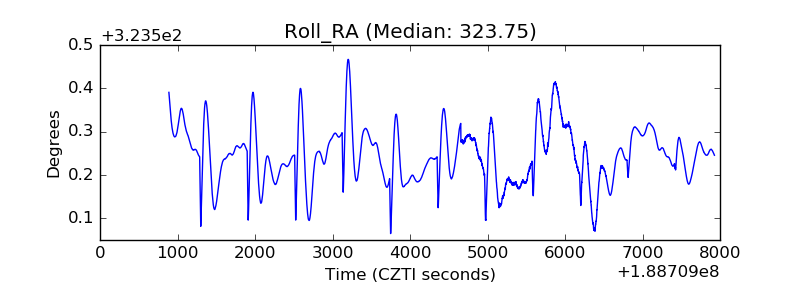 |
| Veto Counter | 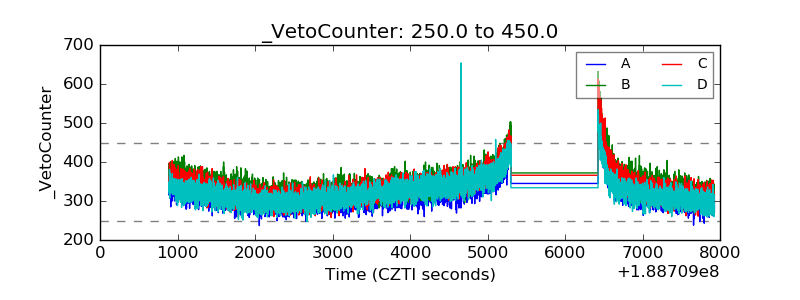 |