| Param | Original file | Final file |
|---|---|---|
| Filename | modeM0/AS1G04_002T02_9000000230_01305cztM0_level2.evt | modeM0/AS1G04_002T02_9000000230_01305cztM0_level2_quad_clean.evt |
| Size (bytes) | 1,187,398,080 | 88,372,800 |
| Size | 1.1 GB | 84.3 MB |
| Events in quadrant A | 9,165,314 | 568,819 |
| Events in quadrant B | 7,659,507 | 590,911 |
| Events in quadrant C | 7,037,721 | 573,254 |
| Events in quadrant D | 11,704,387 | 525,304 |
| Mode M9 | |||
|---|---|---|---|
| Quadrant | BADHDUFLAG | Total packets | Discarded packets |
| A | 0 | 8 | 0 |
| B | 0 | 8 | 0 |
| C | 0 | 8 | 0 |
| D | 0 | 8 | 0 |
| Mode M0 | |||
|---|---|---|---|
| Quadrant | BADHDUFLAG | Total packets | Discarded packets |
| A | 0 | 31527 | 2 |
| B | 0 | 26980 | 1 |
| C | 0 | 25124 | 1 |
| D | 0 | 39055 | 1 |
| Mode SS | |||
|---|---|---|---|
| Quadrant | BADHDUFLAG | Total packets | Discarded packets |
| A | 0 | 124 | 0 |
| B | 0 | 124 | 0 |
| C | 0 | 124 | 0 |
| D | 0 | 124 | 0 |
| Quadrant | Total seconds | Saturated seconds | Saturation percentage |
|---|---|---|---|
| A | 5975 | 353 | 5.907950% |
| B | 5975 | 30 | 0.502092% |
| C | 5975 | 6 | 0.100418% |
| D | 5975 | 804 | 13.456067% |
Noise dominated data is calculated using 1-second bins in cleaned event files. If a bin has >2000 counts, and if more than 50% of those come from <1% of pixels, then it is considered to be noise-dominated and hence unusable.
| Quadrant | # 1 sec bins | Bins with >0 counts | Bins with >2000 counts | High rate bins dominated by noise | Noise dominated (total time) | Noise dominated (detector-on time) | Marked lightcurve |
|---|---|---|---|---|---|---|---|
| A | 6750 | 5976 | 1150 | 1150 | 17.04% | 19.24% | 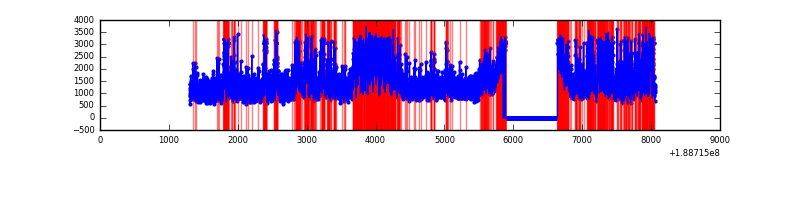 |
| B | 6750 | 5976 | 327 | 327 | 4.84% | 5.47% | 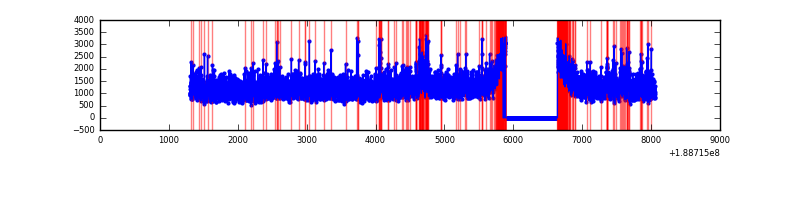 |
| C | 6750 | 5977 | 194 | 194 | 2.87% | 3.25% | 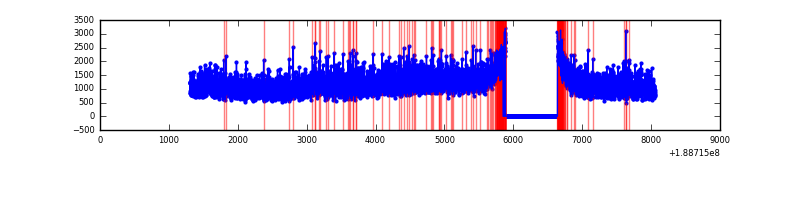 |
| D | 6750 | 5975 | 2680 | 2680 | 39.70% | 44.85% | 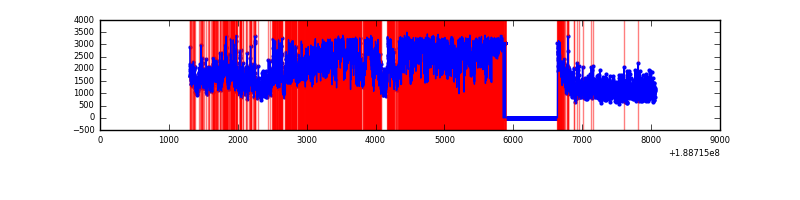 |
Top three noisy pixels from each quadrant. If the there are fewer than three noisy pixels in the level2.evt file, extra rows are filled as -1
| Pixel properties | Quadrant properties | ||||||
|---|---|---|---|---|---|---|---|
| Quadrant | DetID | PixID | Counts | Sigma | Mean | Median | Sigma |
| A | 4 | 32 | 2280901 | 5269.57 | 1788 | 1800 | 432.5 |
| A | 15 | 127 | 15596 | 31.9 | 1788 | 1800 | 432.5 |
| A | 13 | 9 | 9512 | 17.83 | 1788 | 1800 | 432.5 |
| B | 8 | 4 | 232576 | 512.17 | 1888 | 1892 | 450.4 |
| B | 12 | 52 | 82709 | 179.43 | 1888 | 1892 | 450.4 |
| B | 15 | 22 | 61757 | 132.91 | 1888 | 1892 | 450.4 |
| C | 15 | 241 | 290241 | 615.16 | 1689 | 1740 | 469.0 |
| C | 8 | 208 | 73878 | 153.82 | 1689 | 1740 | 469.0 |
| C | 3 | 79 | 28302 | 56.64 | 1689 | 1740 | 469.0 |
| D | 13 | 169 | 5425194 | 10865.37 | 1606 | 1666 | 499.2 |
| D | 10 | 84 | 161240 | 319.69 | 1606 | 1666 | 499.2 |
| D | 12 | 22 | 36721 | 70.23 | 1606 | 1666 | 499.2 |
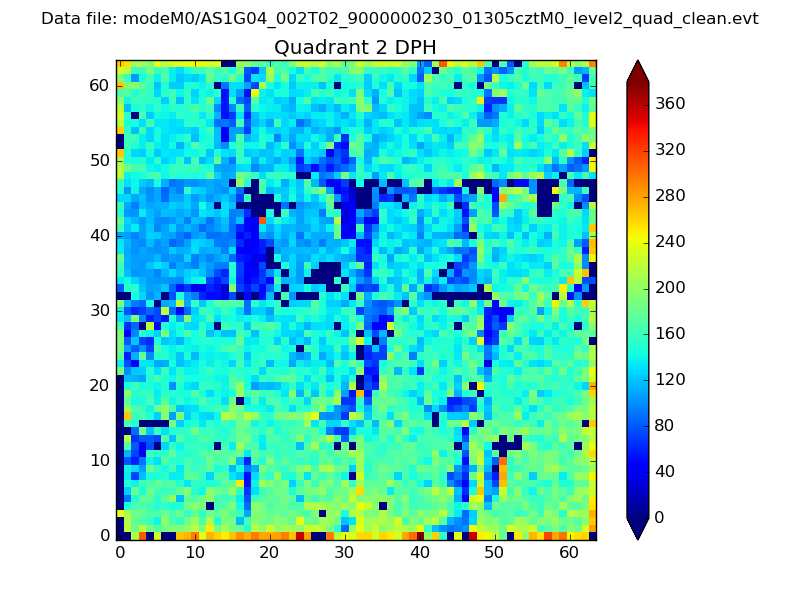
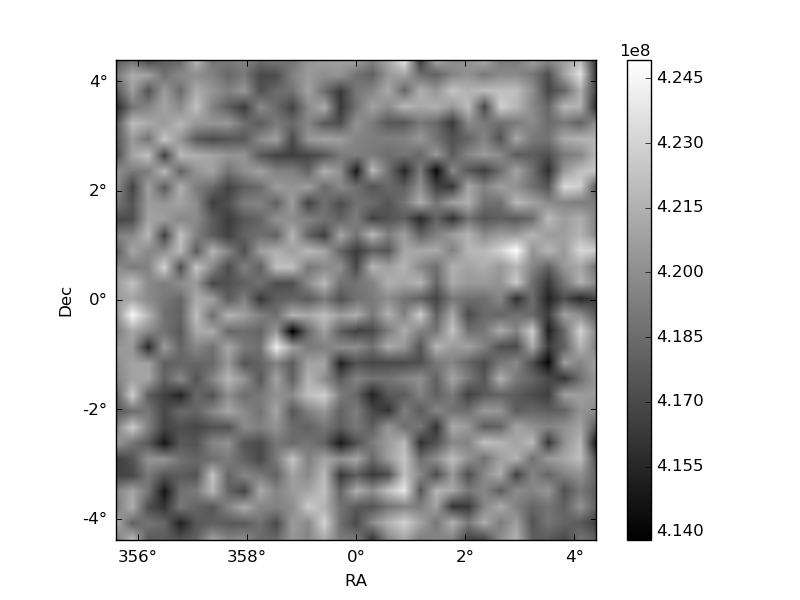
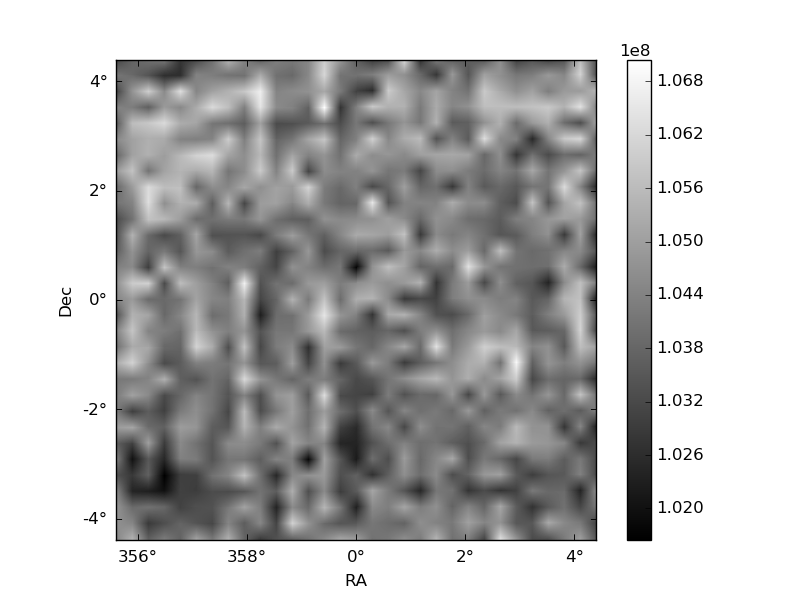
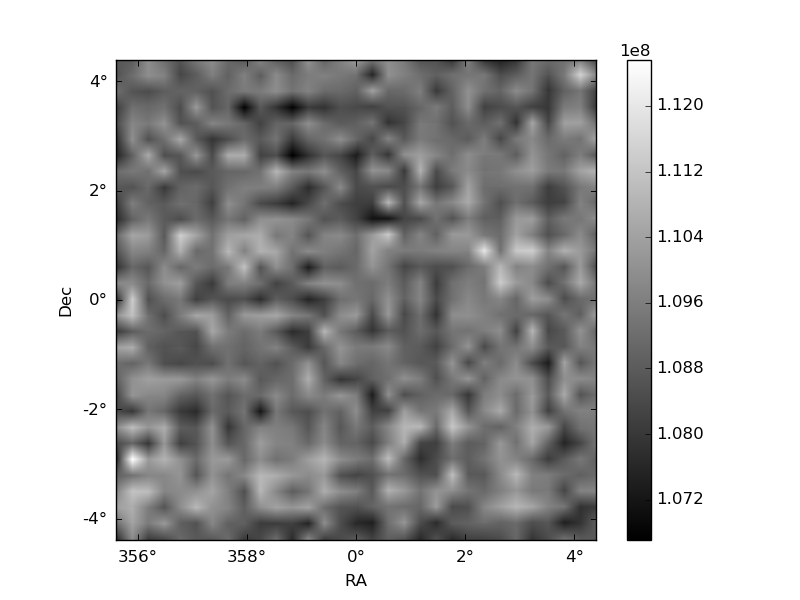
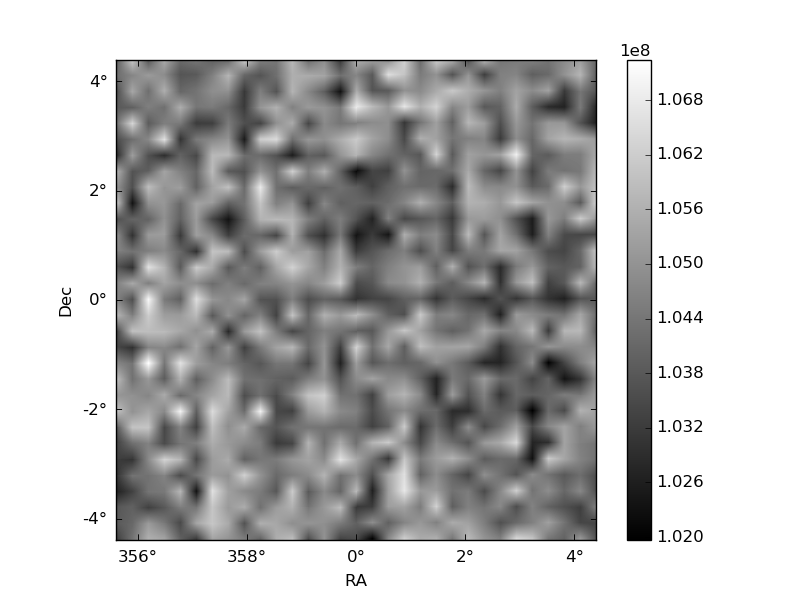
Histogram calculated using DETX and DETY for each event in the final _common_clean file
| Quadrant A | 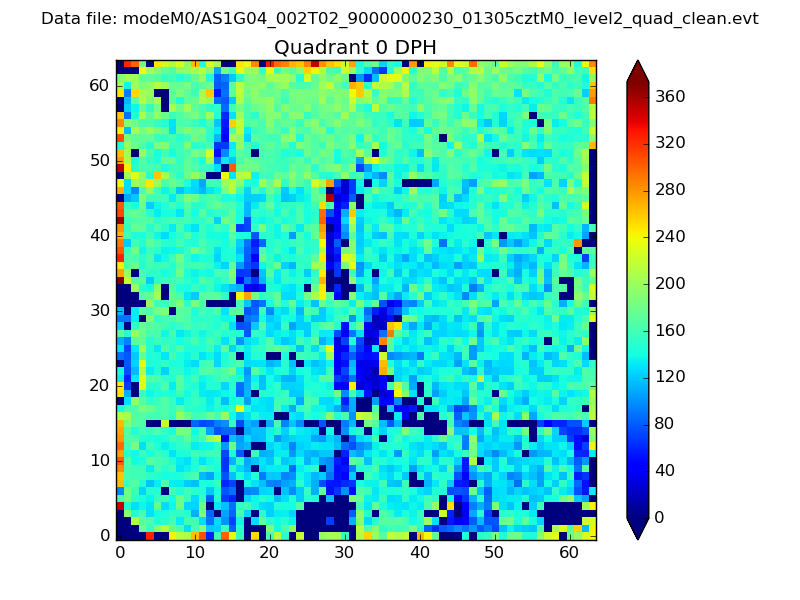 |
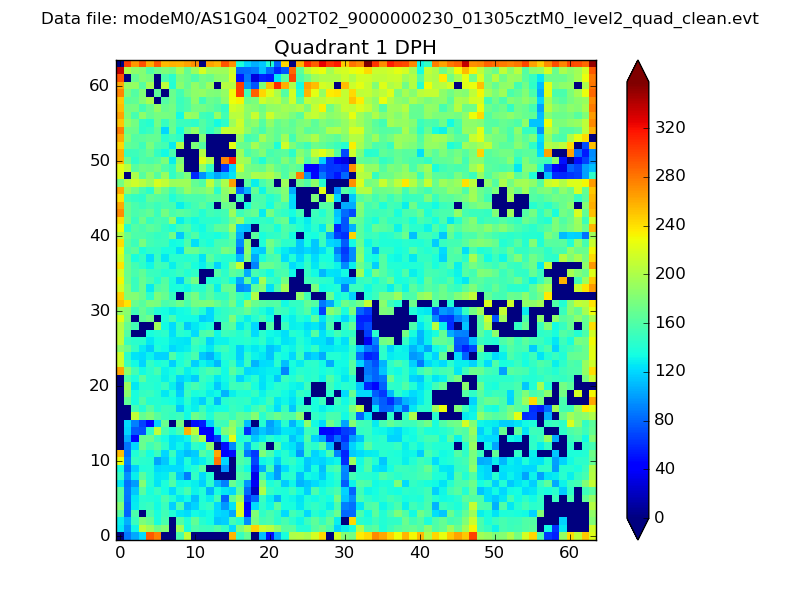 |
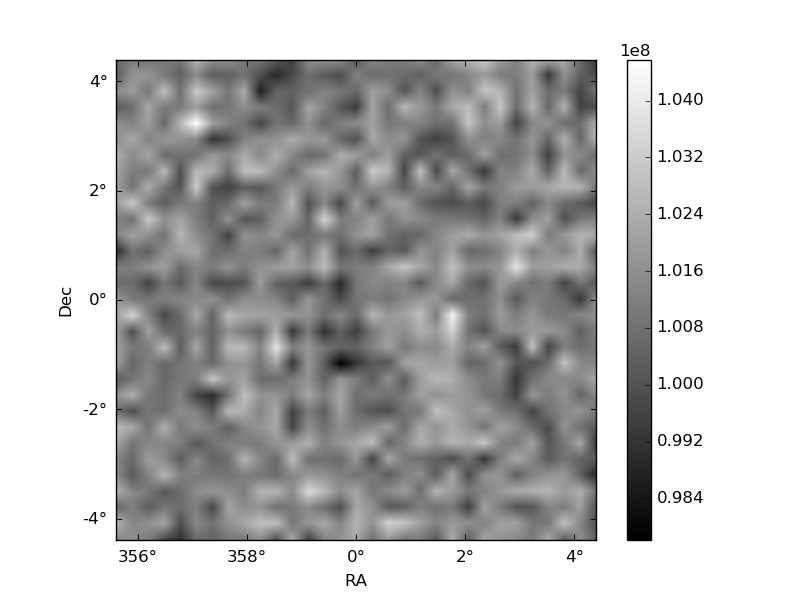
Quadrant B |
|---|---|---|---|
| Quadrant D | 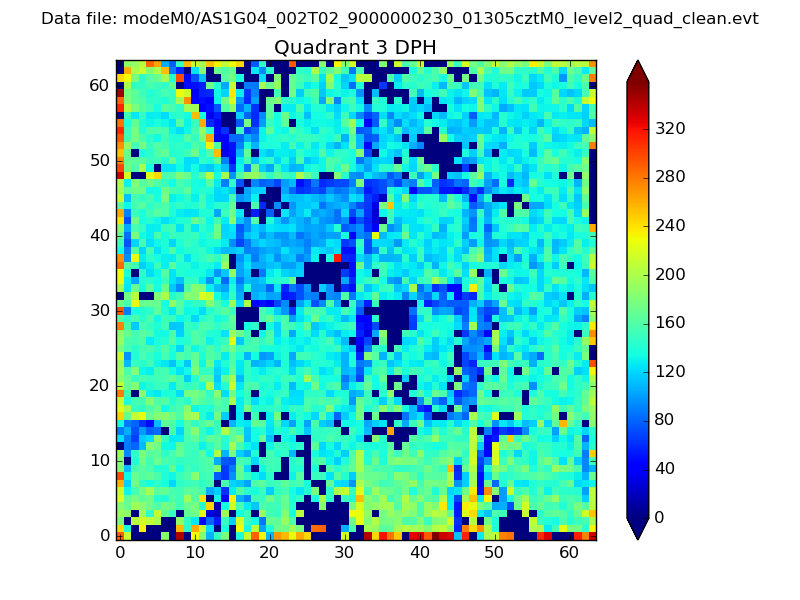 |
 |
Quadrant C |
| Plot type | Count rate plots | Images |
|---|---|---|
| Comparison with Poisson distribution Blue bars denote a histogram of data divided into 1 sec bins. Red curve is a Poisson curve with rate = median count rate of data. |
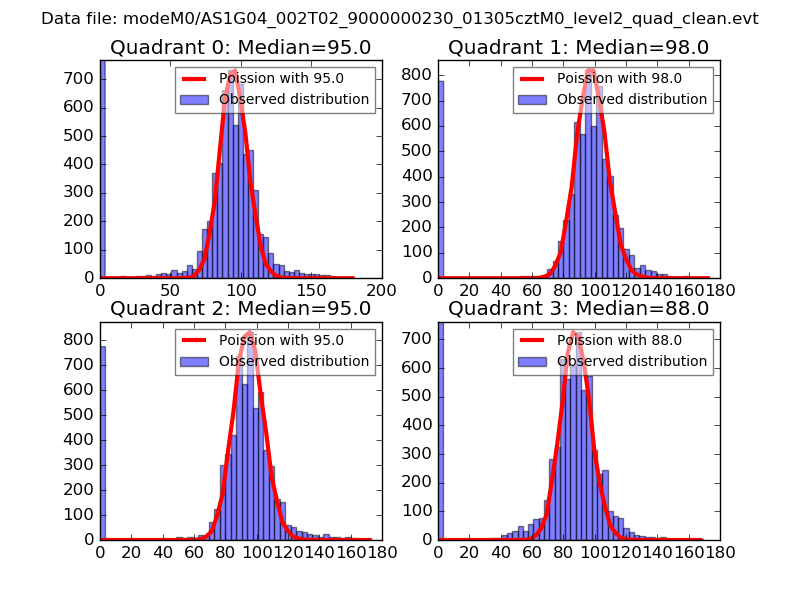 |
 |
| Quadrant-wise count rates Data is divided into 100 sec bins |
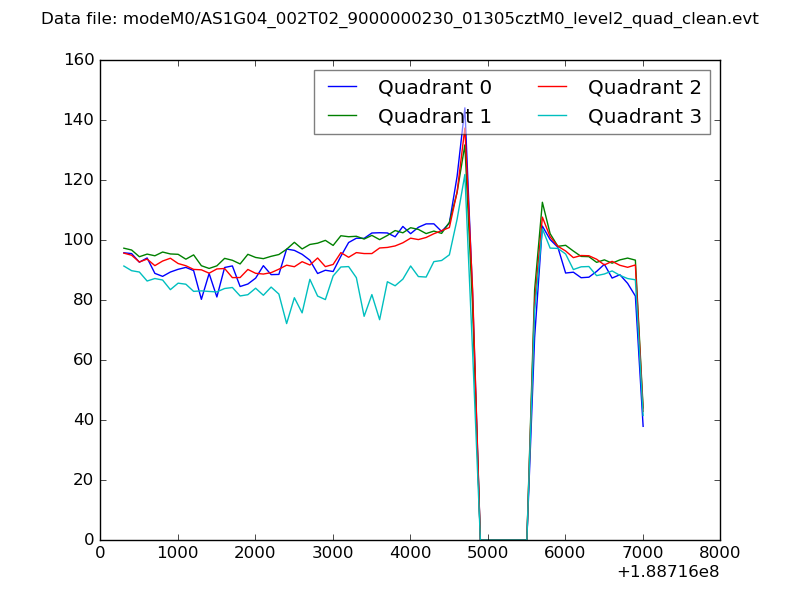 |
|
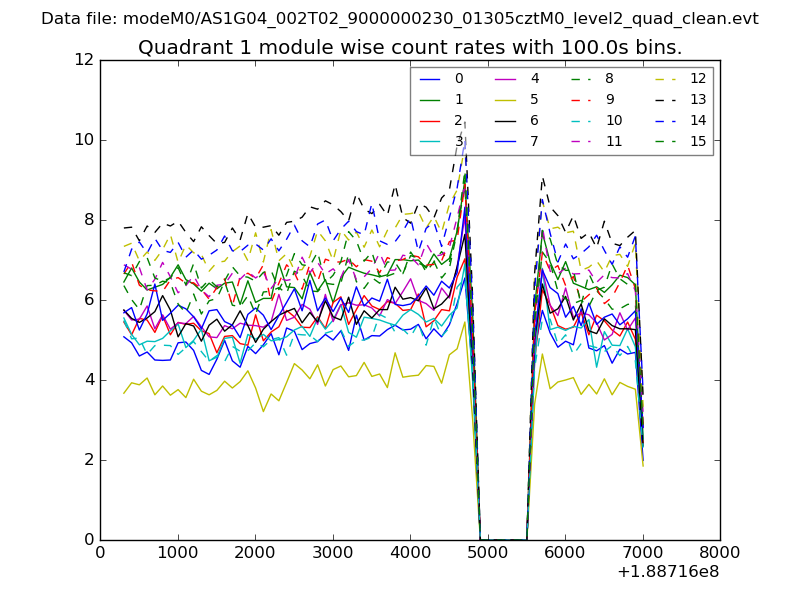
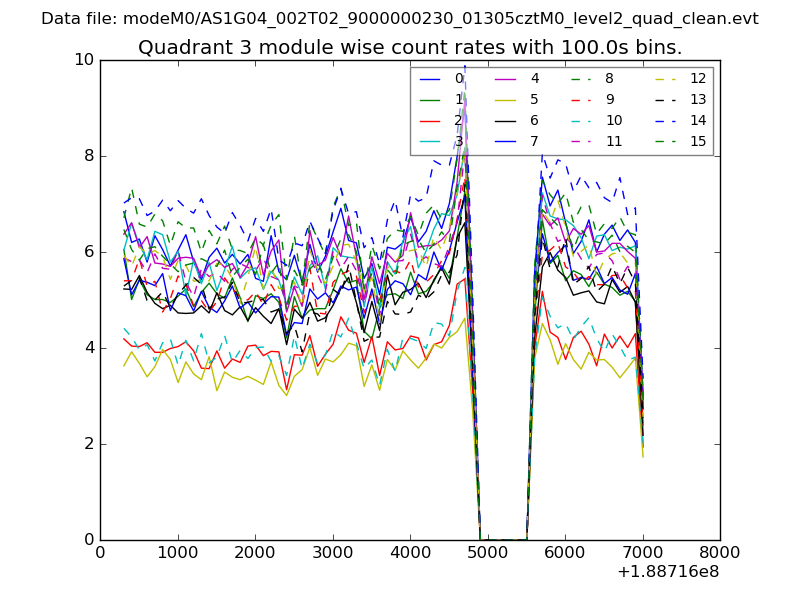
| Module-wise count rates for Quadrant A Data is divided into 100 sec bins |
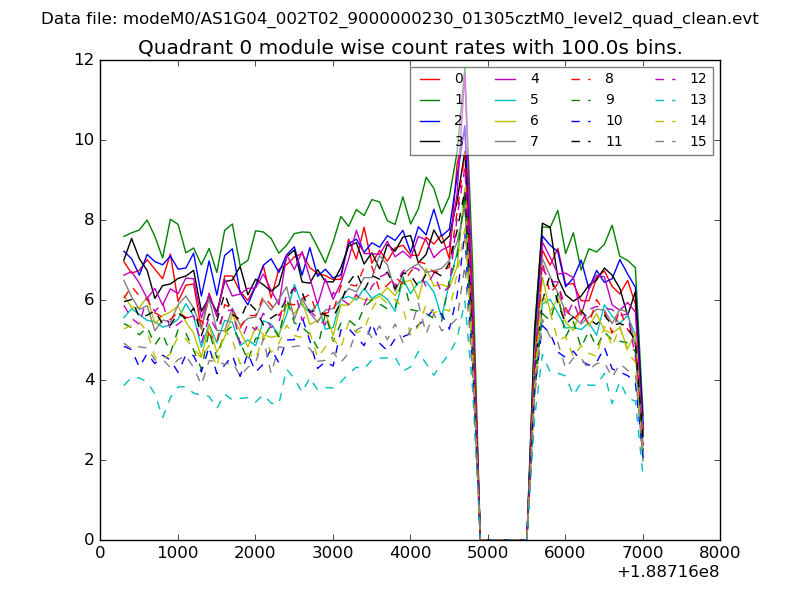 |
 |
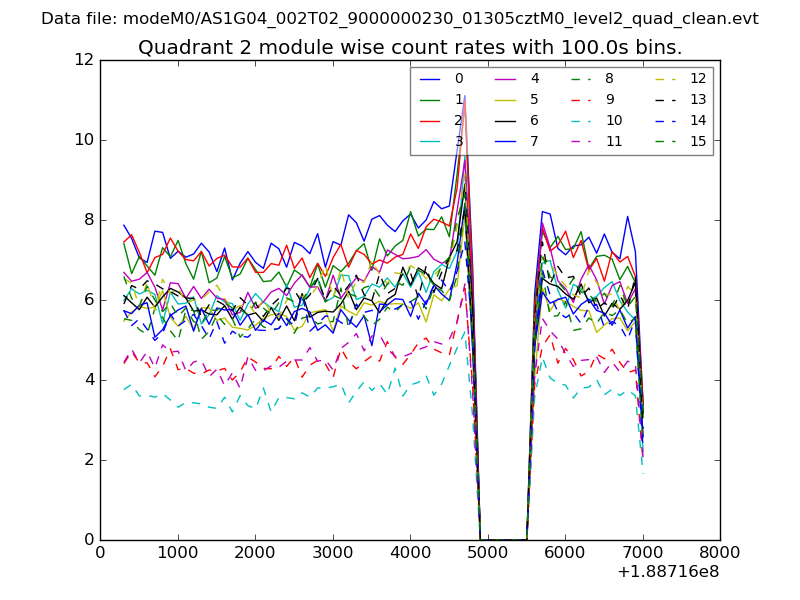
| Module-wise count rates for Quadrant B Data is divided into 100 sec bins |
 |
 |
| Module-wise count rates for Quadrant C Data is divided into 100 sec bins |
 |
 |
| Module-wise count rates for Quadrant D Data is divided into 100 sec bins |
 |
 |
| Parameter | Plot |
|---|---|
| CZT HV Monitor | 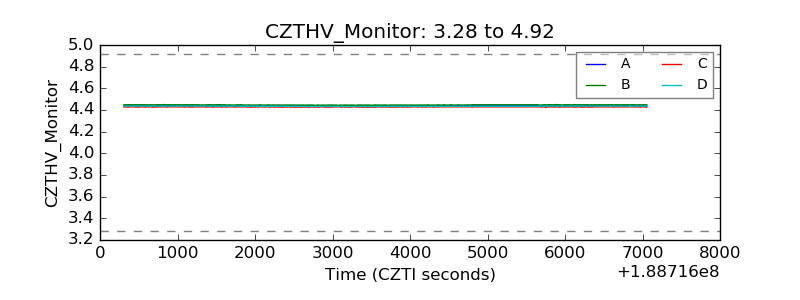 |
| D_VDD | 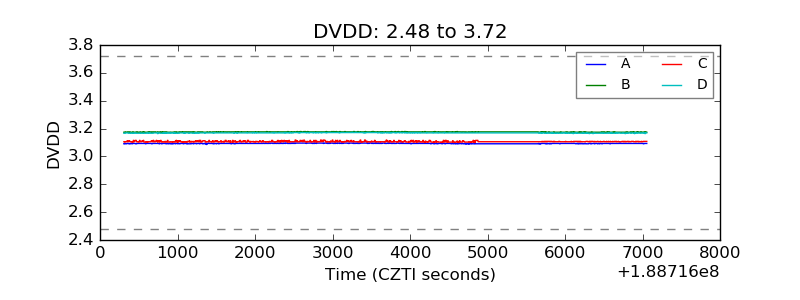 |
| Temperature 1 | 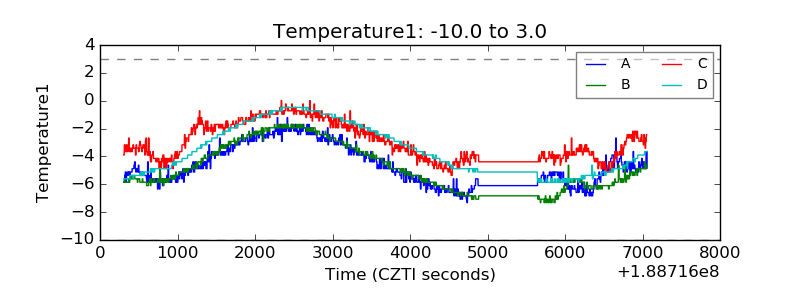 |
| Veto HV Monitor | 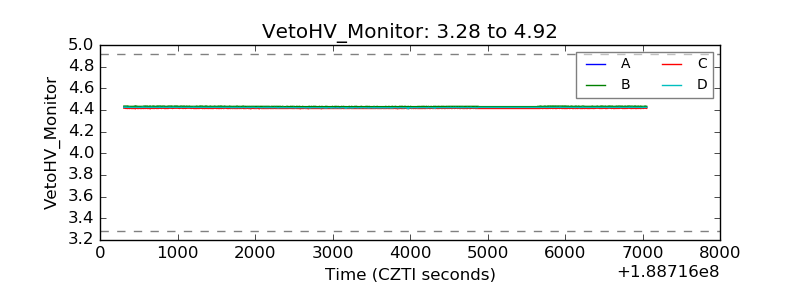 |
| Veto LLD | 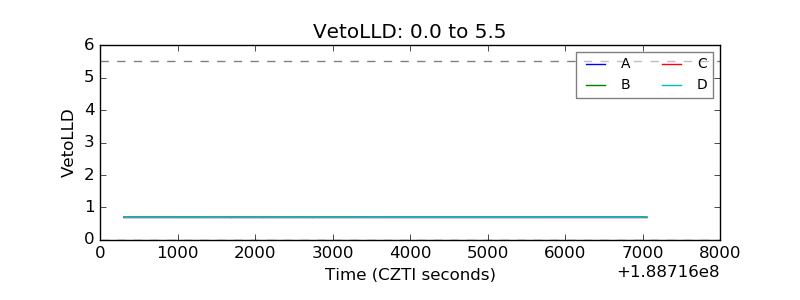 |
| Alpha Counter | 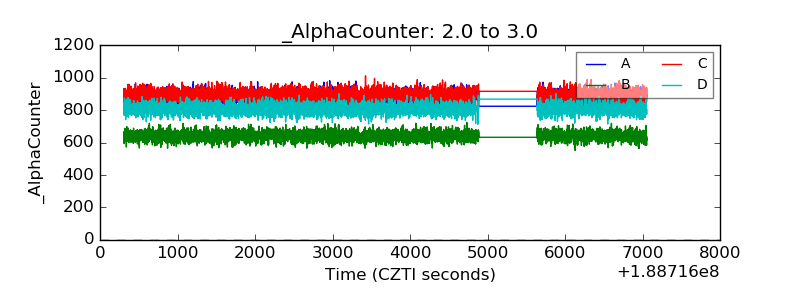 |
| _CPM_Rate | 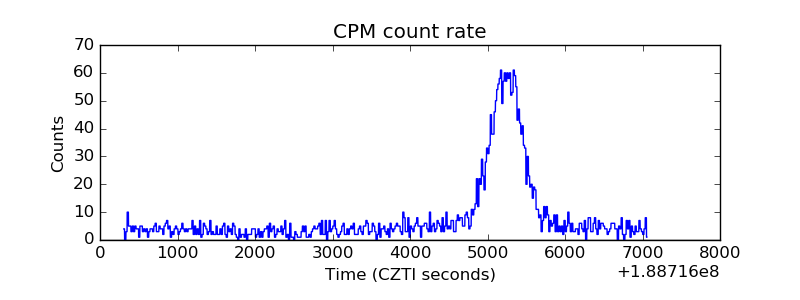 |
| CZT Counter | 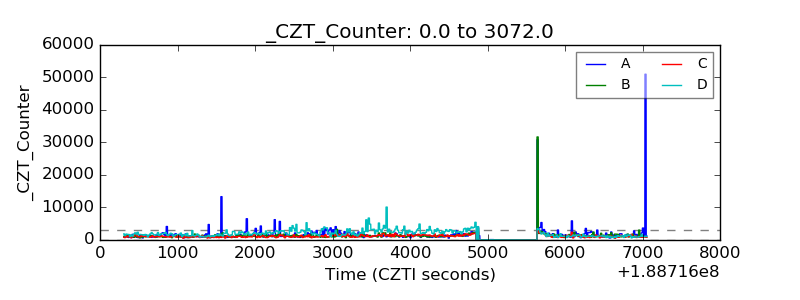 |
| +2.5 Volts monitor | 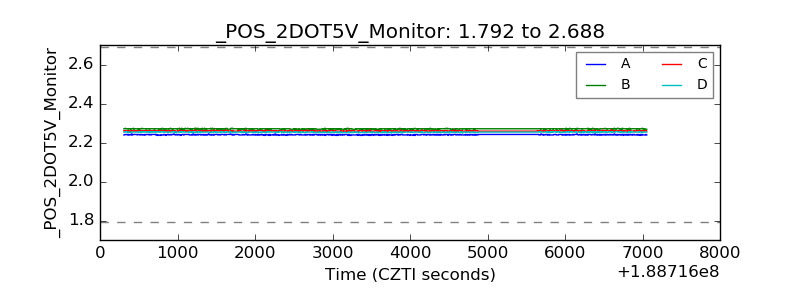 |
| +5 Volts monitor |  |
| _ROLL_ROT | 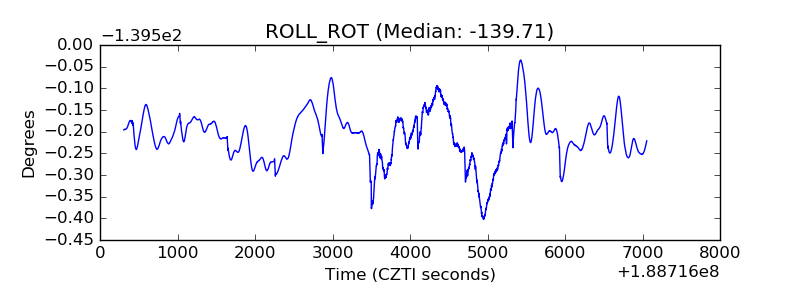 |
| _Roll_DEC | 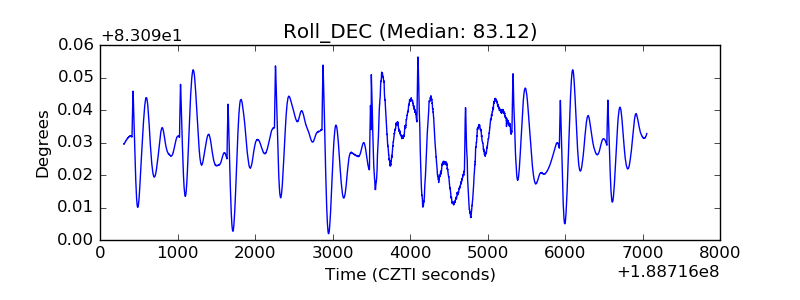 |
| _Roll_RA | 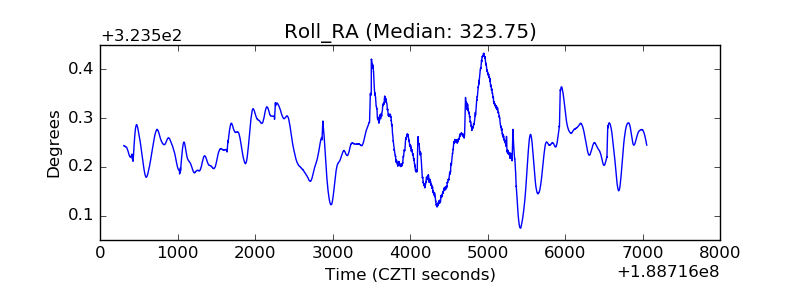 |
| Veto Counter | 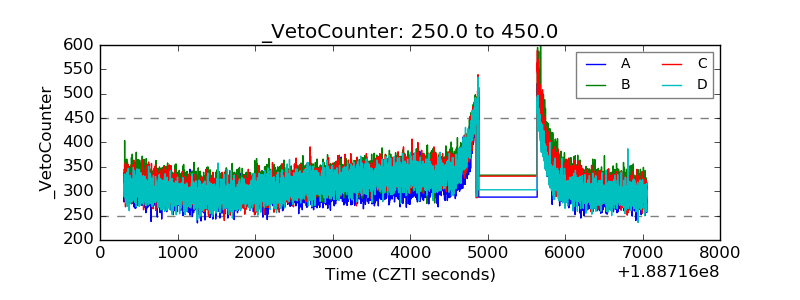 |