| Param | Original file | Final file |
|---|---|---|
| Filename | modeM0/AS1G04_002T02_9000000230_01306cztM0_level2.evt | modeM0/AS1G04_002T02_9000000230_01306cztM0_level2_quad_clean.evt |
| Size (bytes) | 1,481,503,680 | 108,766,080 |
| Size | 1.4 GB | 103.7 MB |
| Events in quadrant A | 12,119,170 | 685,179 |
| Events in quadrant B | 10,035,887 | 728,064 |
| Events in quadrant C | 8,983,066 | 710,306 |
| Events in quadrant D | 13,240,589 | 652,369 |
| Mode M9 | |||
|---|---|---|---|
| Quadrant | BADHDUFLAG | Total packets | Discarded packets |
| A | 0 | 2 | 0 |
| B | 0 | 2 | 0 |
| C | 0 | 2 | 0 |
| D | 0 | 2 | 0 |
| Mode M0 | |||
|---|---|---|---|
| Quadrant | BADHDUFLAG | Total packets | Discarded packets |
| A | 0 | 41363 | 2 |
| B | 0 | 35058 | 1 |
| C | 0 | 32024 | 1 |
| D | 0 | 44686 | 1 |
| Mode SS | |||
|---|---|---|---|
| Quadrant | BADHDUFLAG | Total packets | Discarded packets |
| A | 0 | 150 | 0 |
| B | 0 | 150 | 0 |
| C | 0 | 150 | 0 |
| D | 0 | 150 | 0 |
| Quadrant | Total seconds | Saturated seconds | Saturation percentage |
|---|---|---|---|
| A | 7443 | 792 | 10.640871% |
| B | 7443 | 80 | 1.074835% |
| C | 7443 | 31 | 0.416499% |
| D | 7443 | 962 | 12.924896% |
Noise dominated data is calculated using 1-second bins in cleaned event files. If a bin has >2000 counts, and if more than 50% of those come from <1% of pixels, then it is considered to be noise-dominated and hence unusable.
| Quadrant | # 1 sec bins | Bins with >0 counts | Bins with >2000 counts | High rate bins dominated by noise | Noise dominated (total time) | Noise dominated (detector-on time) | Marked lightcurve |
|---|---|---|---|---|---|---|---|
| A | 7543 | 7444 | 1739 | 1739 | 23.05% | 23.36% | 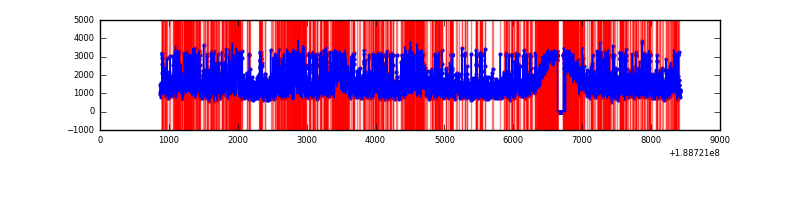 |
| B | 7543 | 7444 | 654 | 654 | 8.67% | 8.79% | 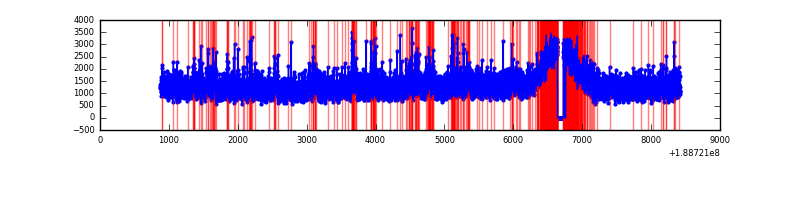 |
| C | 7543 | 7444 | 401 | 401 | 5.32% | 5.39% | 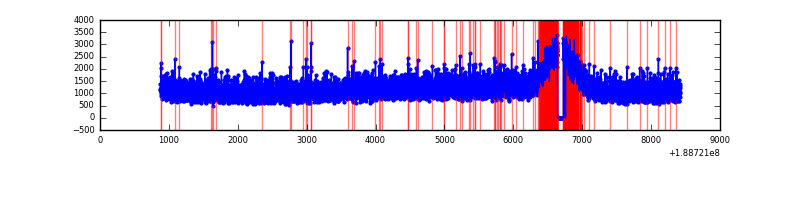 |
| D | 7543 | 7443 | 2456 | 2456 | 32.56% | 33.00% | 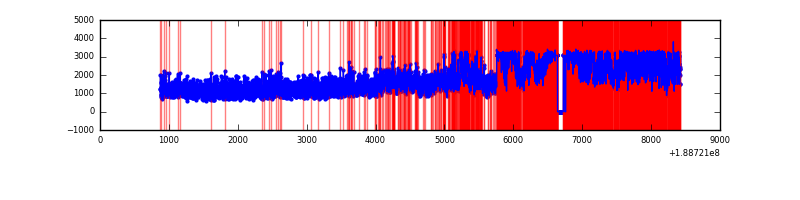 |
Top three noisy pixels from each quadrant. If the there are fewer than three noisy pixels in the level2.evt file, extra rows are filled as -1
| Pixel properties | Quadrant properties | ||||||
|---|---|---|---|---|---|---|---|
| Quadrant | DetID | PixID | Counts | Sigma | Mean | Median | Sigma |
| A | 4 | 32 | 3213486 | 5746.55 | 2307 | 2324 | 558.8 |
| A | 15 | 127 | 29909 | 49.36 | 2307 | 2324 | 558.8 |
| A | 12 | 243 | 15920 | 24.33 | 2307 | 2324 | 558.8 |
| B | 8 | 4 | 541135 | 929.71 | 2440 | 2448 | 579.4 |
| B | 12 | 52 | 90761 | 152.42 | 2440 | 2448 | 579.4 |
| B | 15 | 22 | 53603 | 88.29 | 2440 | 2448 | 579.4 |
| C | 15 | 241 | 365401 | 592.32 | 2184 | 2254 | 613.1 |
| C | 3 | 79 | 30316 | 45.77 | 2184 | 2254 | 613.1 |
| C | 3 | 111 | 29657 | 44.7 | 2184 | 2254 | 613.1 |
| D | 13 | 169 | 5260419 | 8067.97 | 2075 | 2146 | 651.7 |
| D | 10 | 84 | 109253 | 164.34 | 2075 | 2146 | 651.7 |
| D | 2 | 88 | 68671 | 102.07 | 2075 | 2146 | 651.7 |
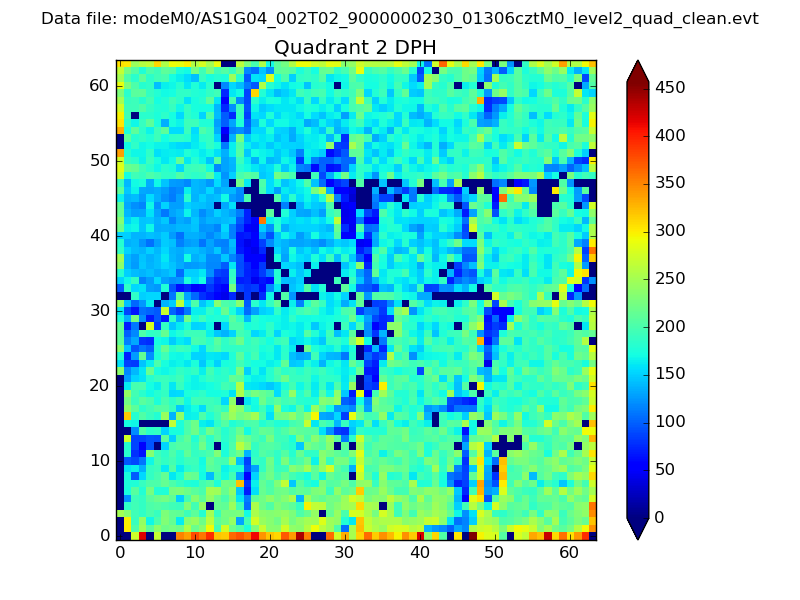
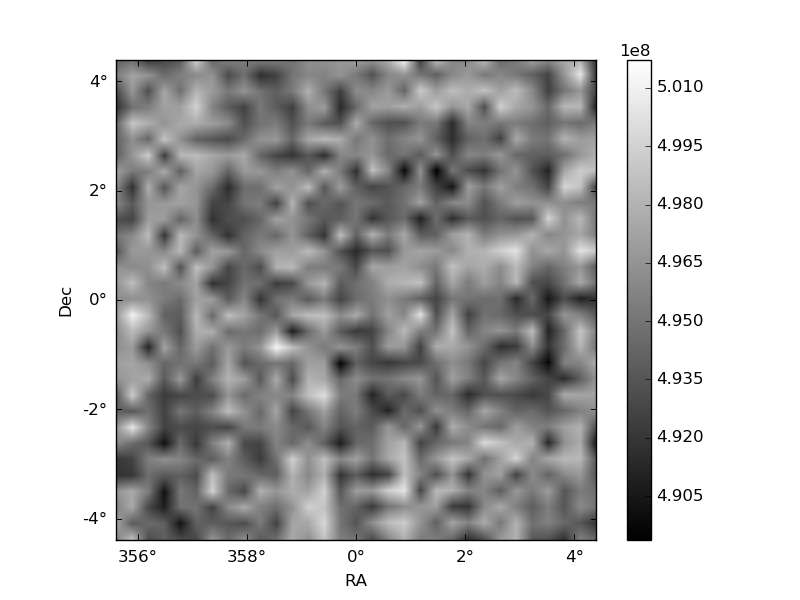
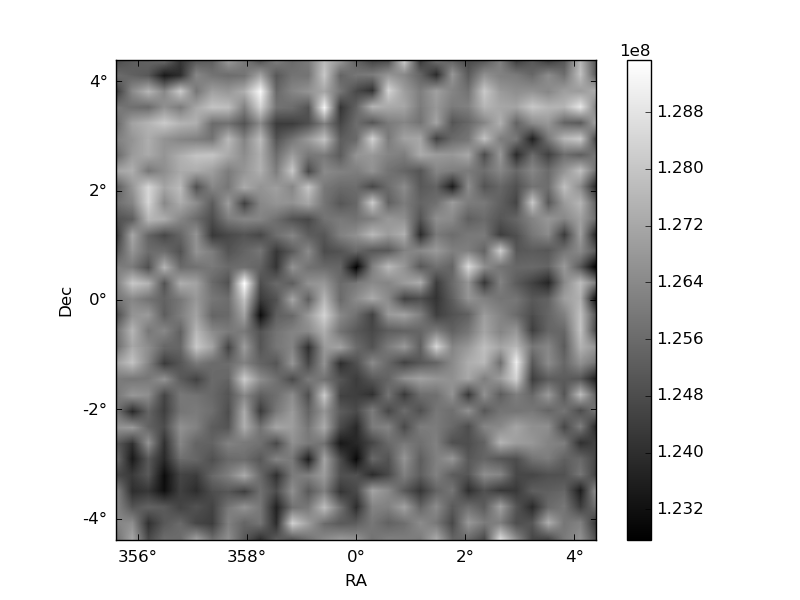
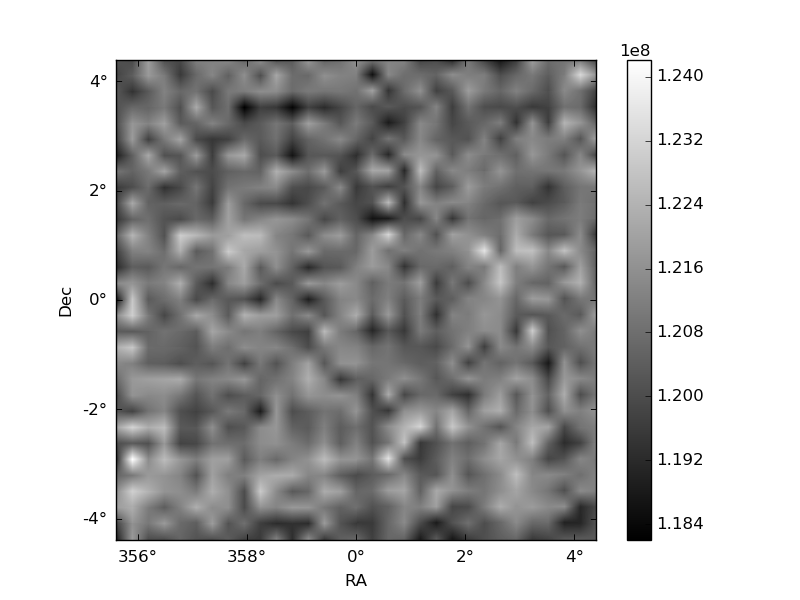
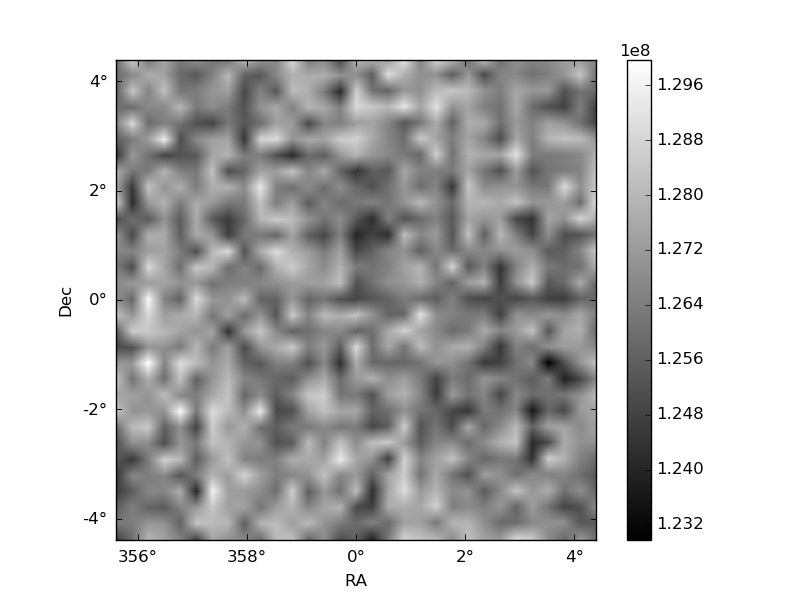
Histogram calculated using DETX and DETY for each event in the final _common_clean file
| Quadrant A | 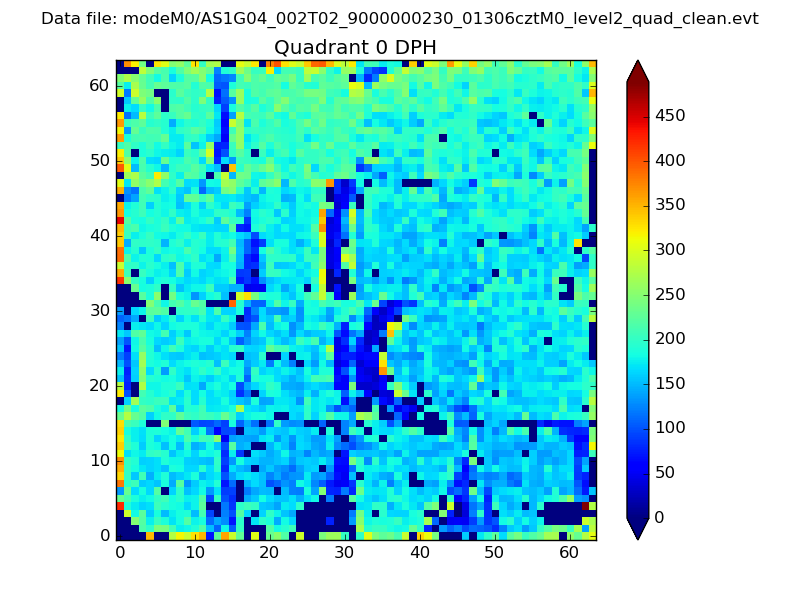 |
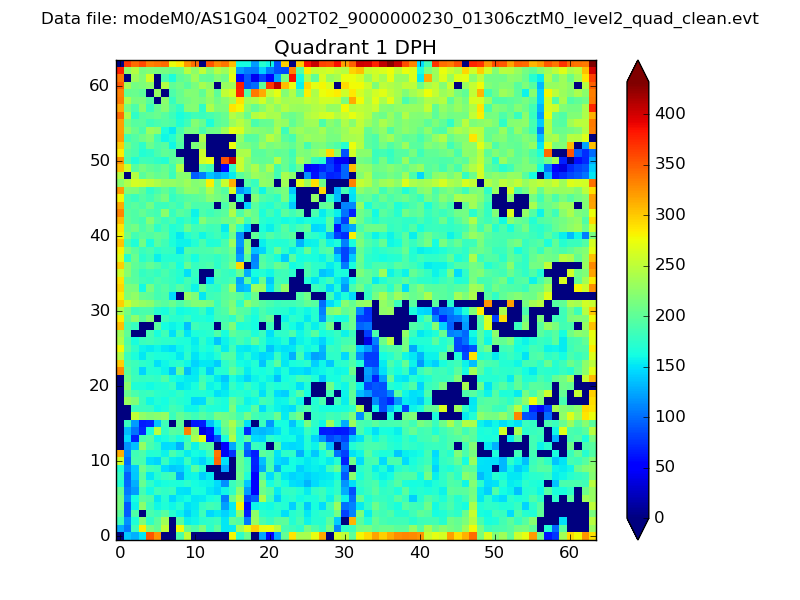 |
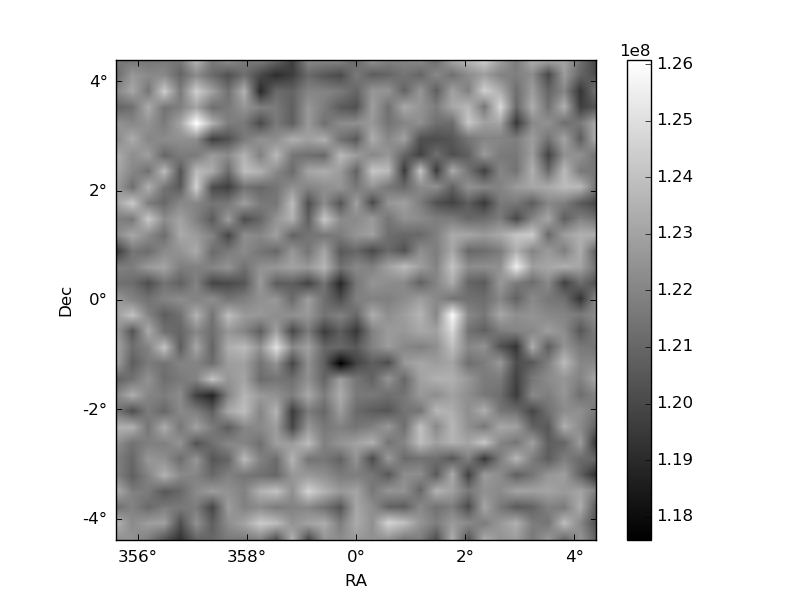
Quadrant B |
|---|---|---|---|
| Quadrant D | 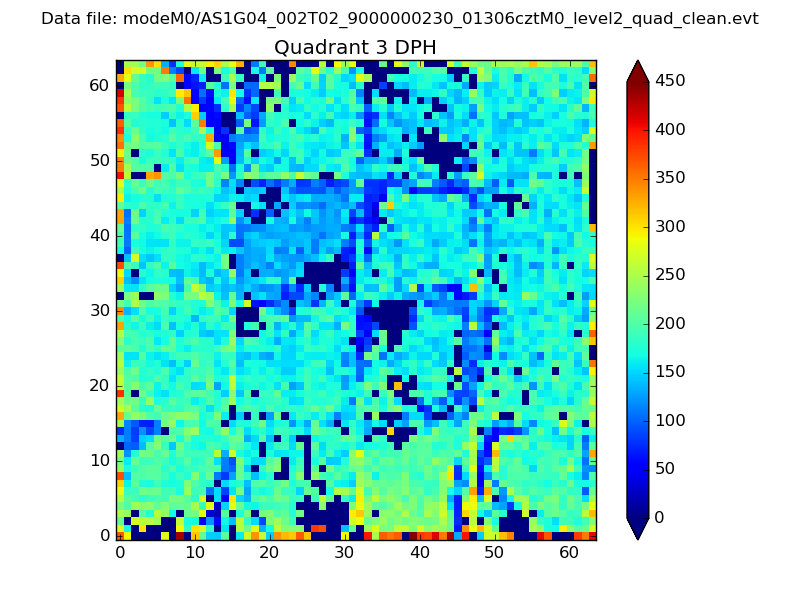 |
 |
Quadrant C |
| Plot type | Count rate plots | Images |
|---|---|---|
| Comparison with Poisson distribution Blue bars denote a histogram of data divided into 1 sec bins. Red curve is a Poisson curve with rate = median count rate of data. |
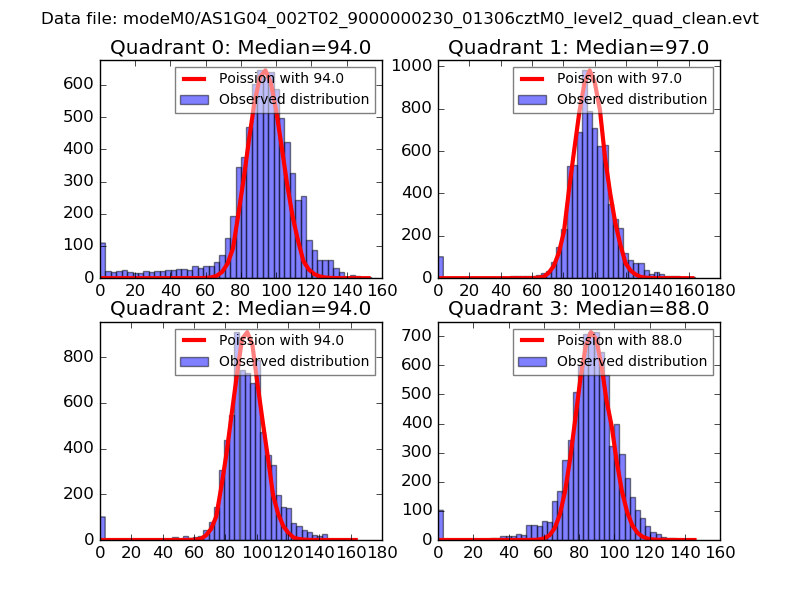 |
 |
| Quadrant-wise count rates Data is divided into 100 sec bins |
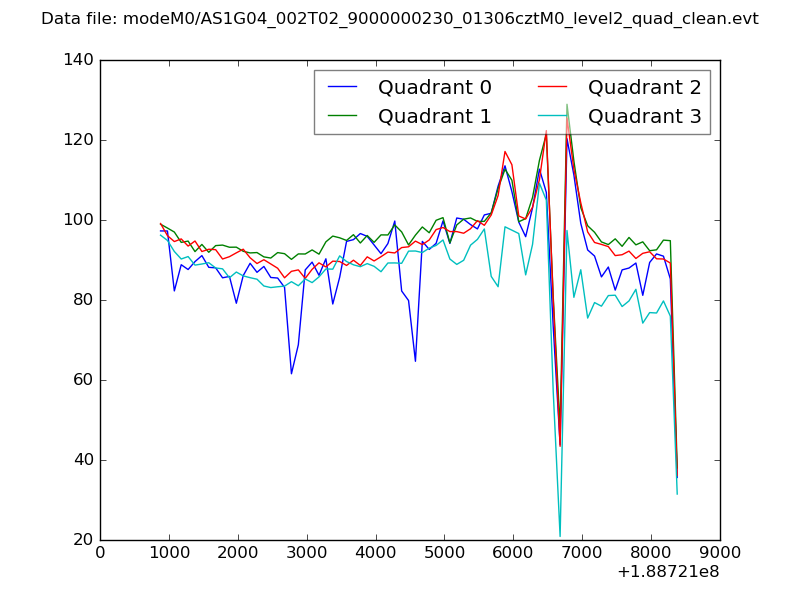 |
|
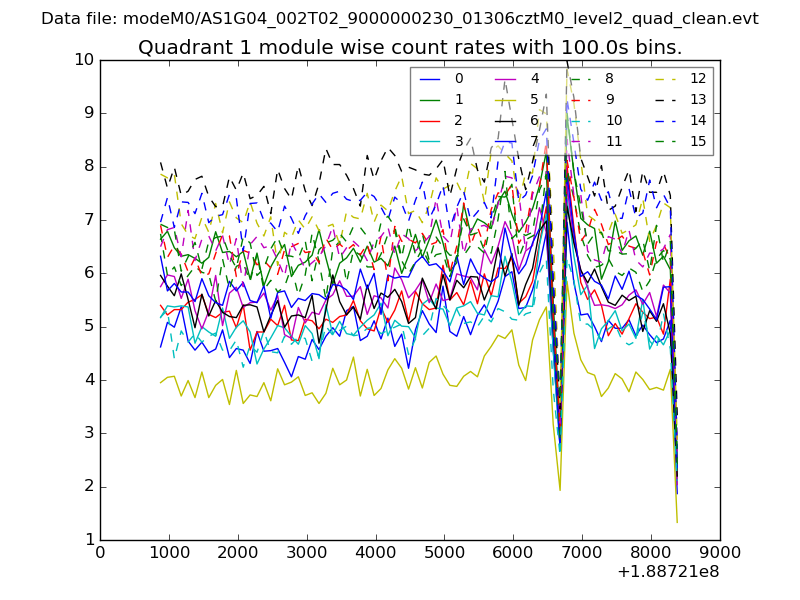
| Module-wise count rates for Quadrant A Data is divided into 100 sec bins |
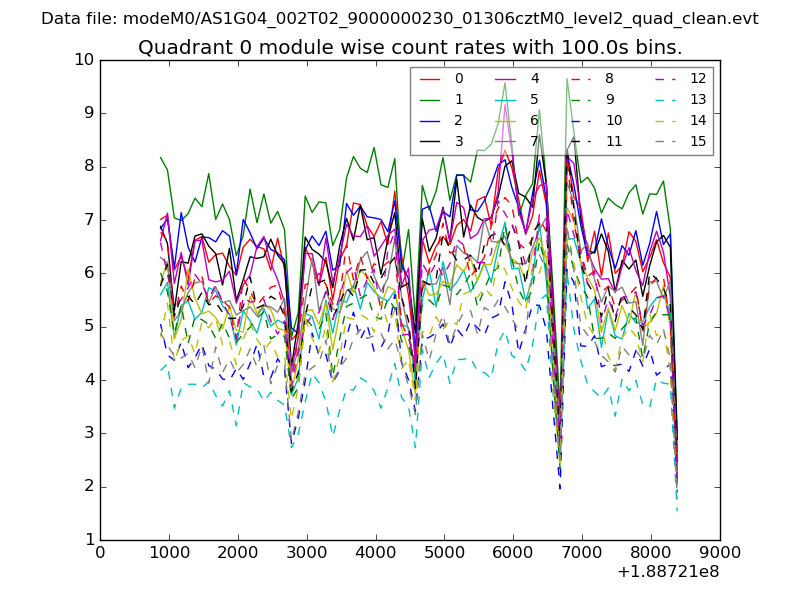 |
 |
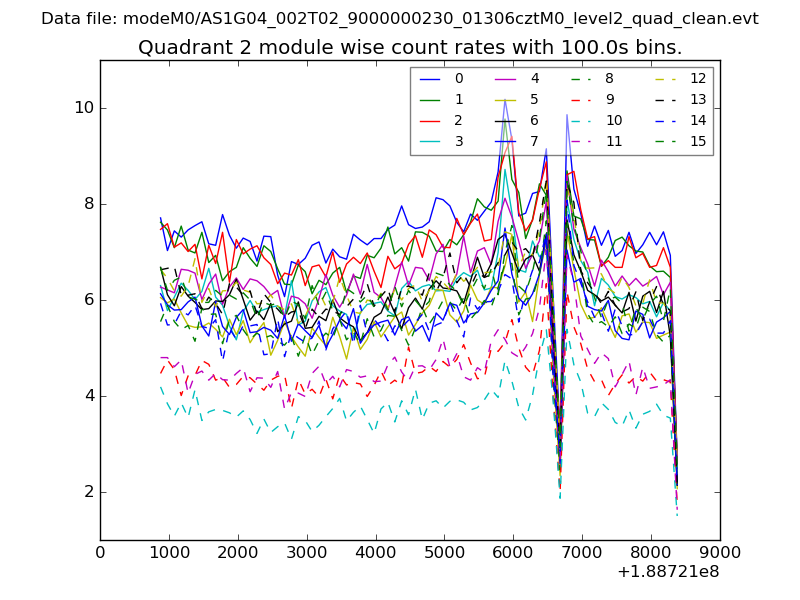
| Module-wise count rates for Quadrant B Data is divided into 100 sec bins |
 |
 |
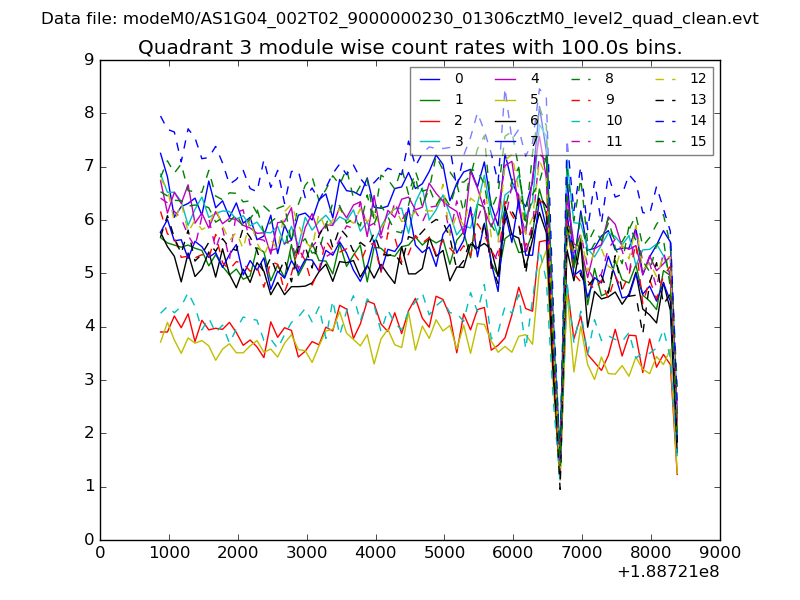
| Module-wise count rates for Quadrant C Data is divided into 100 sec bins |
 |
 |
| Module-wise count rates for Quadrant D Data is divided into 100 sec bins |
 |
 |
| Parameter | Plot |
|---|---|
| CZT HV Monitor | 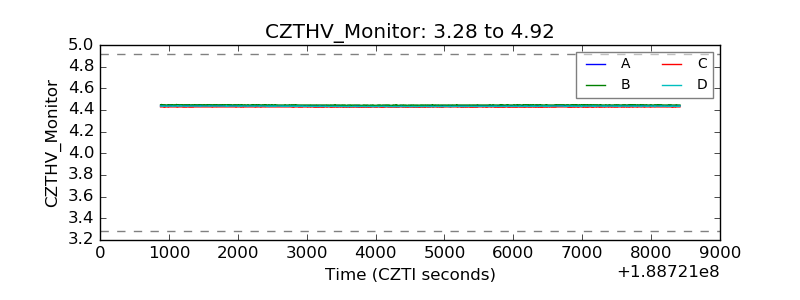 |
| D_VDD | 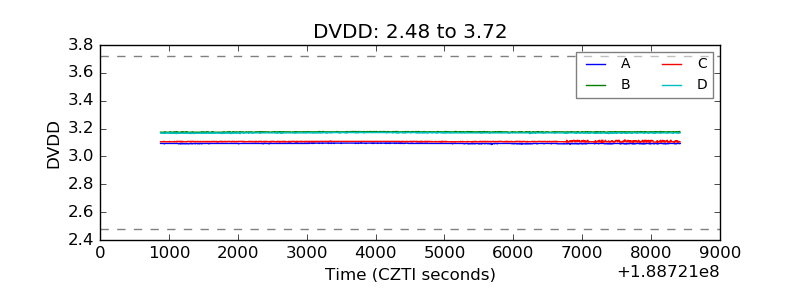 |
| Temperature 1 | 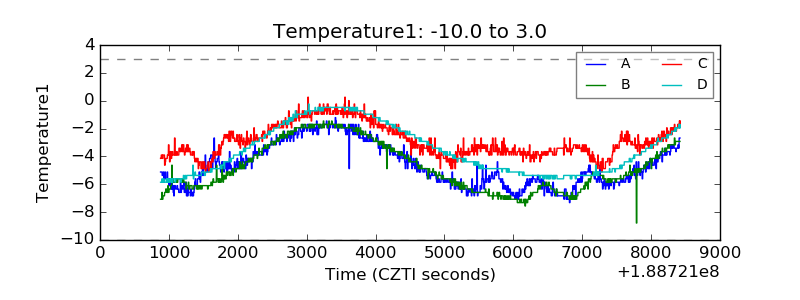 |
| Veto HV Monitor | 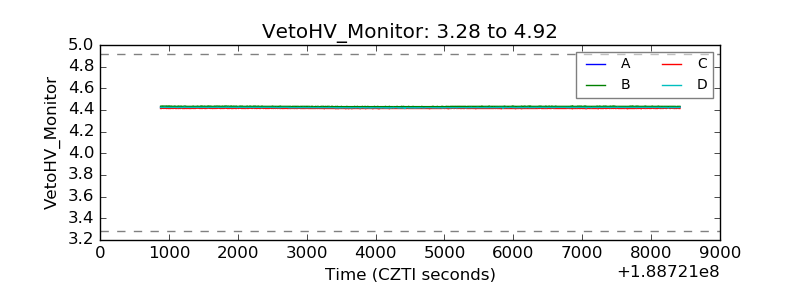 |
| Veto LLD | 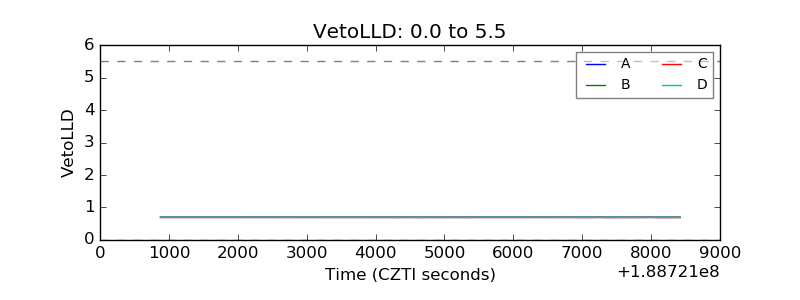 |
| Alpha Counter | 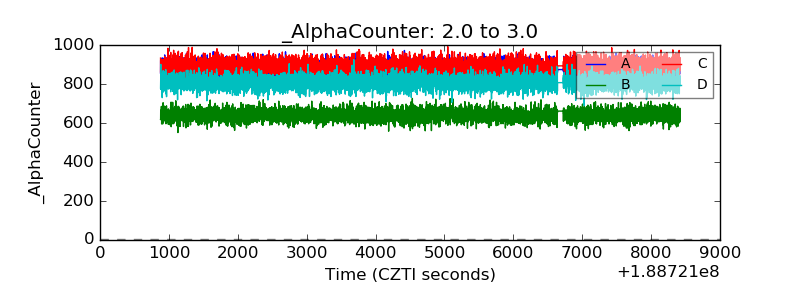 |
| _CPM_Rate | 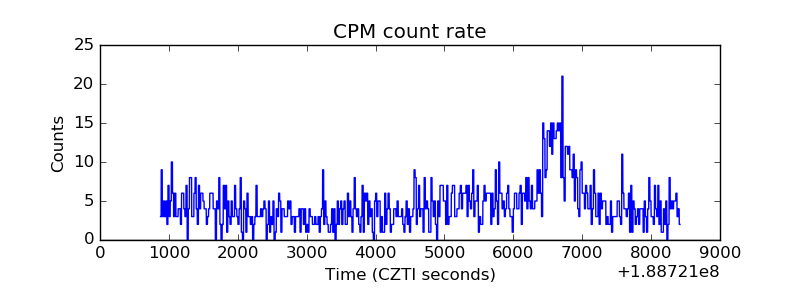 |
| CZT Counter | 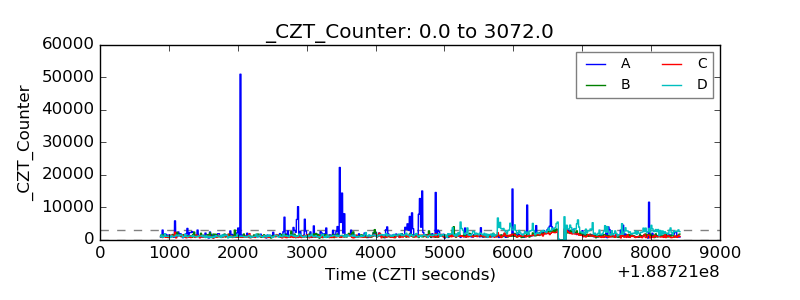 |
| +2.5 Volts monitor |  |
| +5 Volts monitor |  |
| _ROLL_ROT | 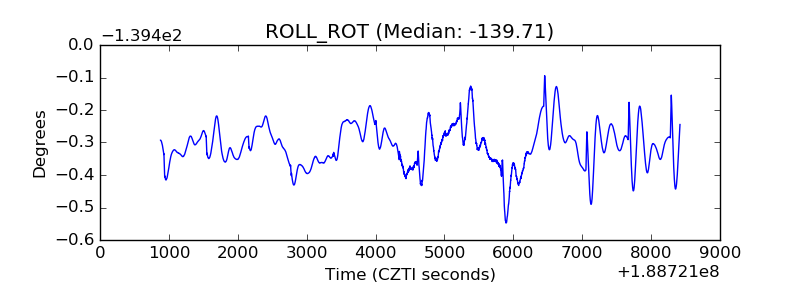 |
| _Roll_DEC | 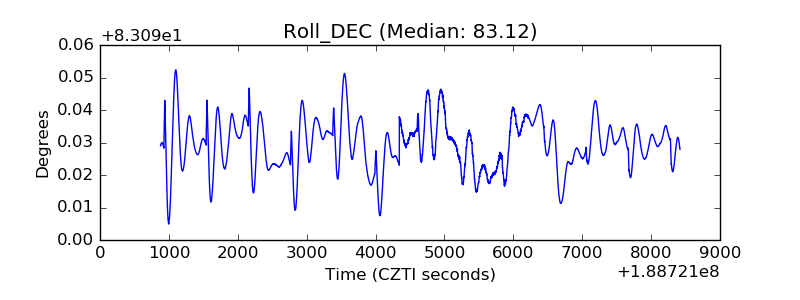 |
| _Roll_RA | 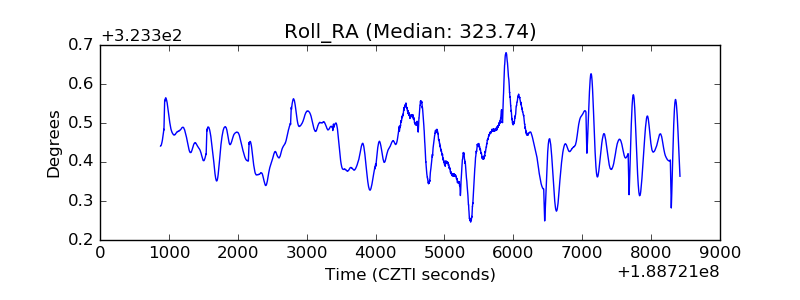 |
| Veto Counter | 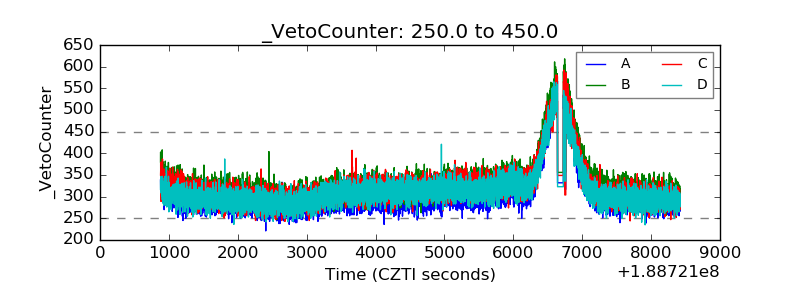 |