| Param | Original file | Final file |
|---|---|---|
| Filename | modeM0/AS1G04_002T02_9000000230_01307cztM0_level2.evt | modeM0/AS1G04_002T02_9000000230_01307cztM0_level2_quad_clean.evt |
| Size (bytes) | 1,517,555,520 | 103,726,080 |
| Size | 1.4 GB | 98.9 MB |
| Events in quadrant A | 9,618,885 | 683,091 |
| Events in quadrant B | 9,509,361 | 697,995 |
| Events in quadrant C | 8,588,102 | 676,357 |
| Events in quadrant D | 17,769,160 | 580,535 |
| Mode M0 | |||
|---|---|---|---|
| Quadrant | BADHDUFLAG | Total packets | Discarded packets |
| A | 0 | 33685 | 1 |
| B | 0 | 33343 | 0 |
| C | 0 | 30664 | 0 |
| D | 0 | 58123 | 0 |
| Mode SS | |||
|---|---|---|---|
| Quadrant | BADHDUFLAG | Total packets | Discarded packets |
| A | 0 | 144 | 0 |
| B | 0 | 144 | 0 |
| C | 0 | 144 | 0 |
| D | 0 | 144 | 0 |
| Quadrant | Total seconds | Saturated seconds | Saturation percentage |
|---|---|---|---|
| A | 7215 | 248 | 3.437283% |
| B | 7215 | 34 | 0.471240% |
| C | 7215 | 1 | 0.013860% |
| D | 7215 | 2197 | 30.450450% |
Noise dominated data is calculated using 1-second bins in cleaned event files. If a bin has >2000 counts, and if more than 50% of those come from <1% of pixels, then it is considered to be noise-dominated and hence unusable.
| Quadrant | # 1 sec bins | Bins with >0 counts | Bins with >2000 counts | High rate bins dominated by noise | Noise dominated (total time) | Noise dominated (detector-on time) | Marked lightcurve |
|---|---|---|---|---|---|---|---|
| A | 7215 | 7215 | 714 | 714 | 9.90% | 9.90% | 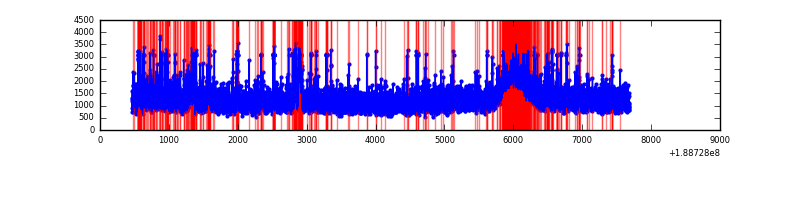 |
| B | 7215 | 7215 | 480 | 480 | 6.65% | 6.65% | 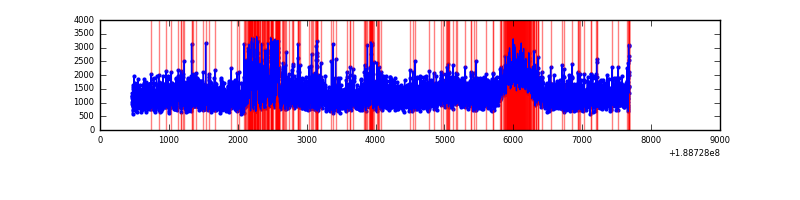 |
| C | 7215 | 7215 | 233 | 233 | 3.23% | 3.23% | 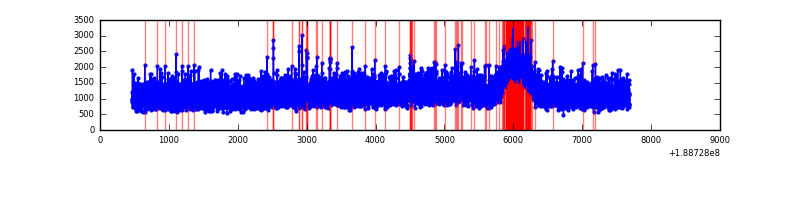 |
| D | 7215 | 7215 | 5427 | 5427 | 75.22% | 75.22% | 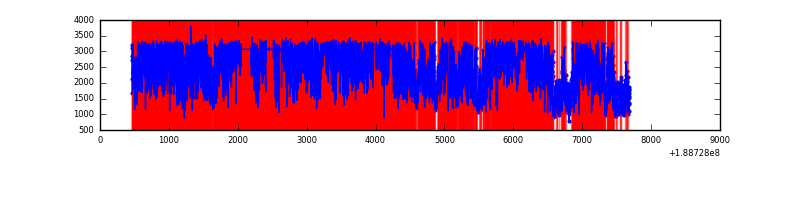 |
Top three noisy pixels from each quadrant. If the there are fewer than three noisy pixels in the level2.evt file, extra rows are filled as -1
| Pixel properties | Quadrant properties | ||||||
|---|---|---|---|---|---|---|---|
| Quadrant | DetID | PixID | Counts | Sigma | Mean | Median | Sigma |
| A | 4 | 32 | 1049759 | 1932.84 | 2228 | 2238 | 542.0 |
| A | 15 | 127 | 14573 | 22.76 | 2228 | 2238 | 542.0 |
| A | 11 | 79 | 8829 | 12.16 | 2228 | 2238 | 542.0 |
| B | 8 | 4 | 334680 | 605.18 | 2314 | 2325 | 549.2 |
| B | 6 | 53 | 182849 | 328.71 | 2314 | 2325 | 549.2 |
| B | 12 | 52 | 60172 | 105.33 | 2314 | 2325 | 549.2 |
| C | 15 | 241 | 362233 | 620.86 | 2070 | 2140 | 580.0 |
| C | 3 | 9 | 57768 | 95.91 | 2070 | 2140 | 580.0 |
| C | 3 | 79 | 43591 | 71.47 | 2070 | 2140 | 580.0 |
| D | 13 | 169 | 9960758 | 16868.78 | 1890 | 1953 | 590.4 |
| D | 10 | 84 | 393367 | 663.0 | 1890 | 1953 | 590.4 |
| D | 2 | 88 | 179783 | 301.22 | 1890 | 1953 | 590.4 |
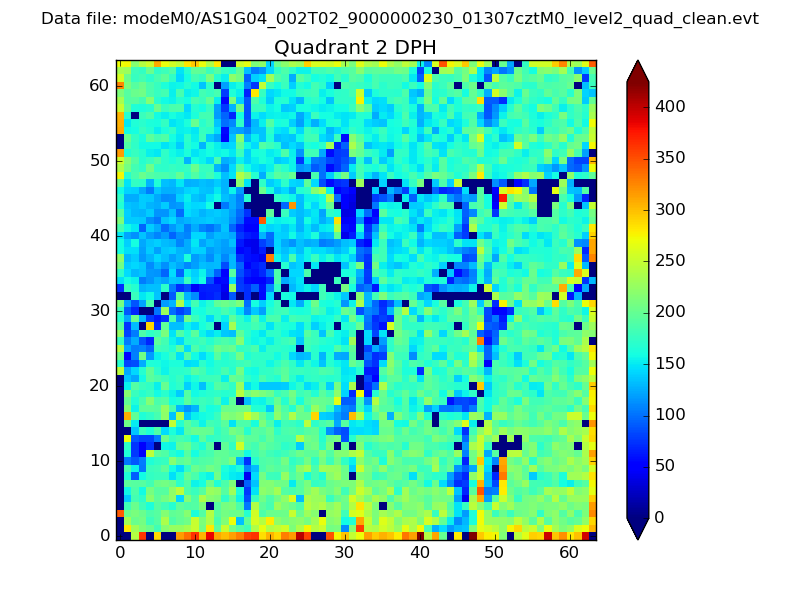
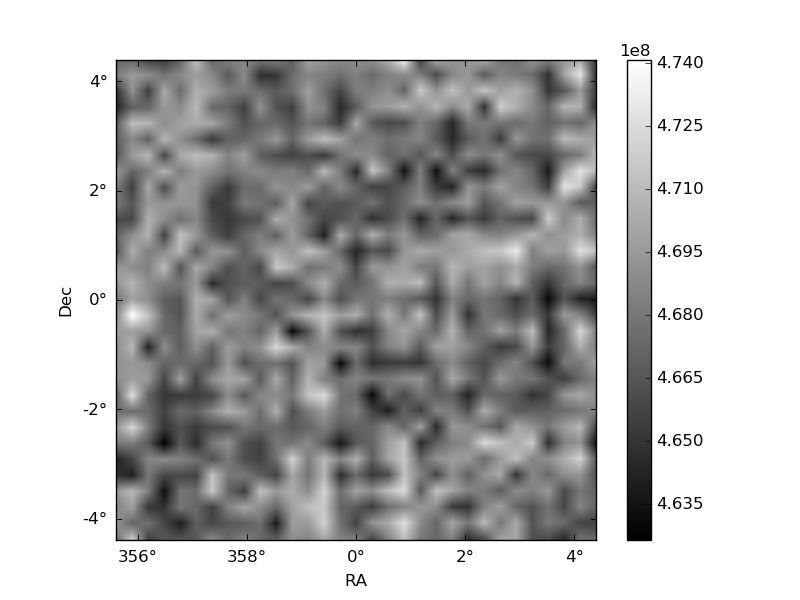
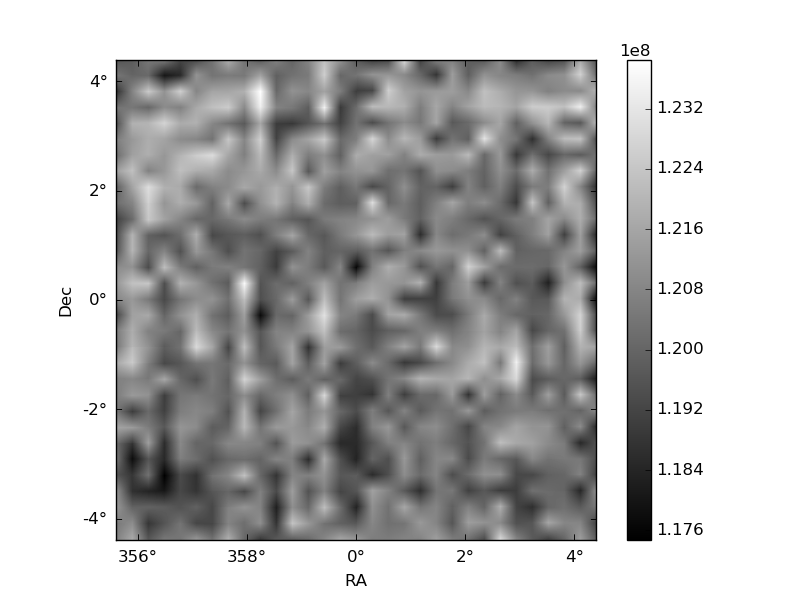
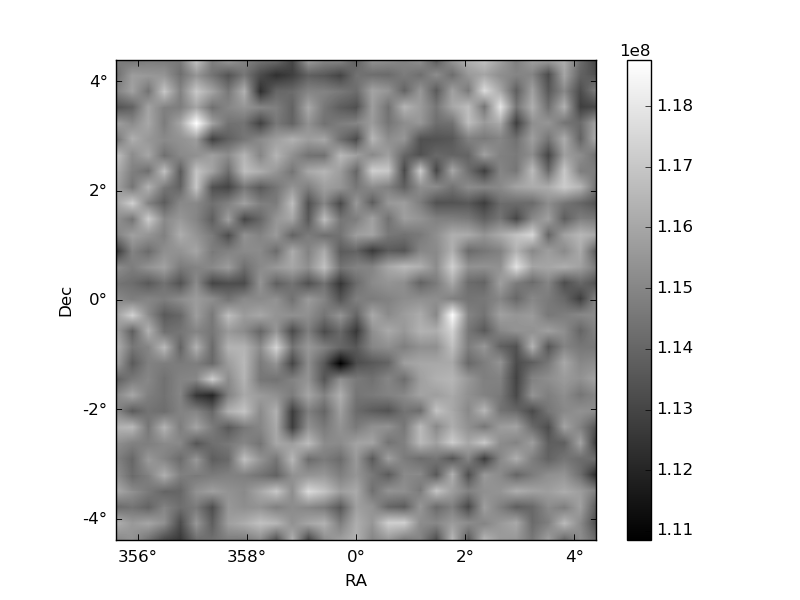
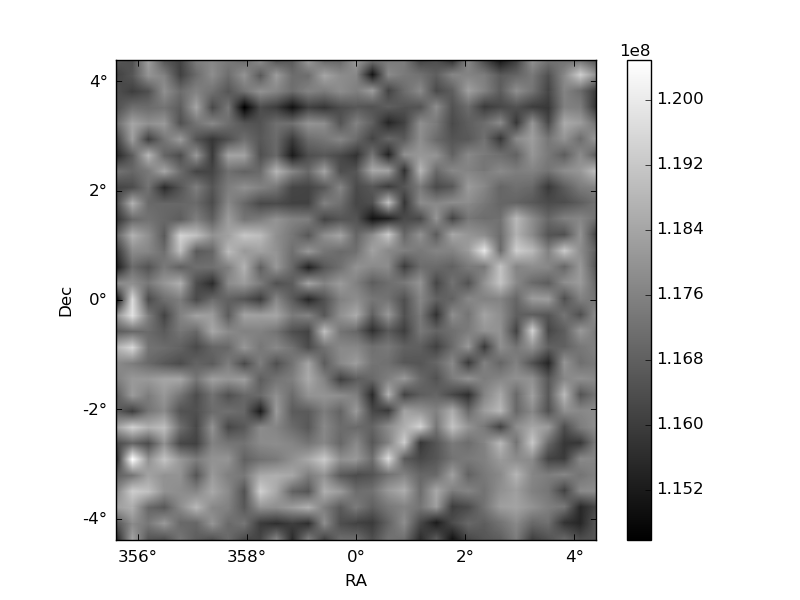
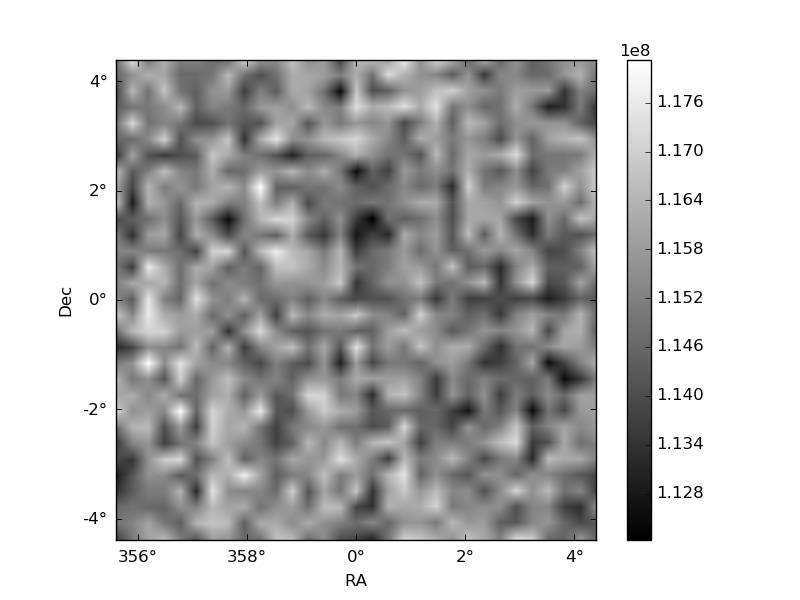
Histogram calculated using DETX and DETY for each event in the final _common_clean file
| Quadrant A | 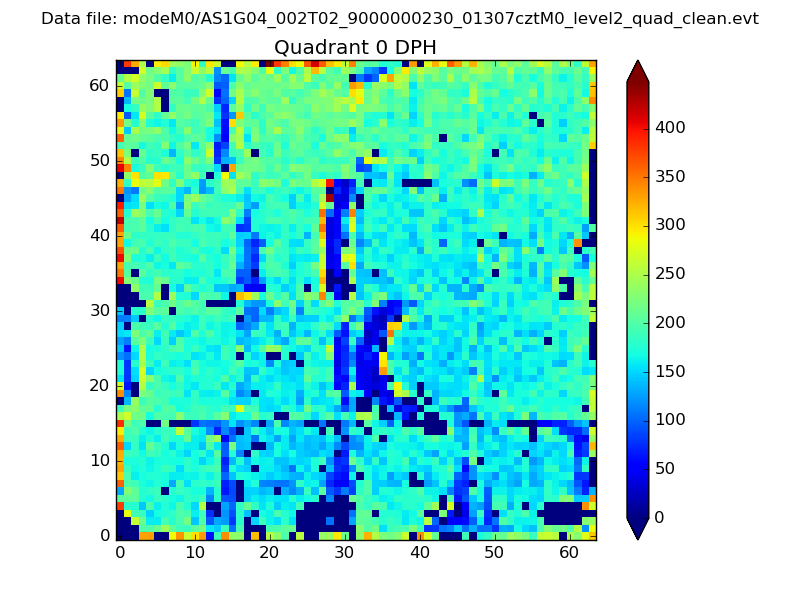 |
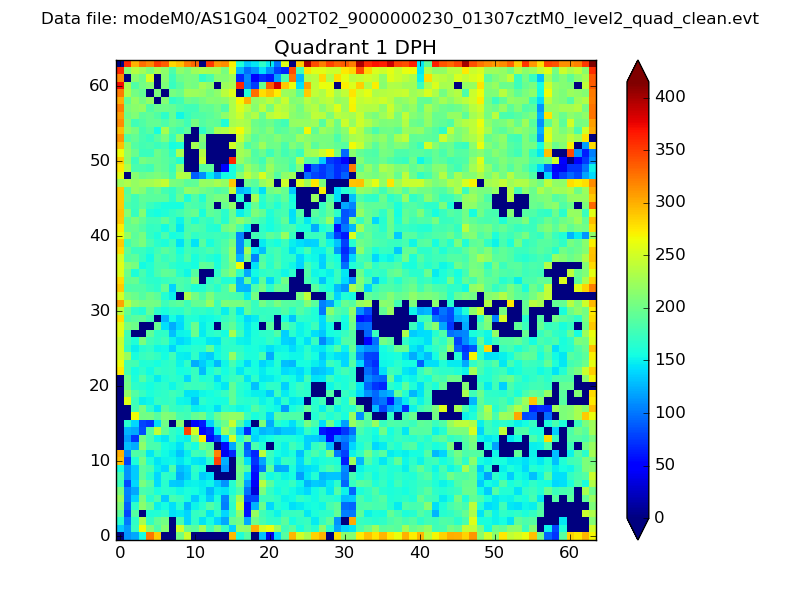 |
Quadrant B |
|---|---|---|---|
| Quadrant D | 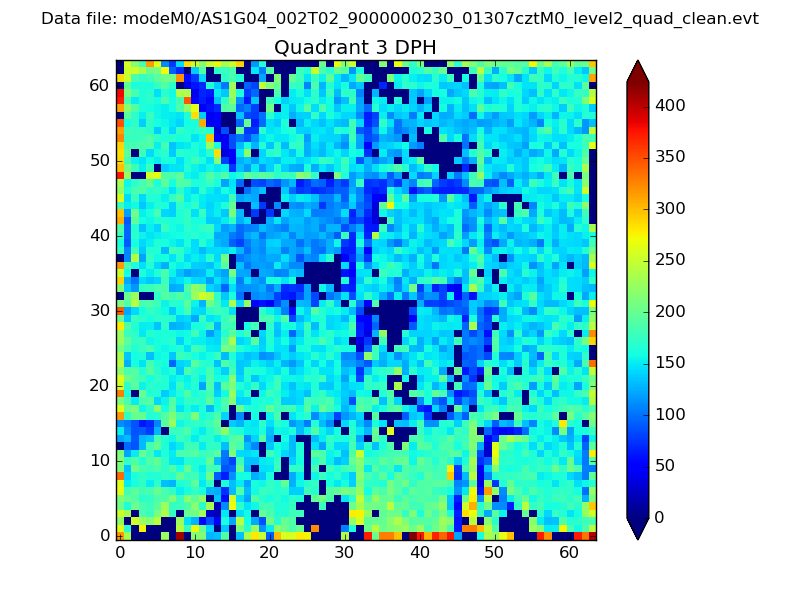 |
 |
Quadrant C |
| Plot type | Count rate plots | Images |
|---|---|---|
| Comparison with Poisson distribution Blue bars denote a histogram of data divided into 1 sec bins. Red curve is a Poisson curve with rate = median count rate of data. |
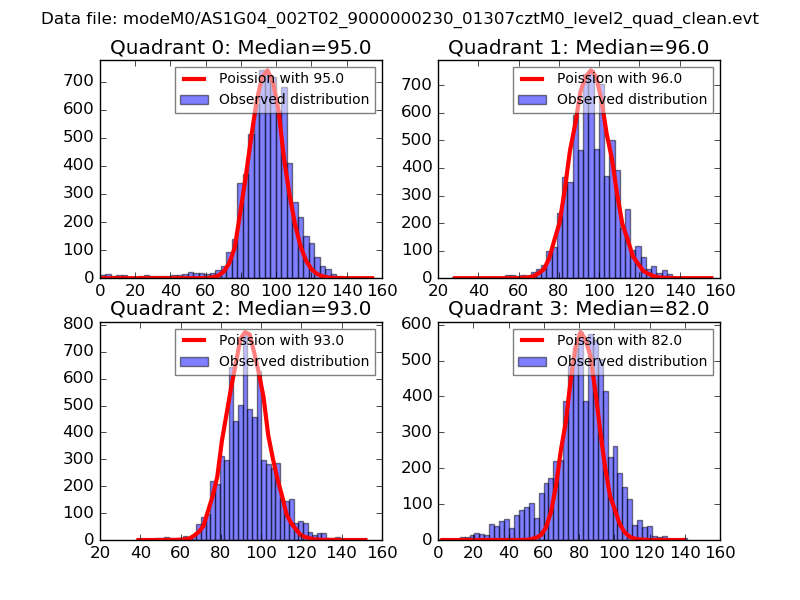 |
 |
| Quadrant-wise count rates Data is divided into 100 sec bins |
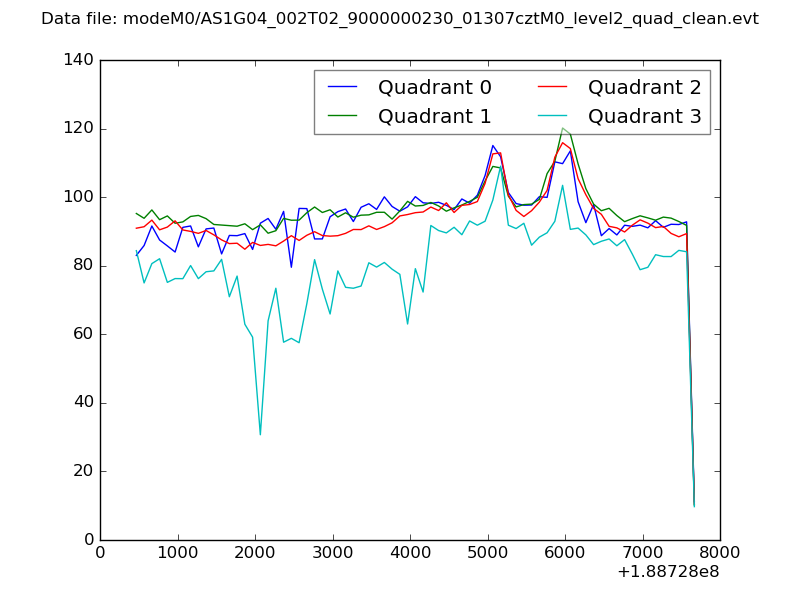 |
|
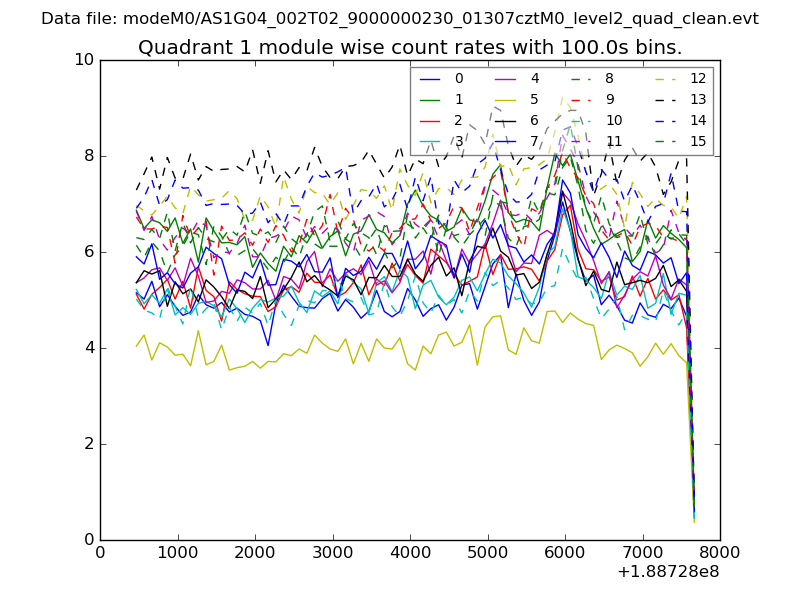
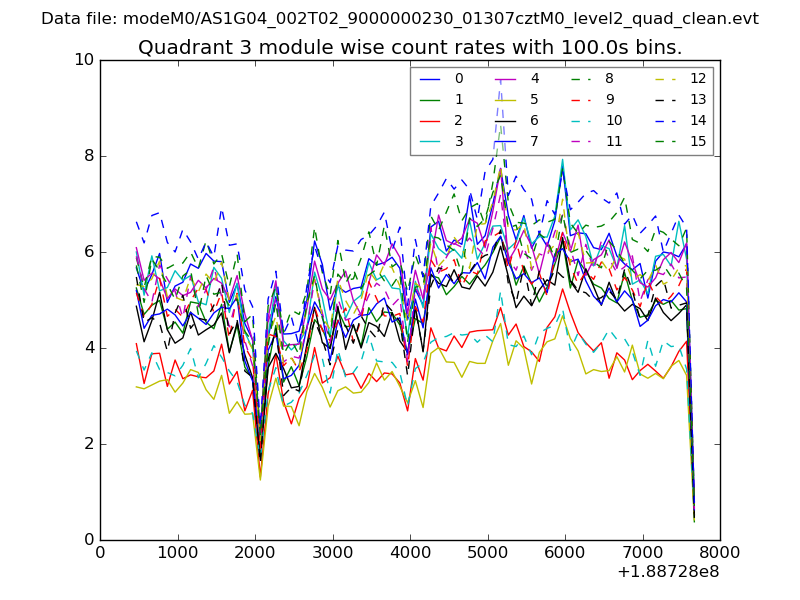
| Module-wise count rates for Quadrant A Data is divided into 100 sec bins |
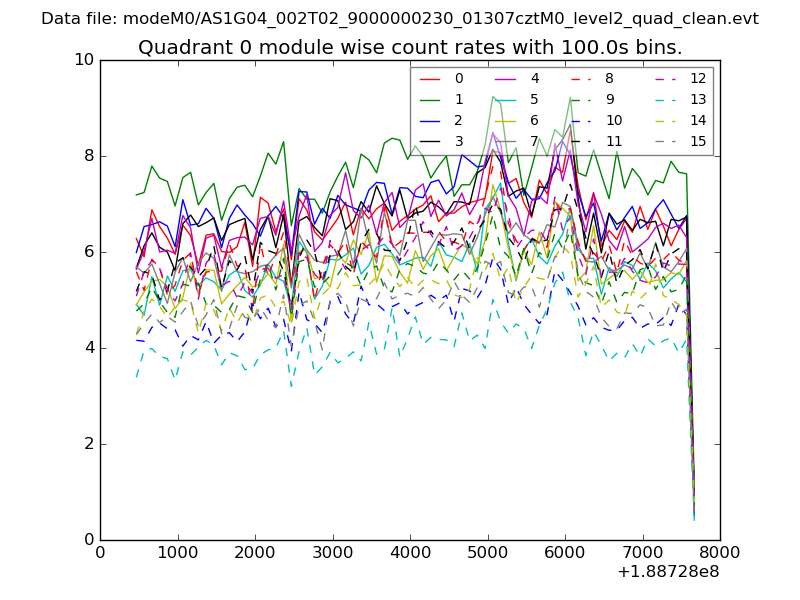 |
 |
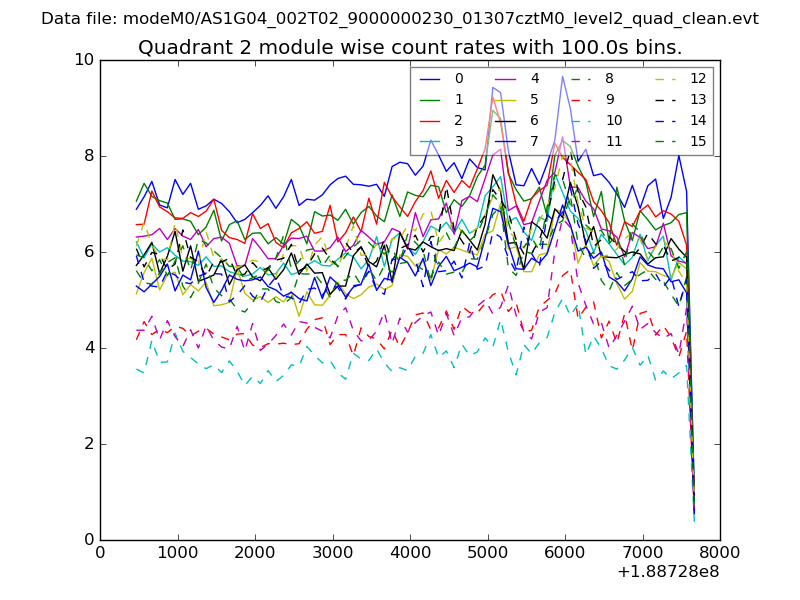
| Module-wise count rates for Quadrant B Data is divided into 100 sec bins |
 |
 |
| Module-wise count rates for Quadrant C Data is divided into 100 sec bins |
 |
 |
| Module-wise count rates for Quadrant D Data is divided into 100 sec bins |
 |
 |
| Parameter | Plot |
|---|---|
| CZT HV Monitor | 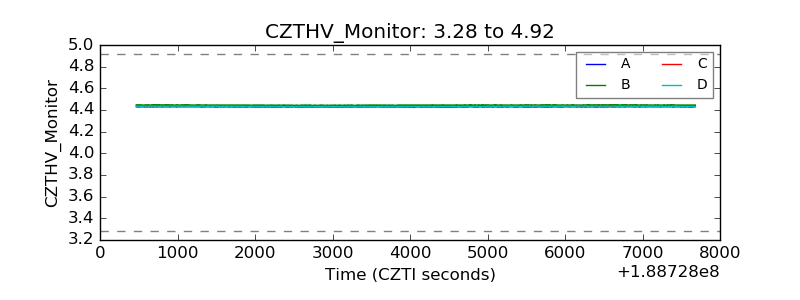 |
| D_VDD | 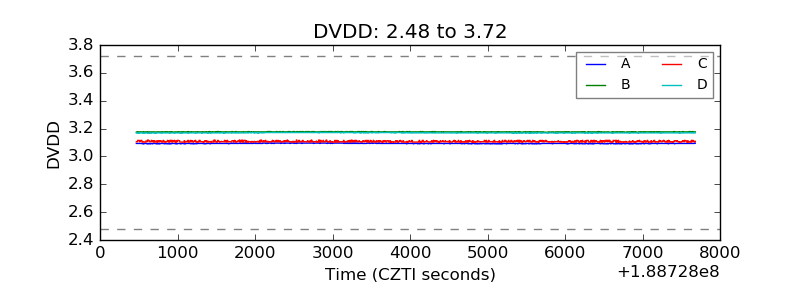 |
| Temperature 1 | 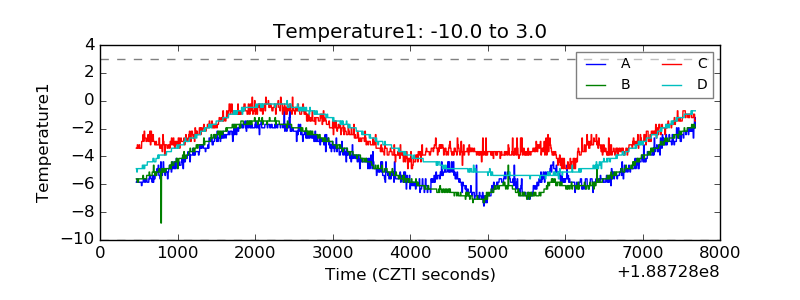 |
| Veto HV Monitor | 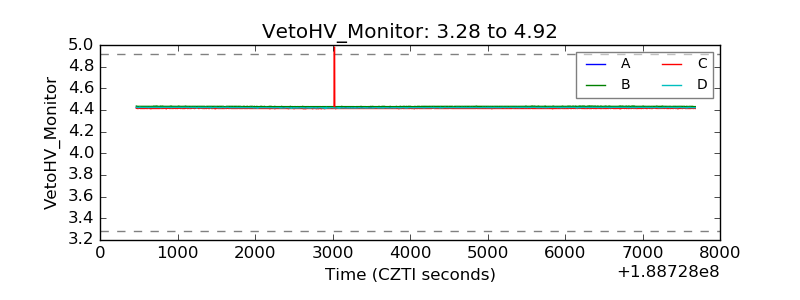 |
| Veto LLD | 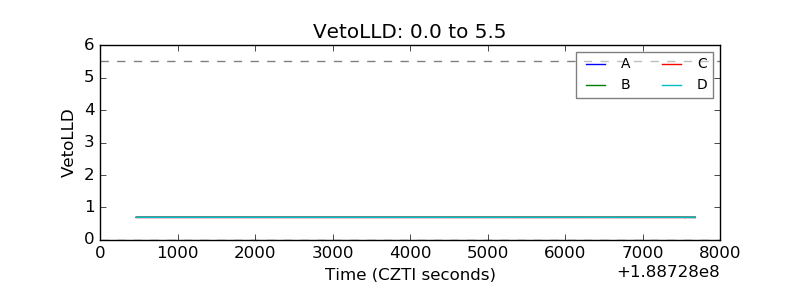 |
| Alpha Counter | 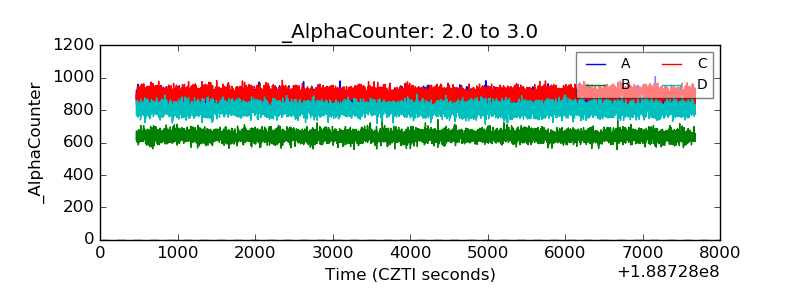 |
| _CPM_Rate | 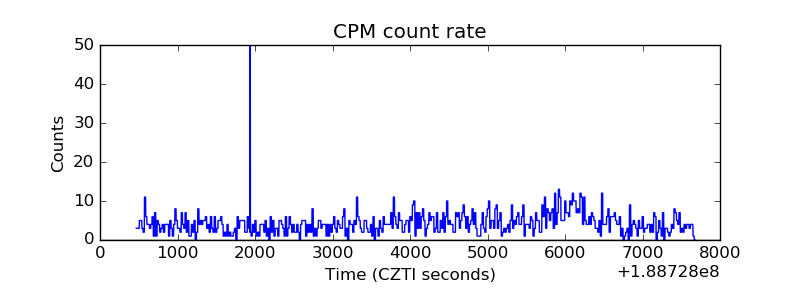 |
| CZT Counter | 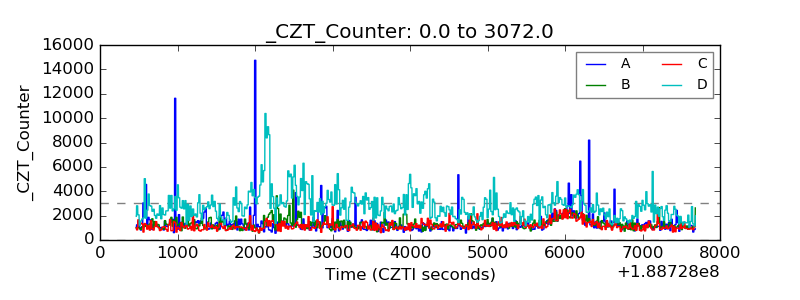 |
| +2.5 Volts monitor | 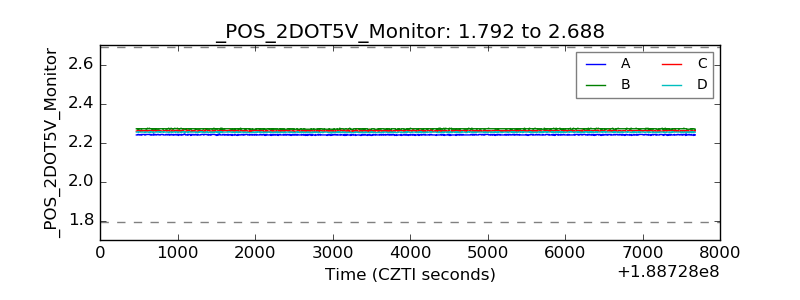 |
| +5 Volts monitor |  |
| _ROLL_ROT | 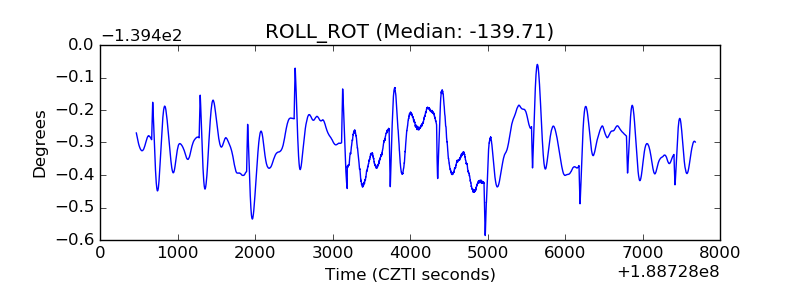 |
| _Roll_DEC | 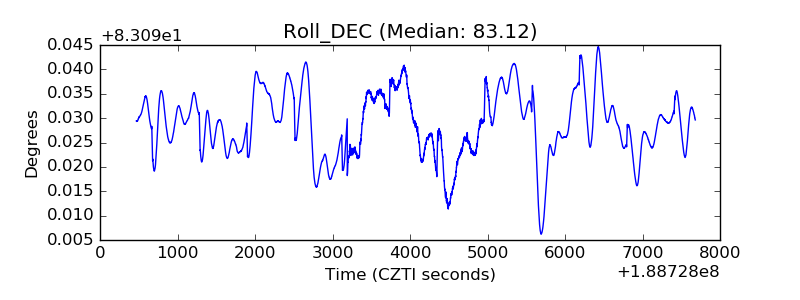 |
| _Roll_RA | 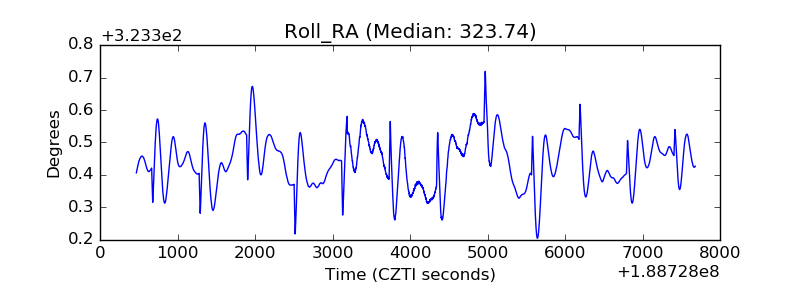 |
| Veto Counter | 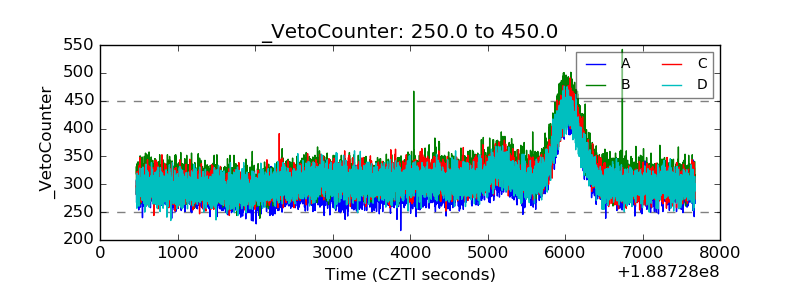 |