| Param | Original file | Final file |
|---|---|---|
| Filename | modeM0/AS1G04_002T02_9000000230_01308cztM0_level2.evt | modeM0/AS1G04_002T02_9000000230_01308cztM0_level2_quad_clean.evt |
| Size (bytes) | 1,469,566,080 | 104,480,640 |
| Size | 1.4 GB | 99.6 MB |
| Events in quadrant A | 9,400,169 | 683,987 |
| Events in quadrant B | 9,976,308 | 695,731 |
| Events in quadrant C | 9,127,104 | 675,376 |
| Events in quadrant D | 15,528,629 | 606,369 |
| Mode M0 | |||
|---|---|---|---|
| Quadrant | BADHDUFLAG | Total packets | Discarded packets |
| A | 0 | 33068 | 3 |
| B | 0 | 34710 | 2 |
| C | 0 | 32233 | 2 |
| D | 0 | 51402 | 2 |
| Mode SS | |||
|---|---|---|---|
| Quadrant | BADHDUFLAG | Total packets | Discarded packets |
| A | 0 | 146 | 0 |
| B | 0 | 146 | 0 |
| C | 0 | 146 | 0 |
| D | 0 | 146 | 0 |
| Quadrant | Total seconds | Saturated seconds | Saturation percentage |
|---|---|---|---|
| A | 7205 | 261 | 3.622484% |
| B | 7205 | 50 | 0.693963% |
| C | 7205 | 51 | 0.707842% |
| D | 7205 | 1486 | 20.624566% |
Noise dominated data is calculated using 1-second bins in cleaned event files. If a bin has >2000 counts, and if more than 50% of those come from <1% of pixels, then it is considered to be noise-dominated and hence unusable.
| Quadrant | # 1 sec bins | Bins with >0 counts | Bins with >2000 counts | High rate bins dominated by noise | Noise dominated (total time) | Noise dominated (detector-on time) | Marked lightcurve |
|---|---|---|---|---|---|---|---|
| A | 7235 | 7207 | 632 | 632 | 8.74% | 8.77% | 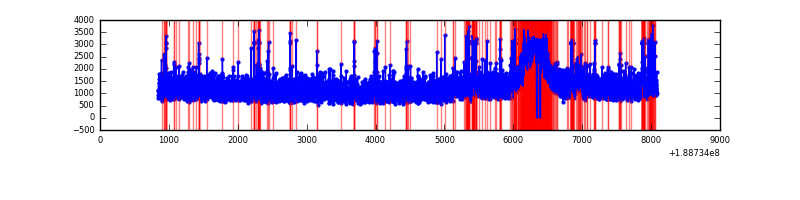 |
| B | 7235 | 7207 | 611 | 611 | 8.45% | 8.48% | 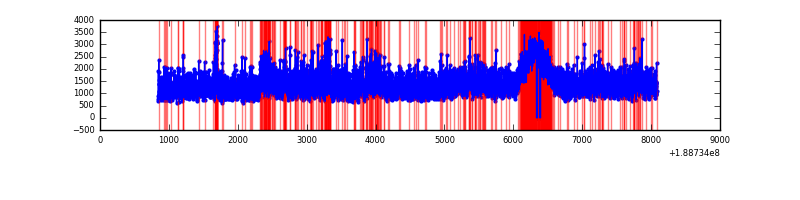 |
| C | 7235 | 7207 | 416 | 416 | 5.75% | 5.77% | 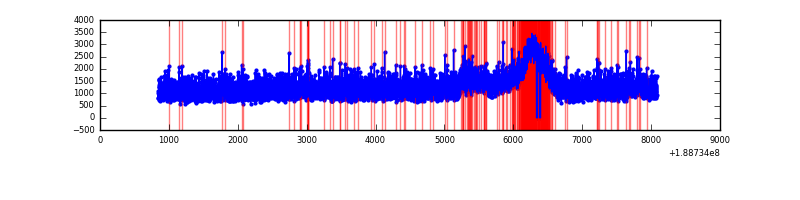 |
| D | 7235 | 7207 | 3789 | 3789 | 52.37% | 52.57% | 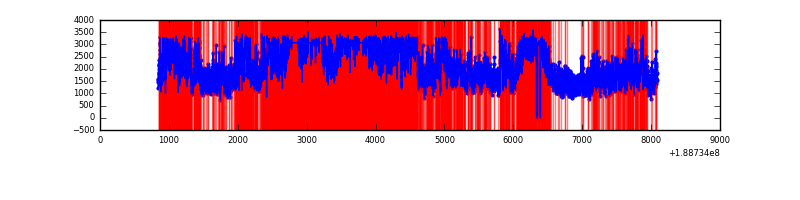 |
Top three noisy pixels from each quadrant. If the there are fewer than three noisy pixels in the level2.evt file, extra rows are filled as -1
| Pixel properties | Quadrant properties | ||||||
|---|---|---|---|---|---|---|---|
| Quadrant | DetID | PixID | Counts | Sigma | Mean | Median | Sigma |
| A | 4 | 32 | 598640 | 1095.93 | 2249 | 2265 | 544.2 |
| A | 12 | 189 | 77978 | 139.13 | 2249 | 2265 | 544.2 |
| A | 15 | 233 | 39148 | 67.78 | 2249 | 2265 | 544.2 |
| B | 8 | 4 | 617777 | 1104.88 | 2349 | 2361 | 557.0 |
| B | 12 | 52 | 179099 | 317.31 | 2349 | 2361 | 557.0 |
| B | 15 | 22 | 85564 | 149.38 | 2349 | 2361 | 557.0 |
| C | 15 | 241 | 359010 | 597.15 | 2130 | 2201 | 597.5 |
| C | 3 | 9 | 319562 | 531.13 | 2130 | 2201 | 597.5 |
| C | 8 | 208 | 54870 | 88.15 | 2130 | 2201 | 597.5 |
| D | 13 | 169 | 7745771 | 12401.14 | 1994 | 2065 | 624.4 |
| D | 10 | 84 | 260378 | 413.67 | 1994 | 2065 | 624.4 |
| D | 10 | 215 | 20839 | 30.06 | 1994 | 2065 | 624.4 |
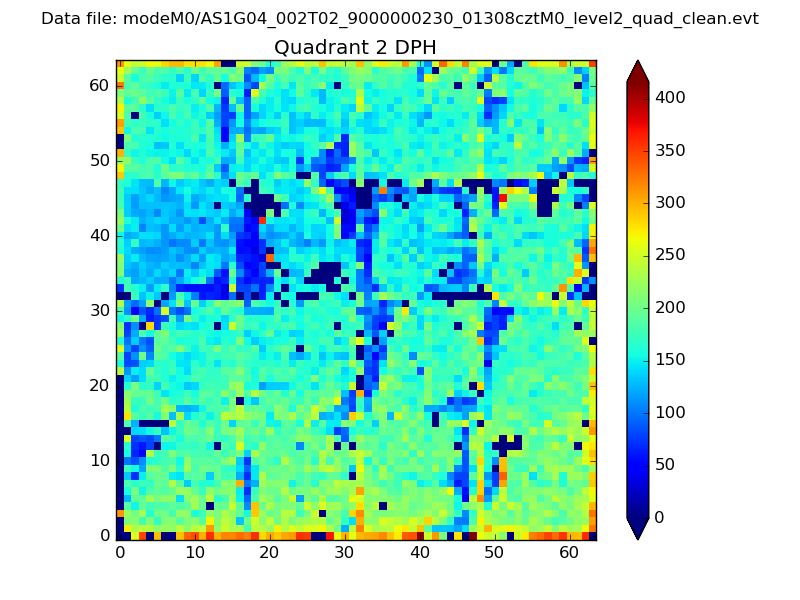
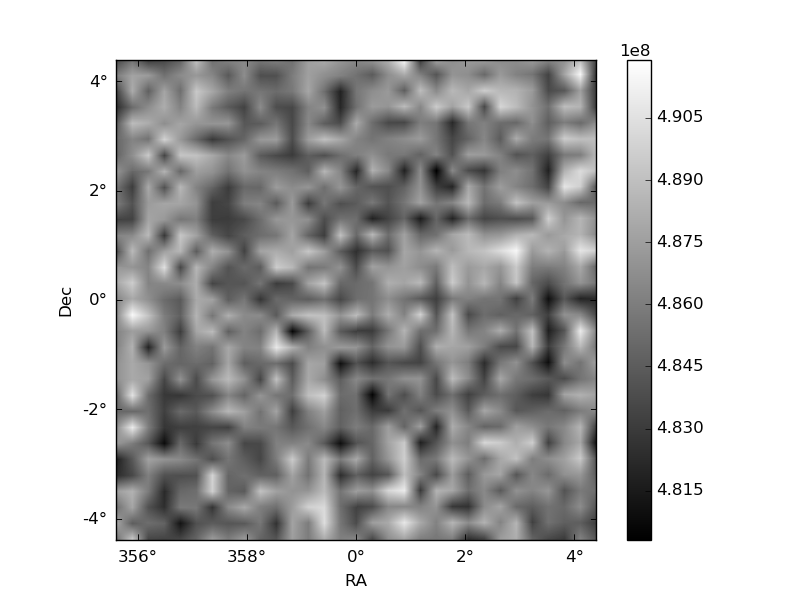
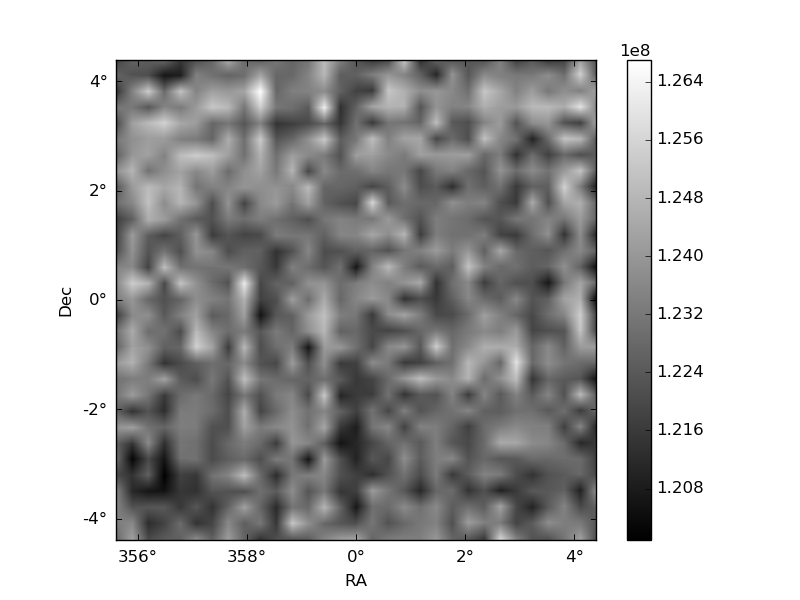
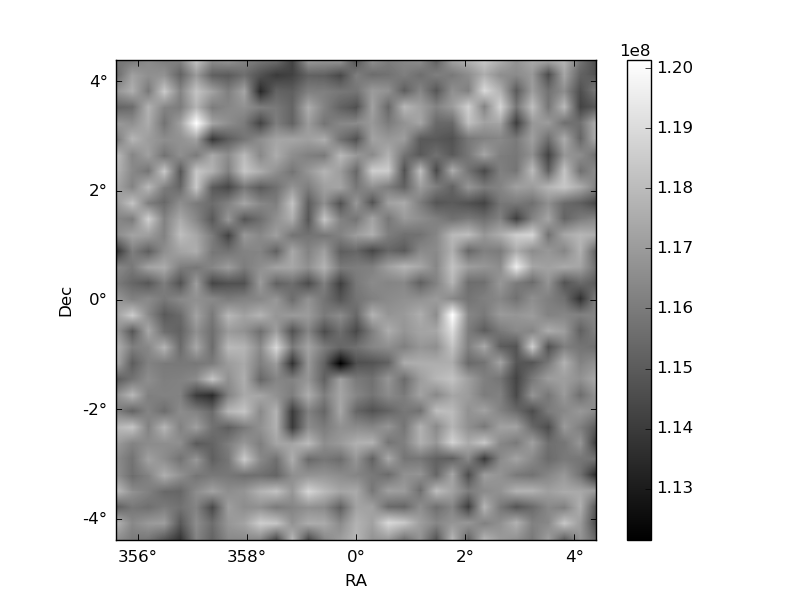
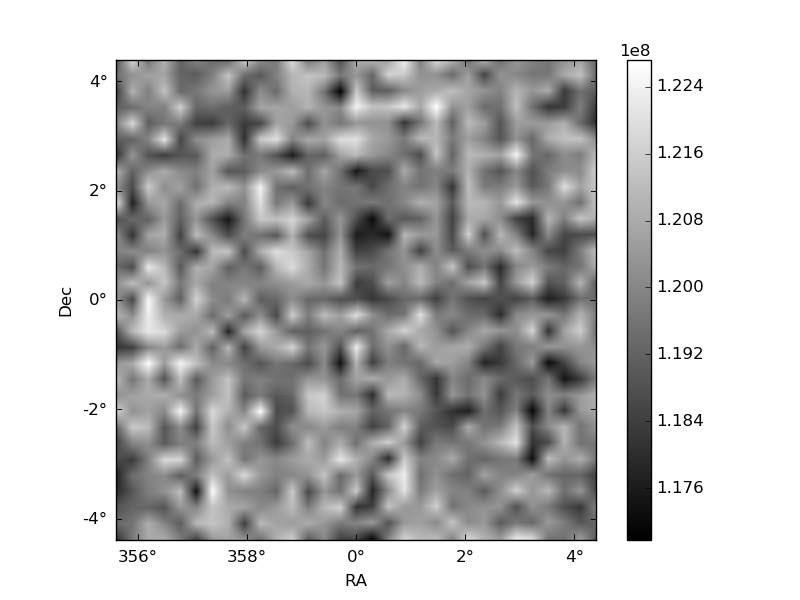
Histogram calculated using DETX and DETY for each event in the final _common_clean file
| Quadrant A | 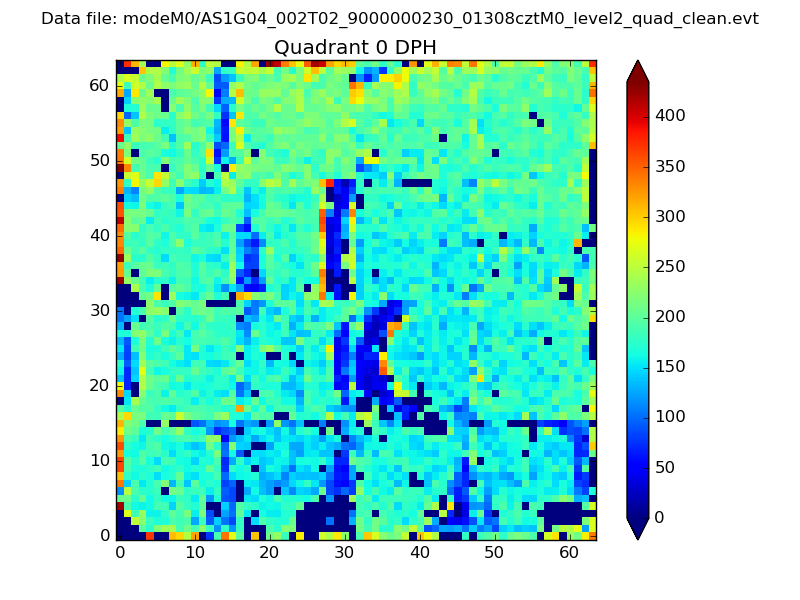 |
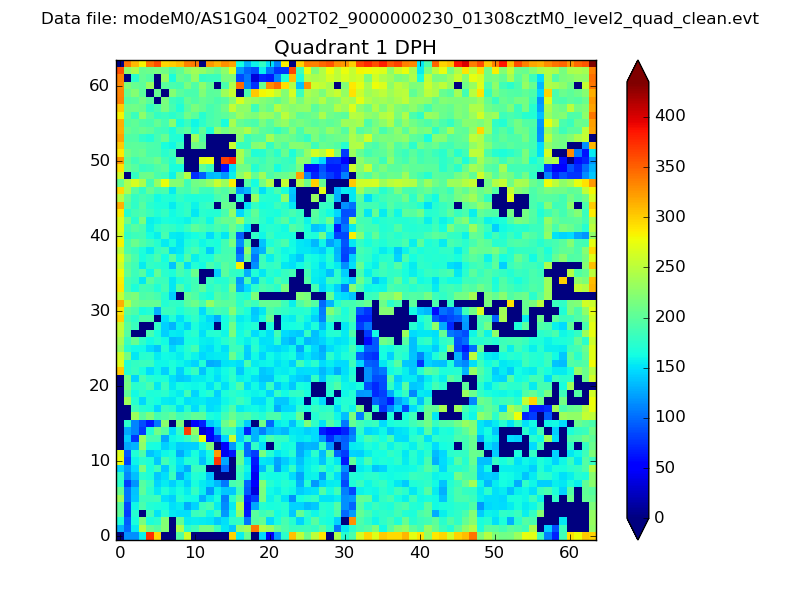 |
Quadrant B |
|---|---|---|---|
| Quadrant D | 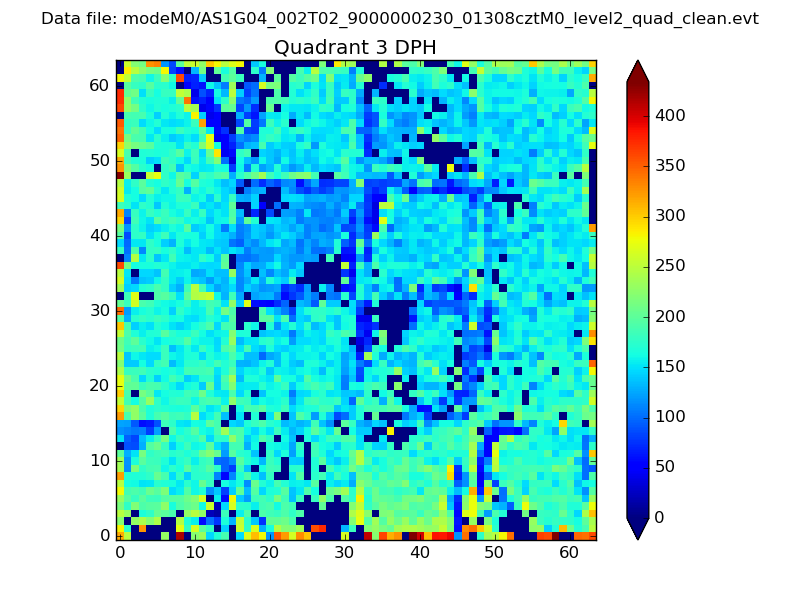 |
 |
Quadrant C |
| Plot type | Count rate plots | Images |
|---|---|---|
| Comparison with Poisson distribution Blue bars denote a histogram of data divided into 1 sec bins. Red curve is a Poisson curve with rate = median count rate of data. |
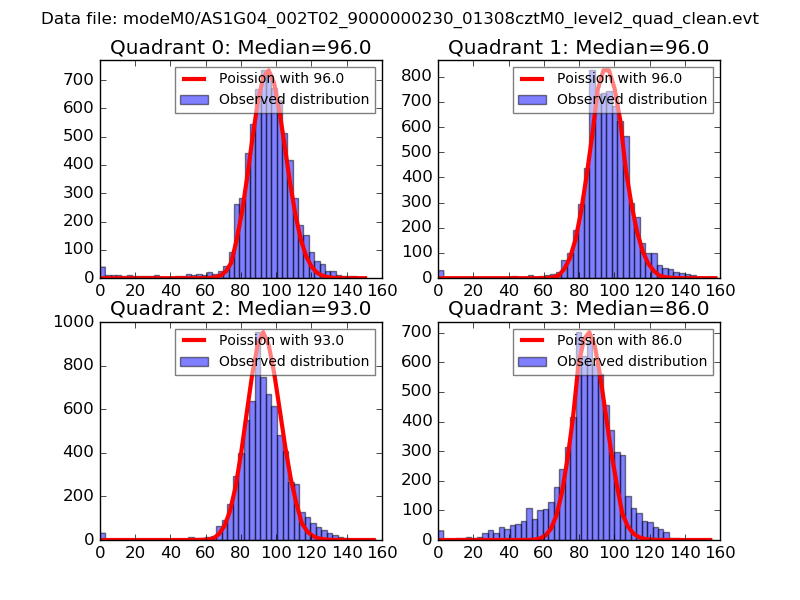 |
 |
| Quadrant-wise count rates Data is divided into 100 sec bins |
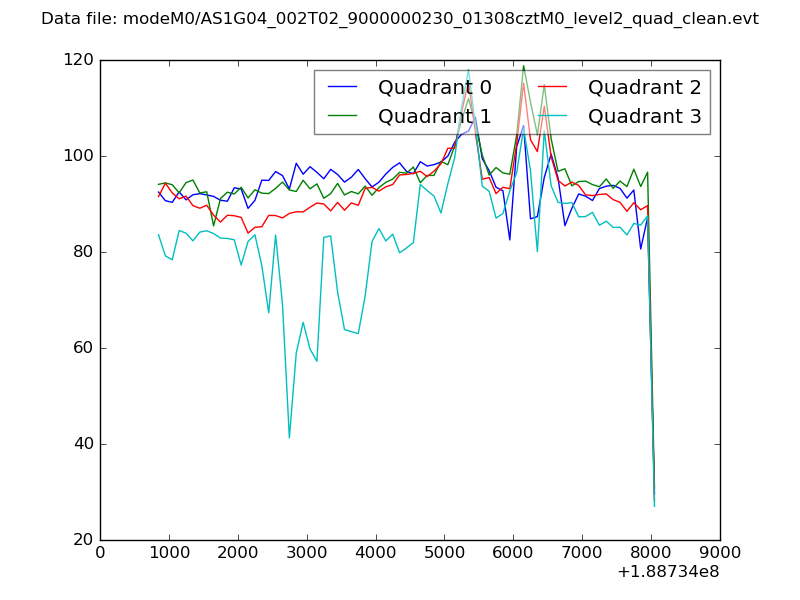 |
|
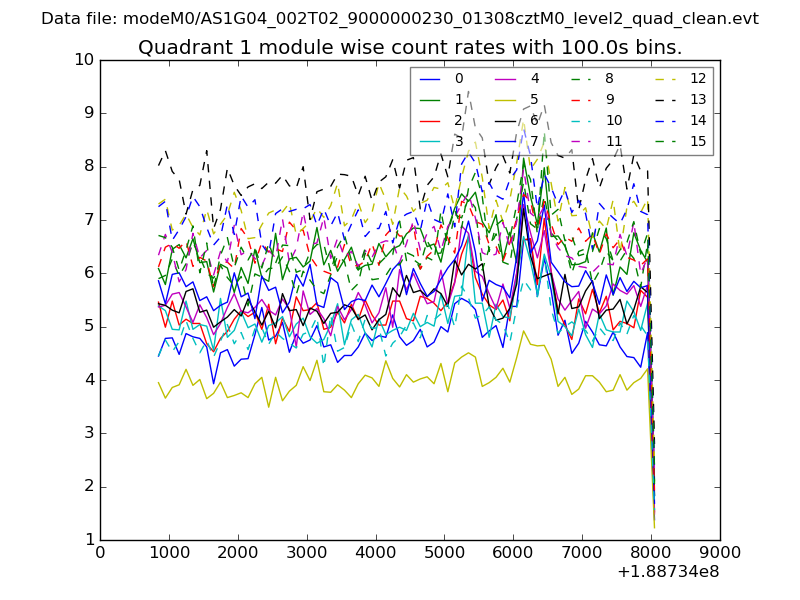
| Module-wise count rates for Quadrant A Data is divided into 100 sec bins |
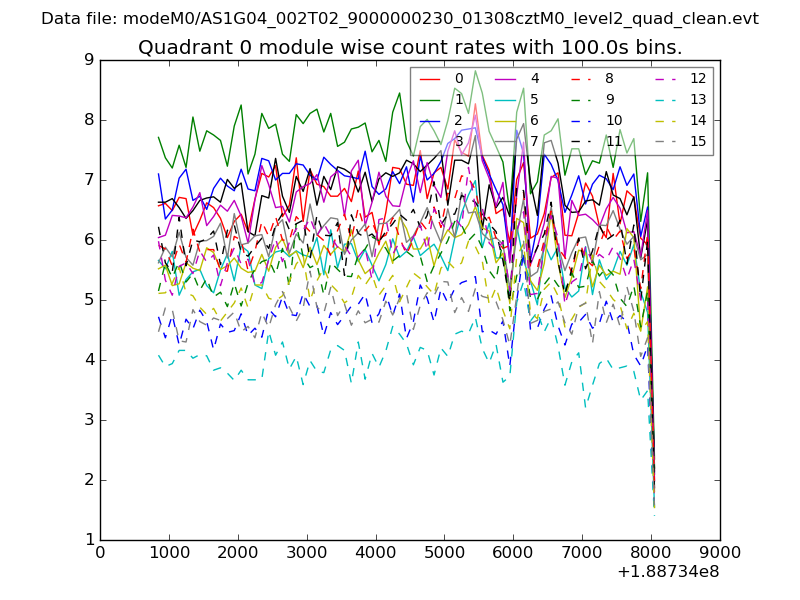 |
 |
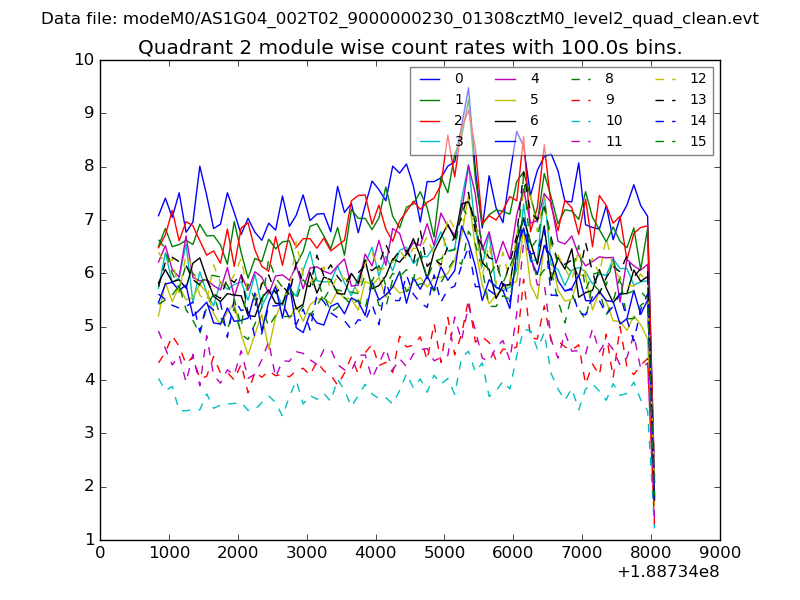
| Module-wise count rates for Quadrant B Data is divided into 100 sec bins |
 |
 |
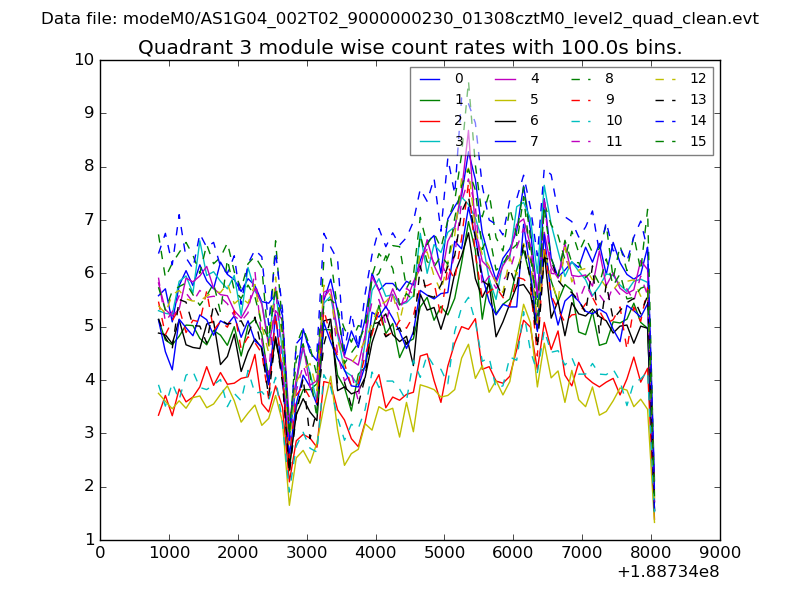
| Module-wise count rates for Quadrant C Data is divided into 100 sec bins |
 |
 |
| Module-wise count rates for Quadrant D Data is divided into 100 sec bins |
 |
 |
| Parameter | Plot |
|---|---|
| CZT HV Monitor | 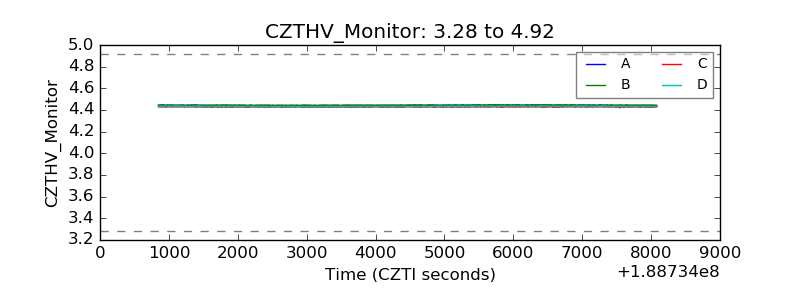 |
| D_VDD | 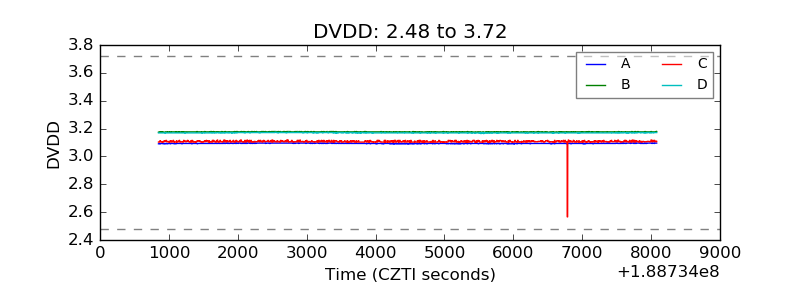 |
| Temperature 1 | 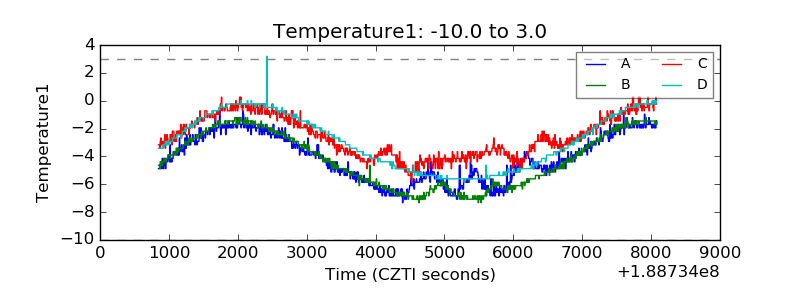 |
| Veto HV Monitor | 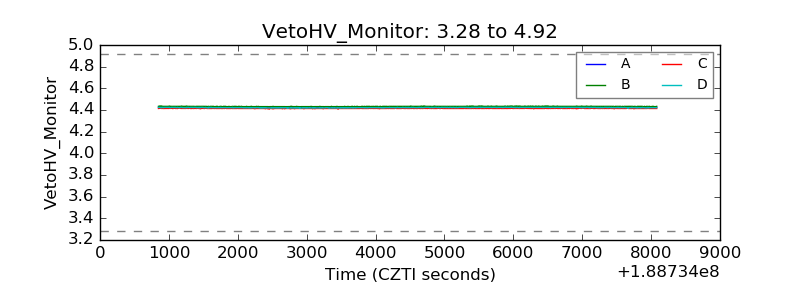 |
| Veto LLD | 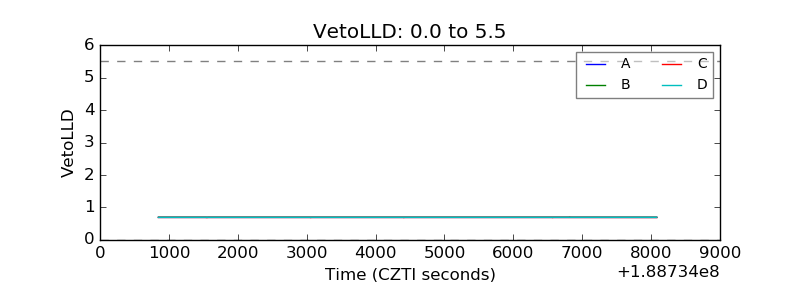 |
| Alpha Counter | 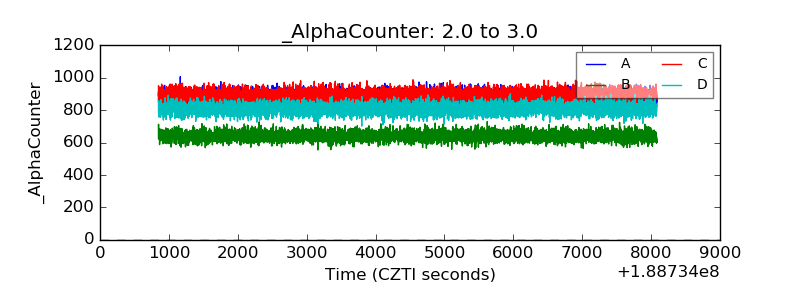 |
| _CPM_Rate | 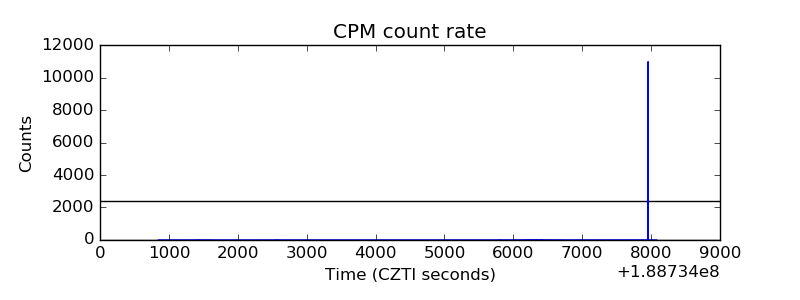 |
| CZT Counter | 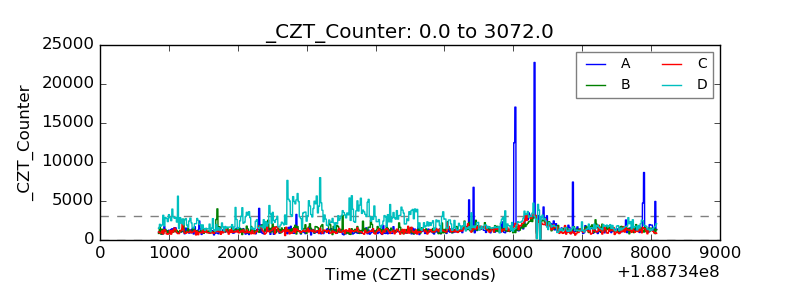 |
| +2.5 Volts monitor |  |
| +5 Volts monitor |  |
| _ROLL_ROT | 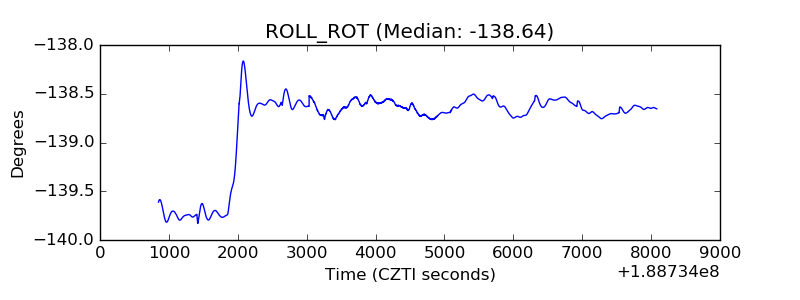 |
| _Roll_DEC | 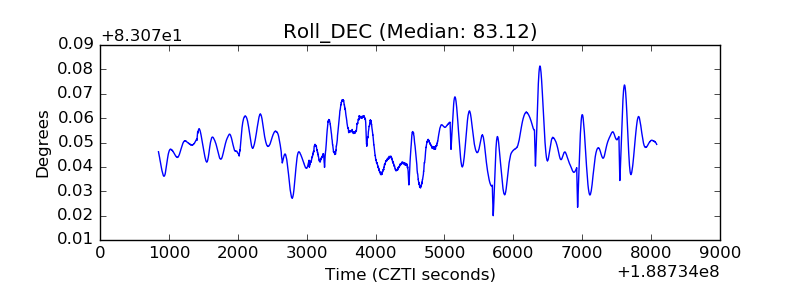 |
| _Roll_RA | 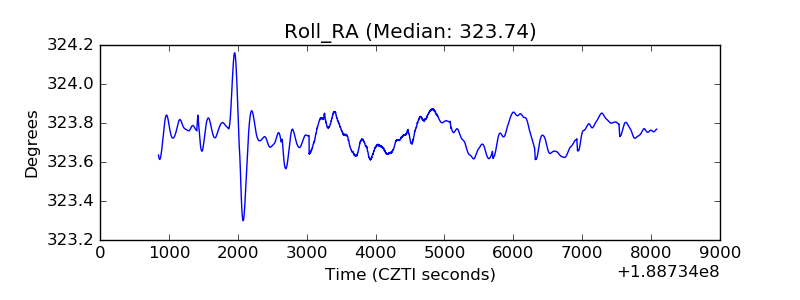 |
| Veto Counter | 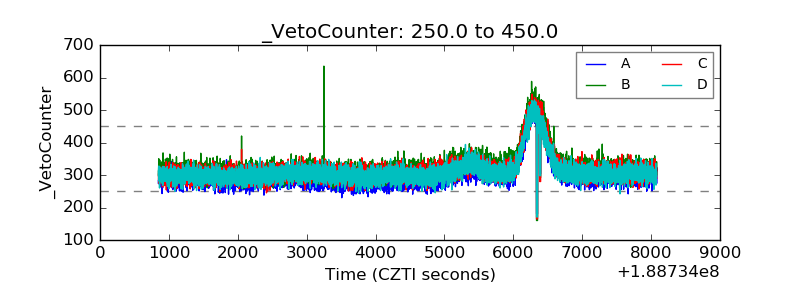 |