| Param | Original file | Final file |
|---|---|---|
| Filename | modeM0/AS1G04_002T02_9000000230_01309cztM0_level2.evt | modeM0/AS1G04_002T02_9000000230_01309cztM0_level2_quad_clean.evt |
| Size (bytes) | 1,405,673,280 | 98,369,280 |
| Size | 1.3 GB | 93.8 MB |
| Events in quadrant A | 8,581,359 | 654,967 |
| Events in quadrant B | 9,383,417 | 656,392 |
| Events in quadrant C | 8,354,483 | 635,032 |
| Events in quadrant D | 15,802,665 | 555,792 |
| Mode M9 | |||
|---|---|---|---|
| Quadrant | BADHDUFLAG | Total packets | Discarded packets |
| A | 0 | 3 | 0 |
| B | 0 | 3 | 0 |
| C | 0 | 3 | 0 |
| D | 0 | 3 | 0 |
| Mode M0 | |||
|---|---|---|---|
| Quadrant | BADHDUFLAG | Total packets | Discarded packets |
| A | 0 | 30358 | 2 |
| B | 0 | 32728 | 1 |
| C | 0 | 29663 | 1 |
| D | 0 | 51969 | 1 |
| Mode SS | |||
|---|---|---|---|
| Quadrant | BADHDUFLAG | Total packets | Discarded packets |
| A | 0 | 140 | 0 |
| B | 0 | 140 | 0 |
| C | 0 | 140 | 0 |
| D | 0 | 140 | 0 |
| Quadrant | Total seconds | Saturated seconds | Saturation percentage |
|---|---|---|---|
| A | 6828 | 109 | 1.596368% |
| B | 6828 | 38 | 0.556532% |
| C | 6828 | 22 | 0.322203% |
| D | 6828 | 1690 | 24.751025% |
Noise dominated data is calculated using 1-second bins in cleaned event files. If a bin has >2000 counts, and if more than 50% of those come from <1% of pixels, then it is considered to be noise-dominated and hence unusable.
| Quadrant | # 1 sec bins | Bins with >0 counts | Bins with >2000 counts | High rate bins dominated by noise | Noise dominated (total time) | Noise dominated (detector-on time) | Marked lightcurve |
|---|---|---|---|---|---|---|---|
| A | 7193 | 6828 | 405 | 405 | 5.63% | 5.93% | 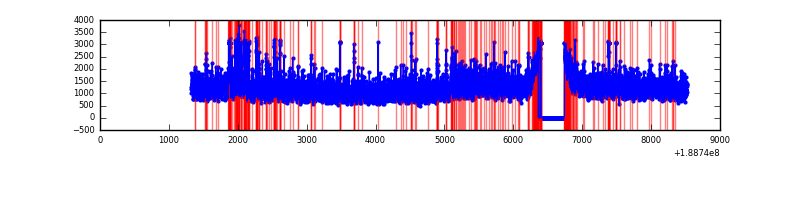 |
| B | 7193 | 6830 | 567 | 567 | 7.88% | 8.30% | 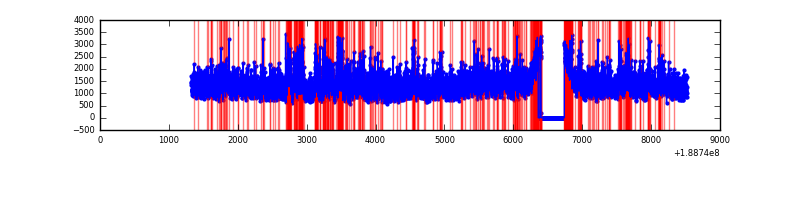 |
| C | 7193 | 6828 | 213 | 213 | 2.96% | 3.12% | 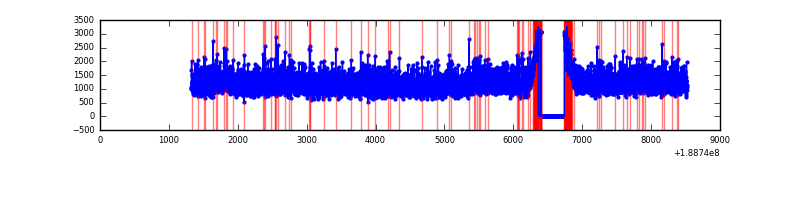 |
| D | 7193 | 6828 | 4348 | 4348 | 60.45% | 63.68% | 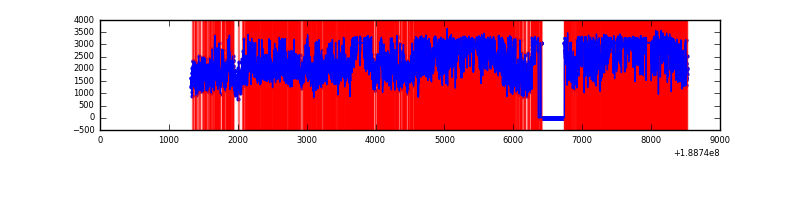 |
Top three noisy pixels from each quadrant. If the there are fewer than three noisy pixels in the level2.evt file, extra rows are filled as -1
| Pixel properties | Quadrant properties | ||||||
|---|---|---|---|---|---|---|---|
| Quadrant | DetID | PixID | Counts | Sigma | Mean | Median | Sigma |
| A | 4 | 32 | 380945 | 745.06 | 2110 | 2126 | 508.4 |
| A | 12 | 133 | 38033 | 70.62 | 2110 | 2126 | 508.4 |
| A | 15 | 127 | 24073 | 43.17 | 2110 | 2126 | 508.4 |
| B | 8 | 4 | 772456 | 1490.77 | 2179 | 2190 | 516.7 |
| B | 12 | 52 | 130249 | 247.85 | 2179 | 2190 | 516.7 |
| B | 6 | 53 | 84887 | 160.05 | 2179 | 2190 | 516.7 |
| C | 15 | 241 | 331306 | 589.37 | 1996 | 2066 | 558.6 |
| C | 8 | 208 | 67767 | 117.61 | 1996 | 2066 | 558.6 |
| C | 9 | 52 | 57383 | 99.02 | 1996 | 2066 | 558.6 |
| D | 13 | 169 | 8066281 | 14250.62 | 1830 | 1892 | 565.9 |
| D | 12 | 22 | 397464 | 699.02 | 1830 | 1892 | 565.9 |
| D | 10 | 84 | 363814 | 639.55 | 1830 | 1892 | 565.9 |
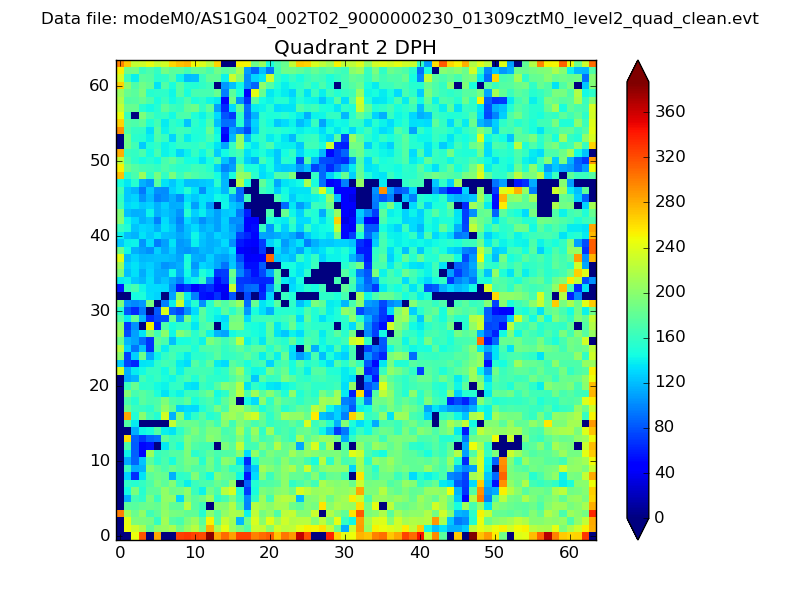
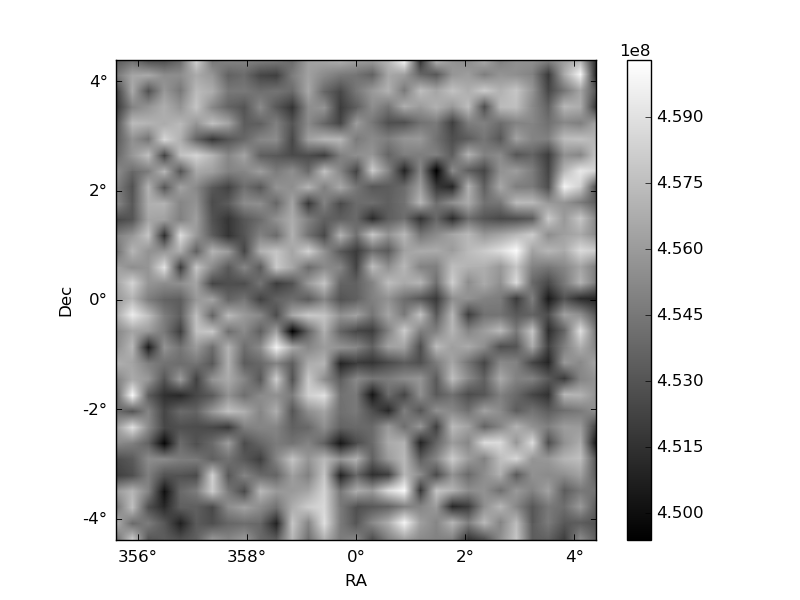
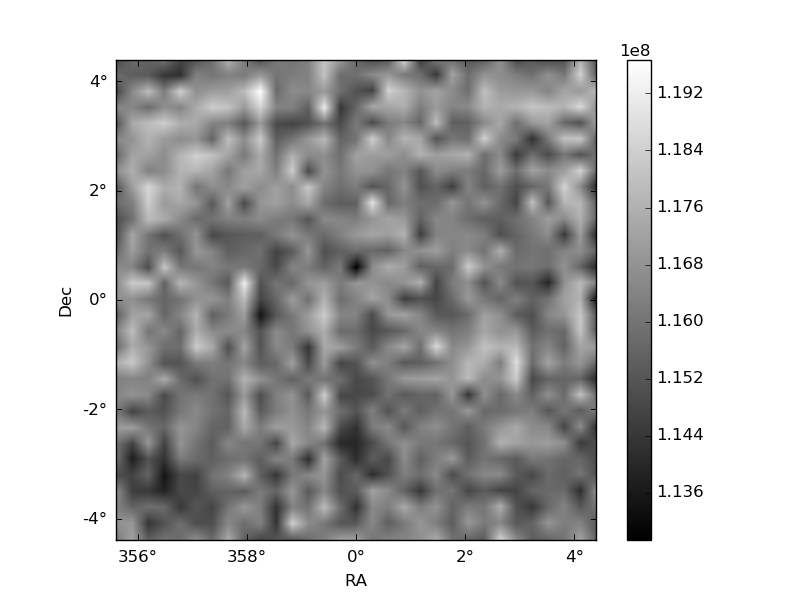
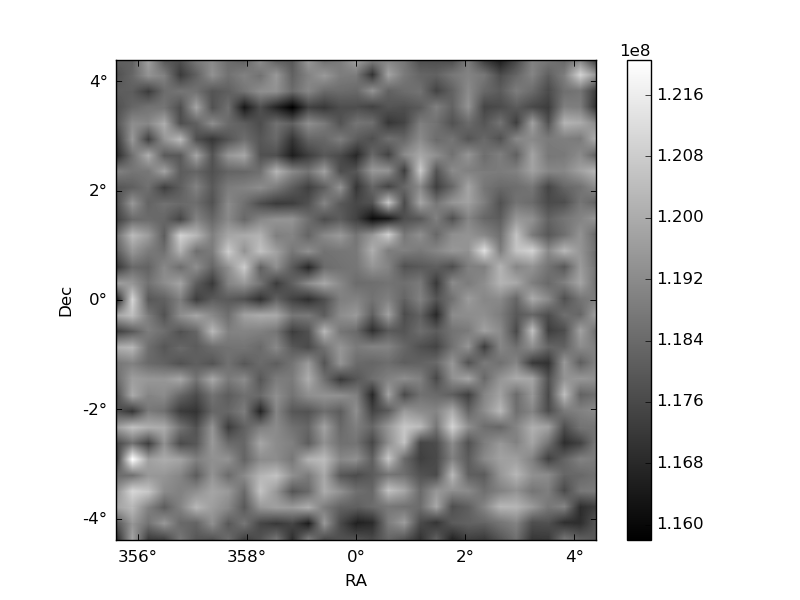
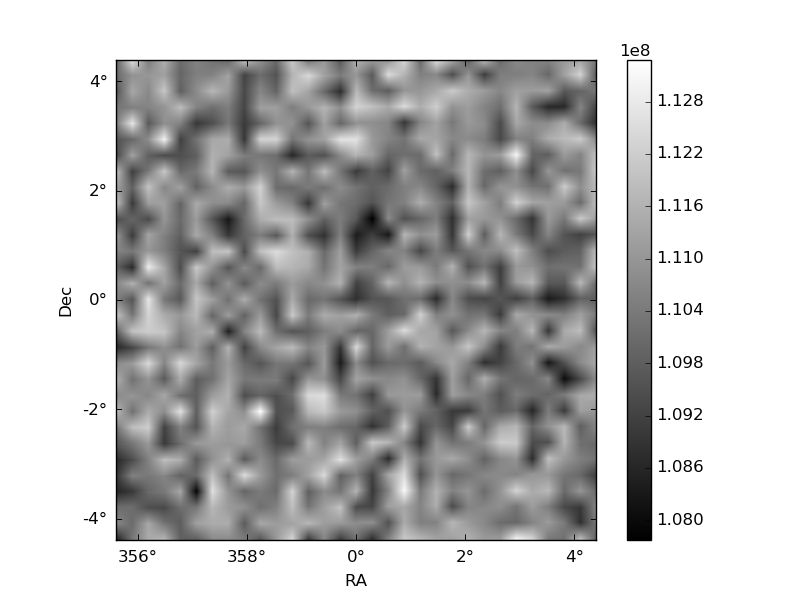
Histogram calculated using DETX and DETY for each event in the final _common_clean file
| Quadrant A | 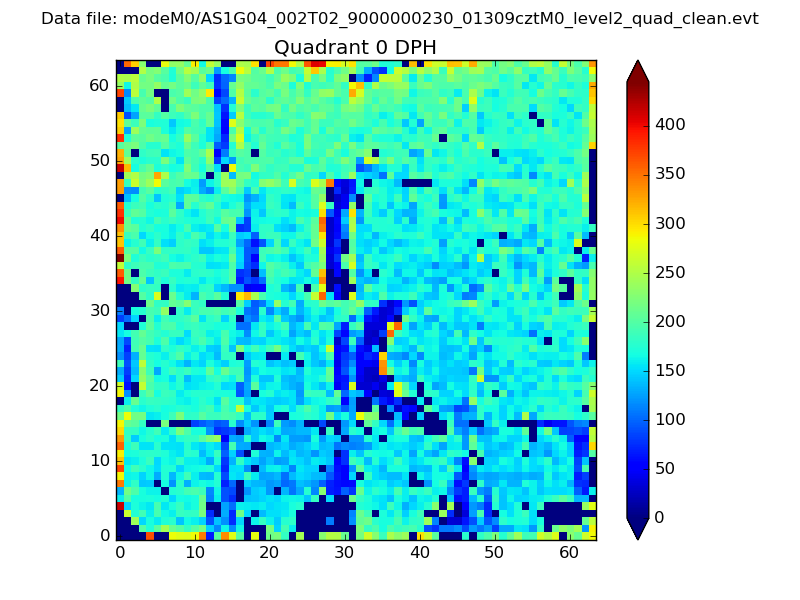 |
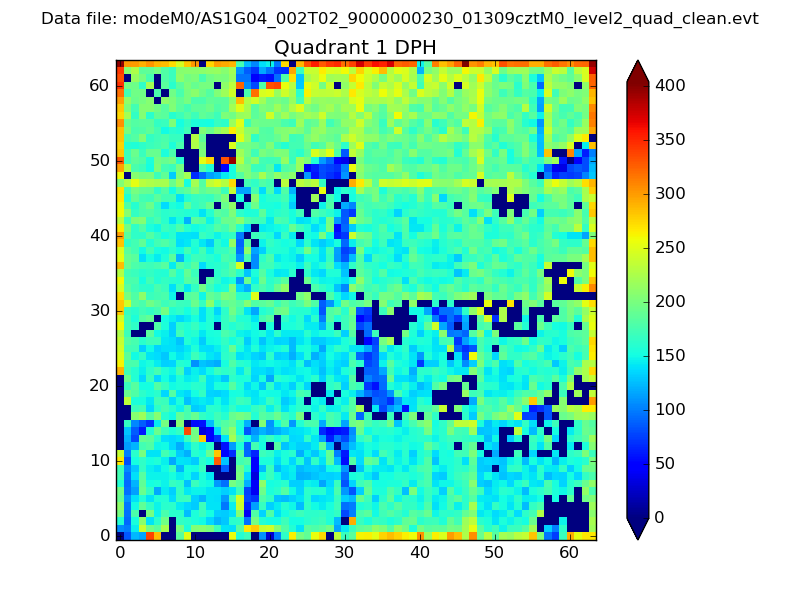 |
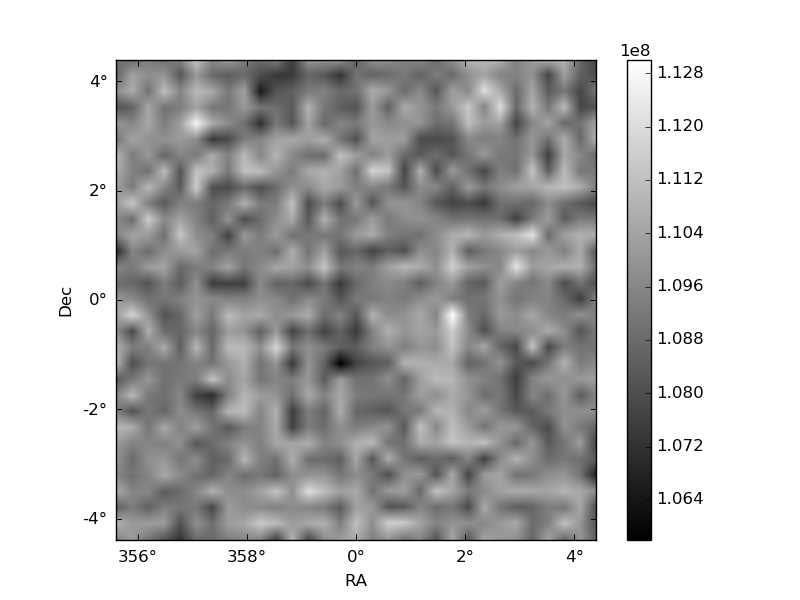
Quadrant B |
|---|---|---|---|
| Quadrant D | 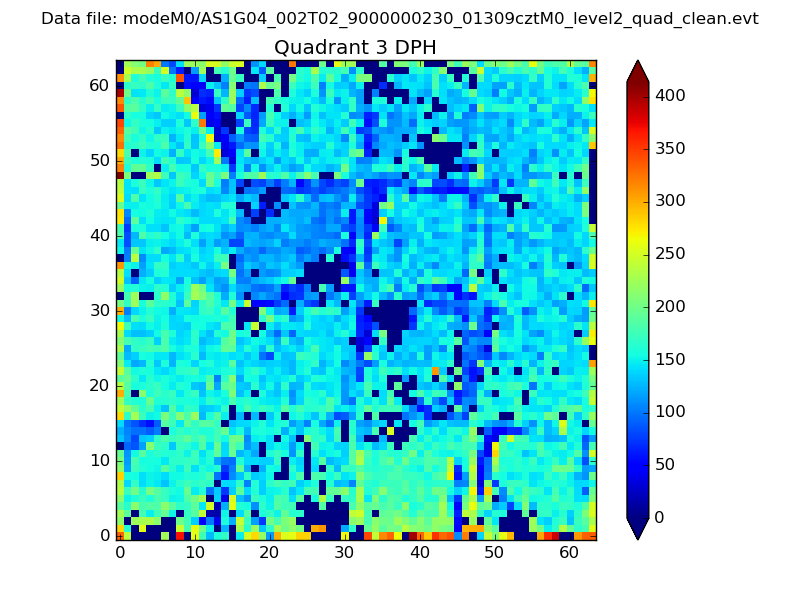 |
 |
Quadrant C |
| Plot type | Count rate plots | Images |
|---|---|---|
| Comparison with Poisson distribution Blue bars denote a histogram of data divided into 1 sec bins. Red curve is a Poisson curve with rate = median count rate of data. |
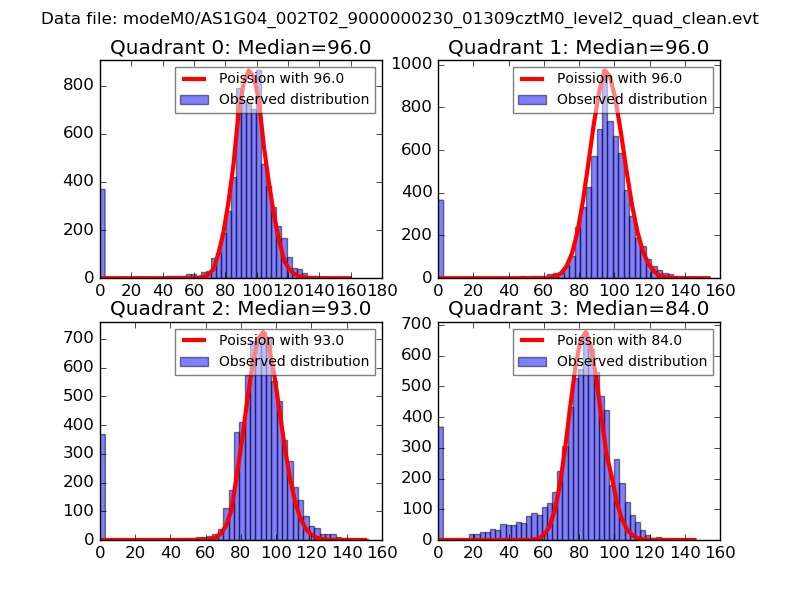 |
 |
| Quadrant-wise count rates Data is divided into 100 sec bins |
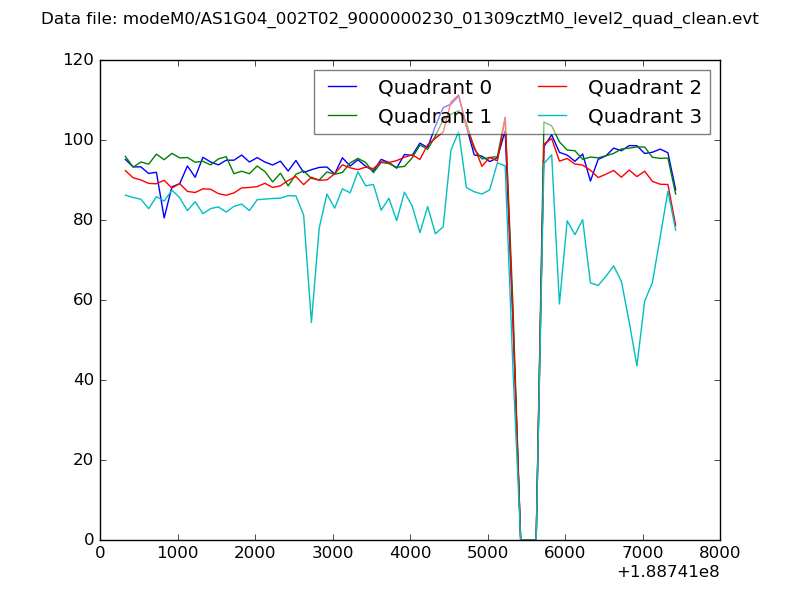 |
|
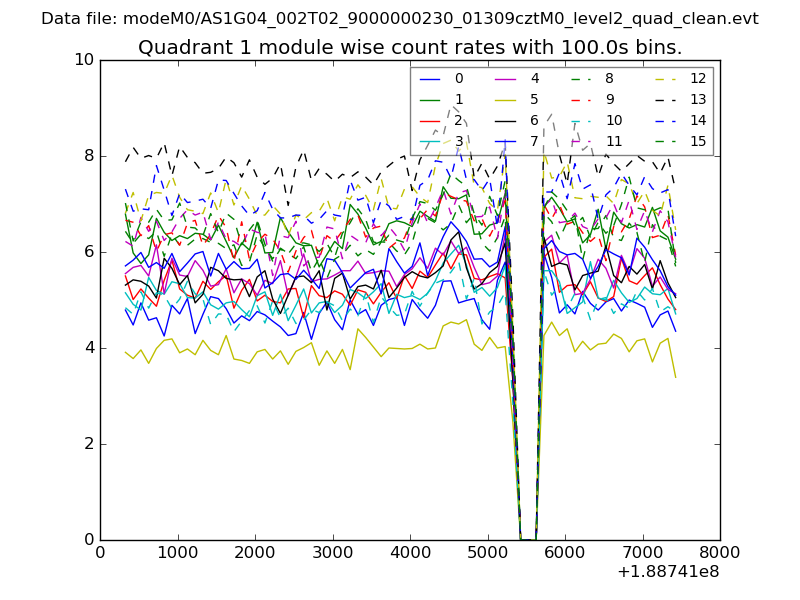
| Module-wise count rates for Quadrant A Data is divided into 100 sec bins |
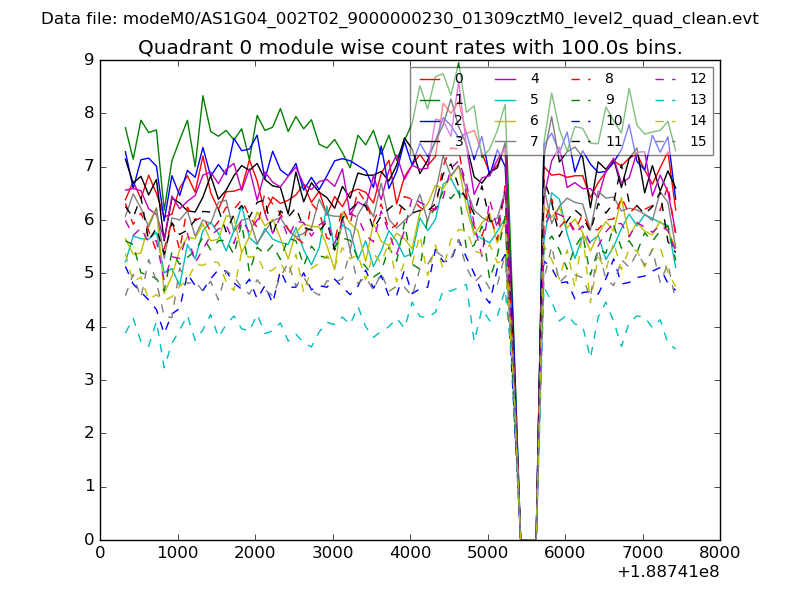 |
 |
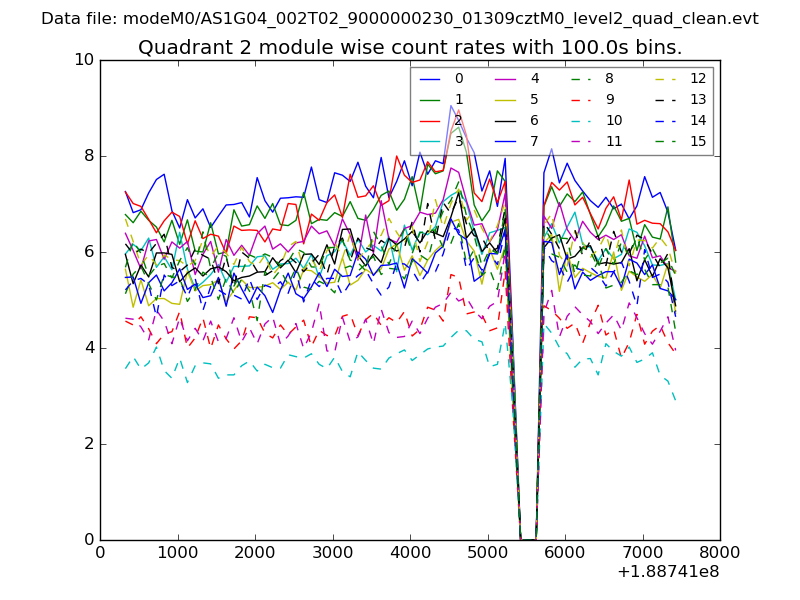
| Module-wise count rates for Quadrant B Data is divided into 100 sec bins |
 |
 |
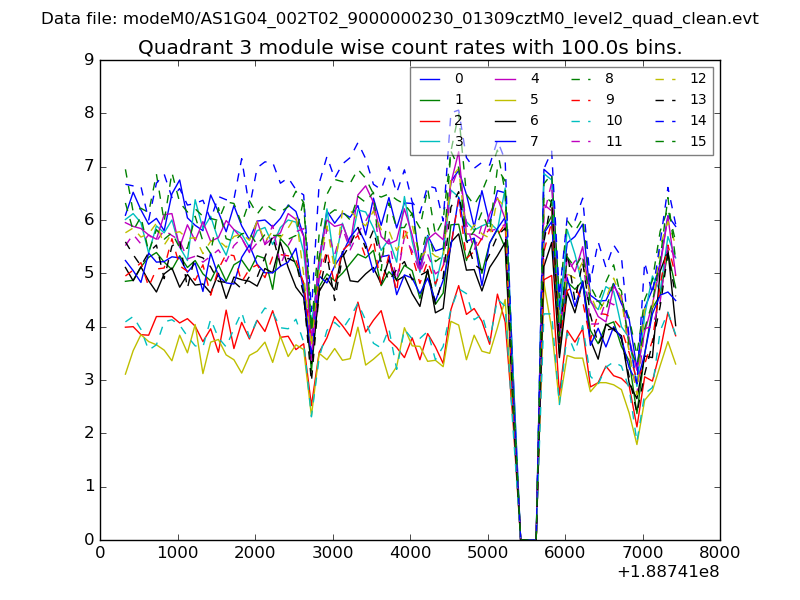
| Module-wise count rates for Quadrant C Data is divided into 100 sec bins |
 |
 |
| Module-wise count rates for Quadrant D Data is divided into 100 sec bins |
 |
 |
| Parameter | Plot |
|---|---|
| CZT HV Monitor | 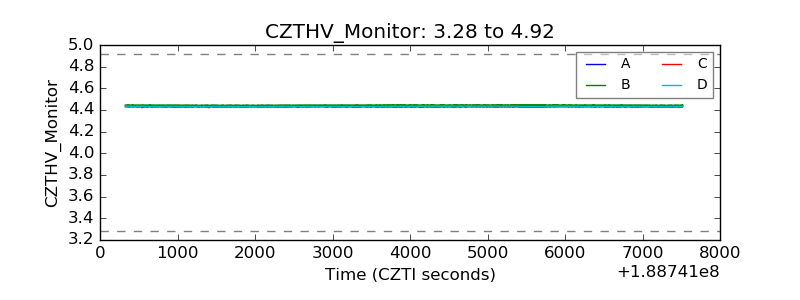 |
| D_VDD | 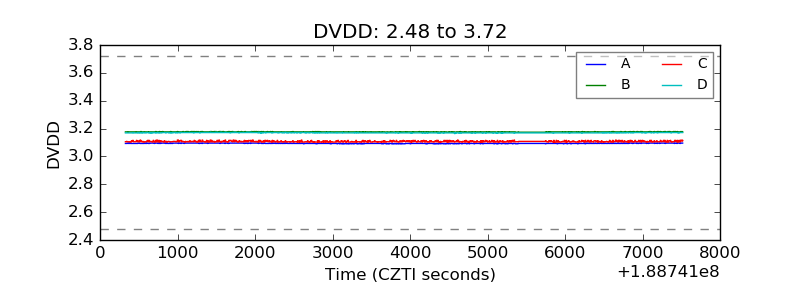 |
| Temperature 1 | 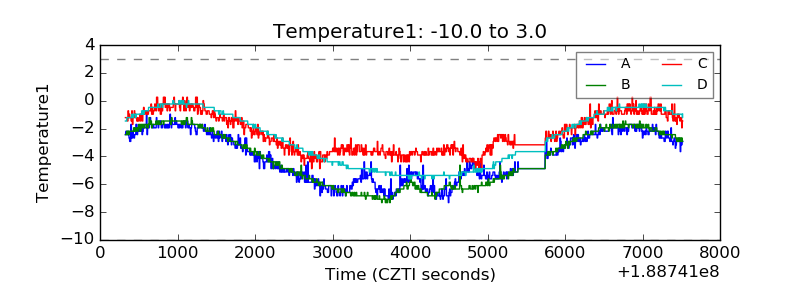 |
| Veto HV Monitor | 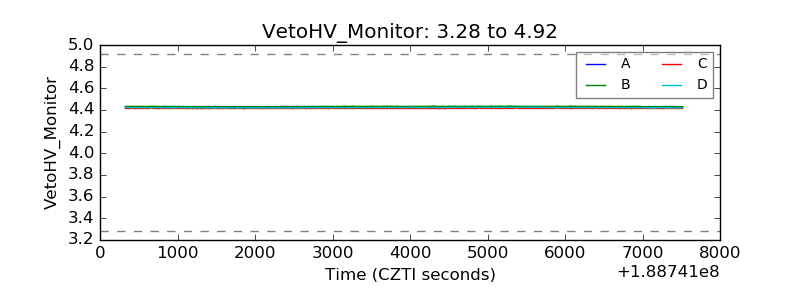 |
| Veto LLD | 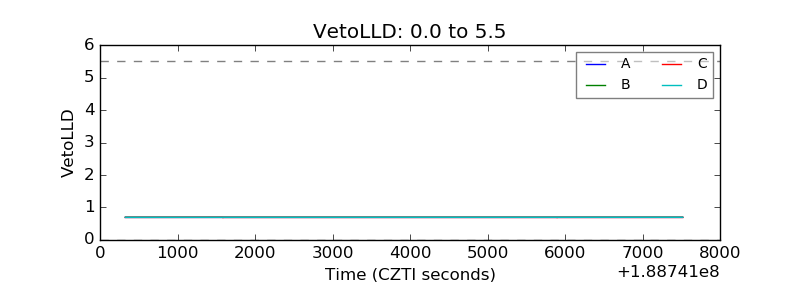 |
| Alpha Counter | 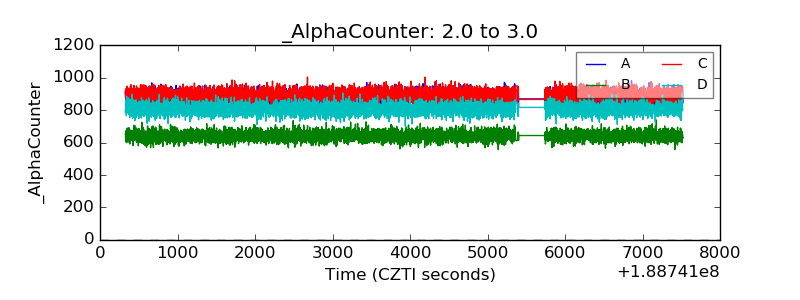 |
| _CPM_Rate | 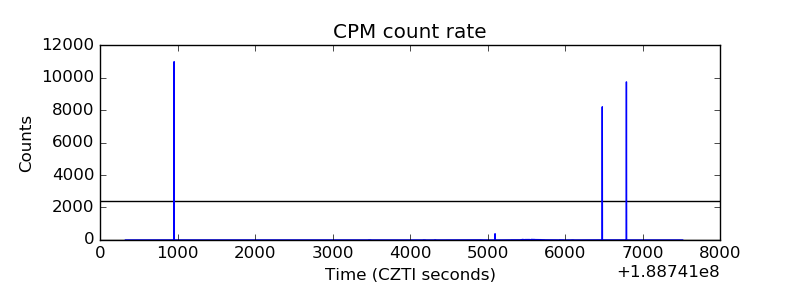 |
| CZT Counter | 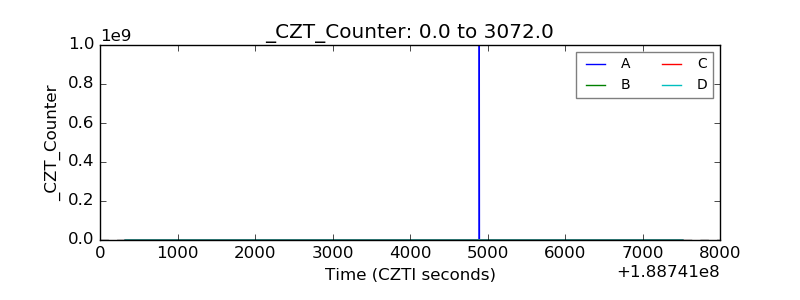 |
| +2.5 Volts monitor | 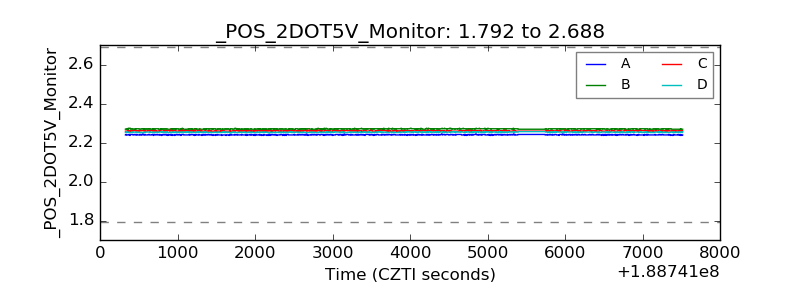 |
| +5 Volts monitor | 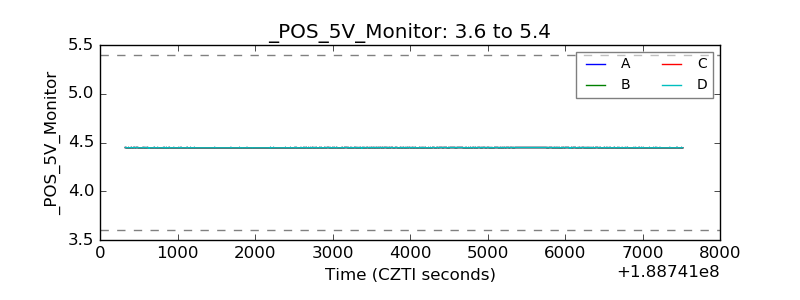 |
| _ROLL_ROT | 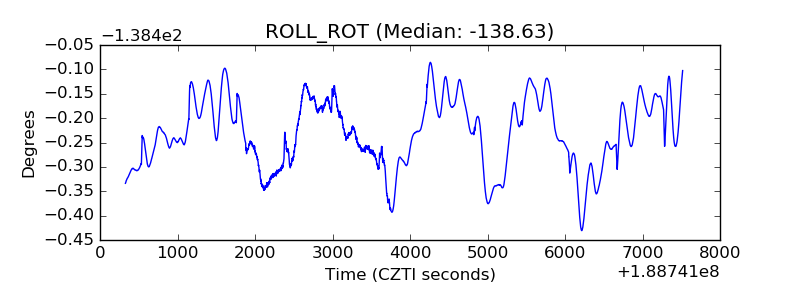 |
| _Roll_DEC | 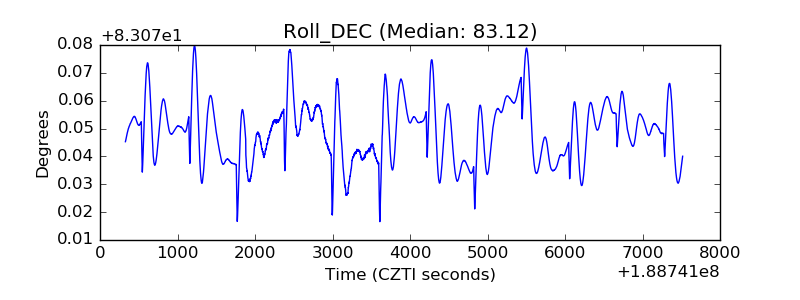 |
| _Roll_RA | 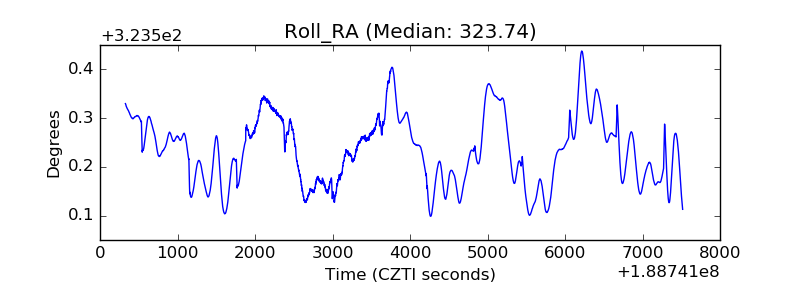 |
| Veto Counter | 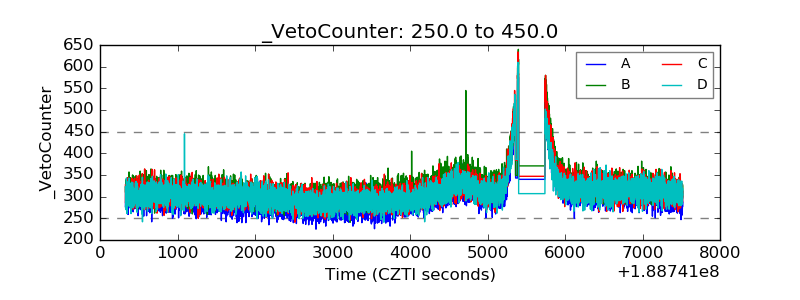 |