| Param | Original file | Final file |
|---|---|---|
| Filename | modeM0/AS1G04_002T02_9000000230_01310cztM0_level2.evt | modeM0/AS1G04_002T02_9000000230_01310cztM0_level2_quad_clean.evt |
| Size (bytes) | 1,273,426,560 | 97,989,120 |
| Size | 1.2 GB | 93.4 MB |
| Events in quadrant A | 8,320,384 | 649,770 |
| Events in quadrant B | 8,914,562 | 649,880 |
| Events in quadrant C | 8,182,206 | 627,602 |
| Events in quadrant D | 12,705,248 | 570,970 |
| Mode M9 | |||
|---|---|---|---|
| Quadrant | BADHDUFLAG | Total packets | Discarded packets |
| A | 0 | 6 | 0 |
| B | 0 | 6 | 0 |
| C | 0 | 6 | 0 |
| D | 0 | 6 | 0 |
| Mode M0 | |||
|---|---|---|---|
| Quadrant | BADHDUFLAG | Total packets | Discarded packets |
| A | 0 | 29510 | 2 |
| B | 0 | 31256 | 1 |
| C | 0 | 29068 | 1 |
| D | 0 | 42666 | 1 |
| Mode SS | |||
|---|---|---|---|
| Quadrant | BADHDUFLAG | Total packets | Discarded packets |
| A | 0 | 136 | 0 |
| B | 0 | 136 | 0 |
| C | 0 | 136 | 0 |
| D | 0 | 136 | 0 |
| Quadrant | Total seconds | Saturated seconds | Saturation percentage |
|---|---|---|---|
| A | 6725 | 64 | 0.951673% |
| B | 6725 | 44 | 0.654275% |
| C | 6725 | 15 | 0.223048% |
| D | 6725 | 1273 | 18.929368% |
Noise dominated data is calculated using 1-second bins in cleaned event files. If a bin has >2000 counts, and if more than 50% of those come from <1% of pixels, then it is considered to be noise-dominated and hence unusable.
| Quadrant | # 1 sec bins | Bins with >0 counts | Bins with >2000 counts | High rate bins dominated by noise | Noise dominated (total time) | Noise dominated (detector-on time) | Marked lightcurve |
|---|---|---|---|---|---|---|---|
| A | 7325 | 6726 | 345 | 345 | 4.71% | 5.13% | 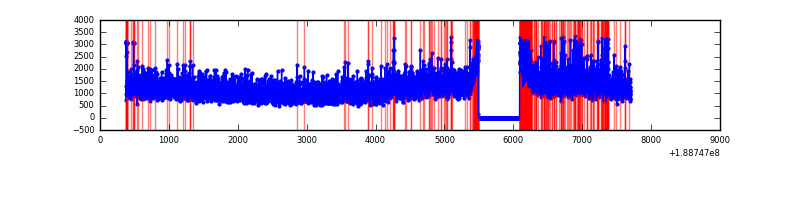 |
| B | 7325 | 6726 | 526 | 526 | 7.18% | 7.82% | 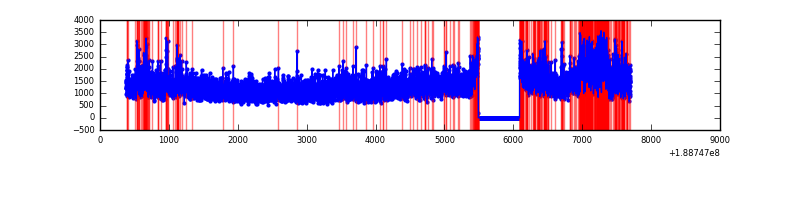 |
| C | 7325 | 6725 | 189 | 189 | 2.58% | 2.81% |  |
| D | 7325 | 6725 | 2621 | 2621 | 35.78% | 38.97% | 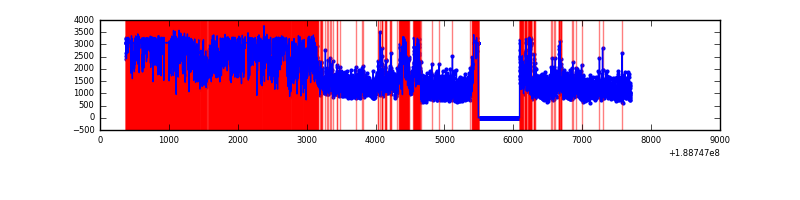 |
Top three noisy pixels from each quadrant. If the there are fewer than three noisy pixels in the level2.evt file, extra rows are filled as -1
| Pixel properties | Quadrant properties | ||||||
|---|---|---|---|---|---|---|---|
| Quadrant | DetID | PixID | Counts | Sigma | Mean | Median | Sigma |
| A | 0 | 128 | 321472 | 651.57 | 2040 | 2055 | 490.2 |
| A | 4 | 32 | 53640 | 105.23 | 2040 | 2055 | 490.2 |
| A | 12 | 133 | 37775 | 72.86 | 2040 | 2055 | 490.2 |
| B | 8 | 4 | 698156 | 1392.48 | 2119 | 2128 | 499.8 |
| B | 6 | 53 | 52667 | 101.11 | 2119 | 2128 | 499.8 |
| B | 12 | 52 | 38295 | 72.36 | 2119 | 2128 | 499.8 |
| C | 15 | 241 | 321543 | 579.61 | 1961 | 2032 | 551.3 |
| C | 9 | 52 | 109936 | 195.74 | 1961 | 2032 | 551.3 |
| C | 3 | 79 | 39252 | 67.52 | 1961 | 2032 | 551.3 |
| D | 13 | 169 | 5269071 | 9394.28 | 1808 | 1868 | 560.7 |
| D | 12 | 22 | 328855 | 583.19 | 1808 | 1868 | 560.7 |
| D | 10 | 84 | 211543 | 373.96 | 1808 | 1868 | 560.7 |
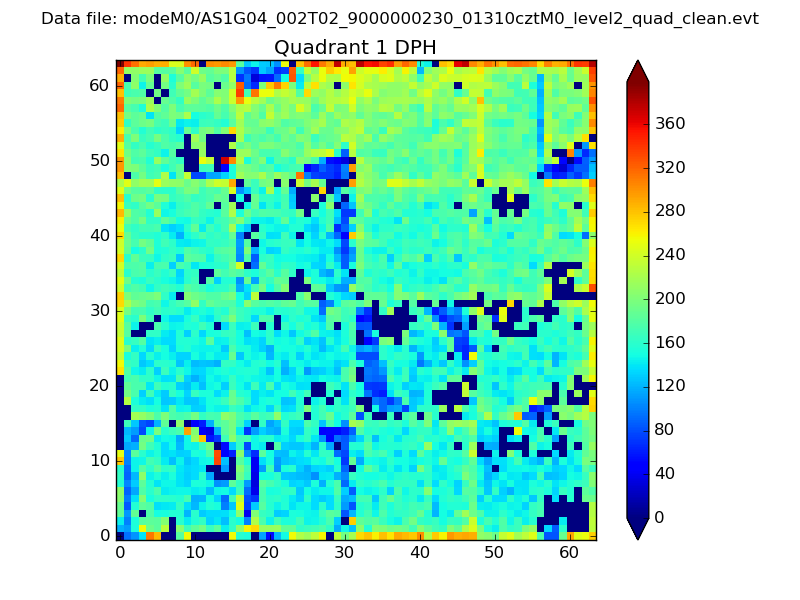
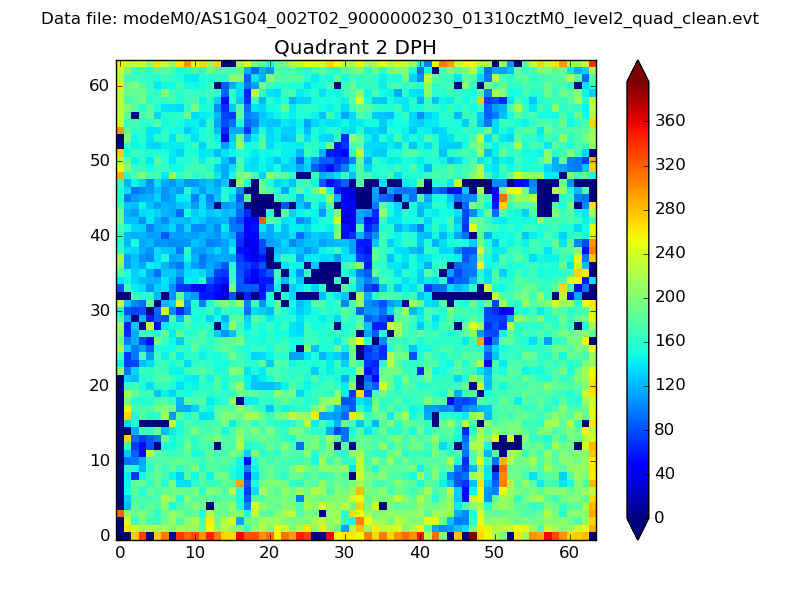
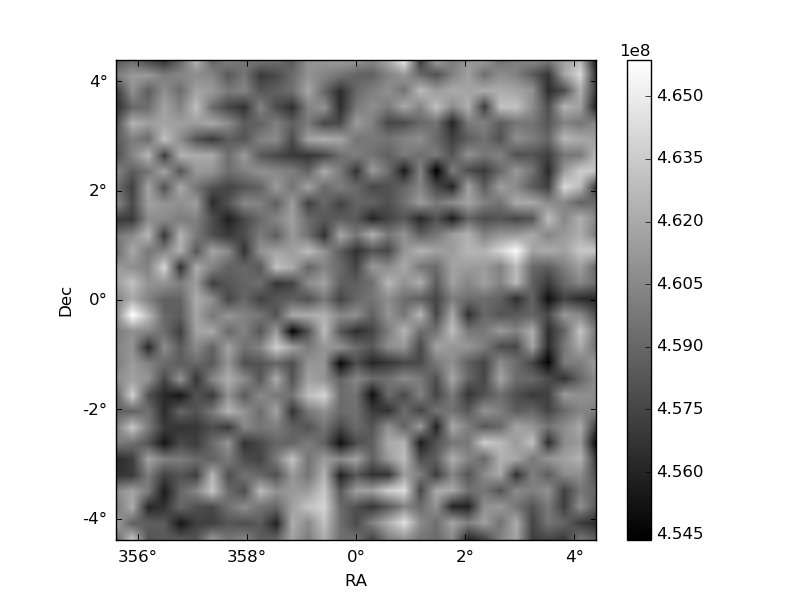
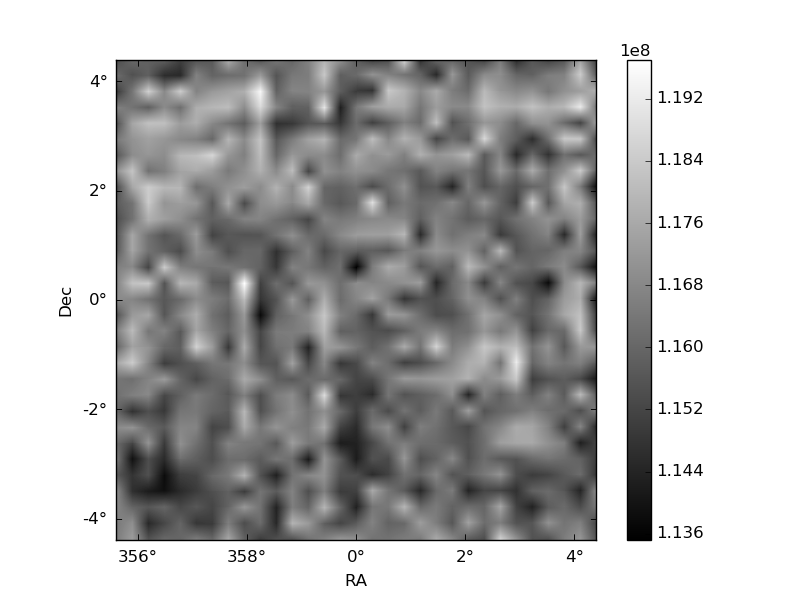
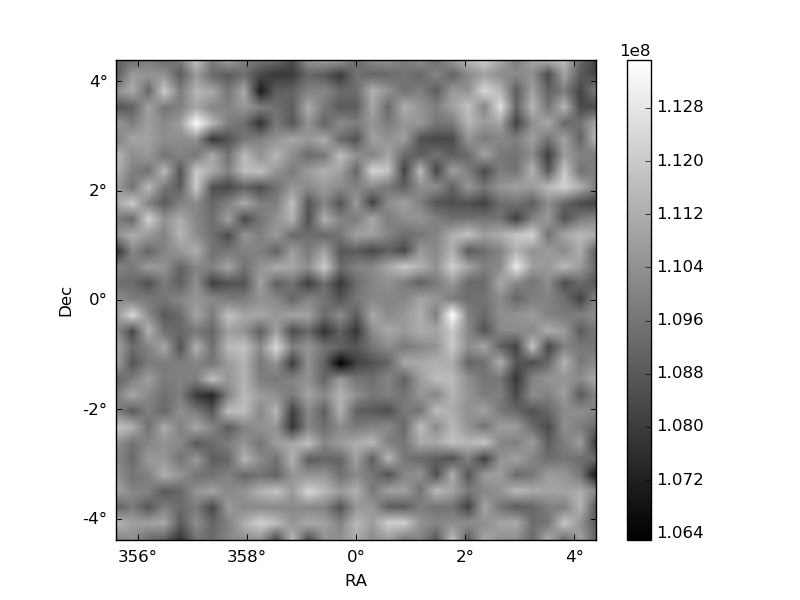
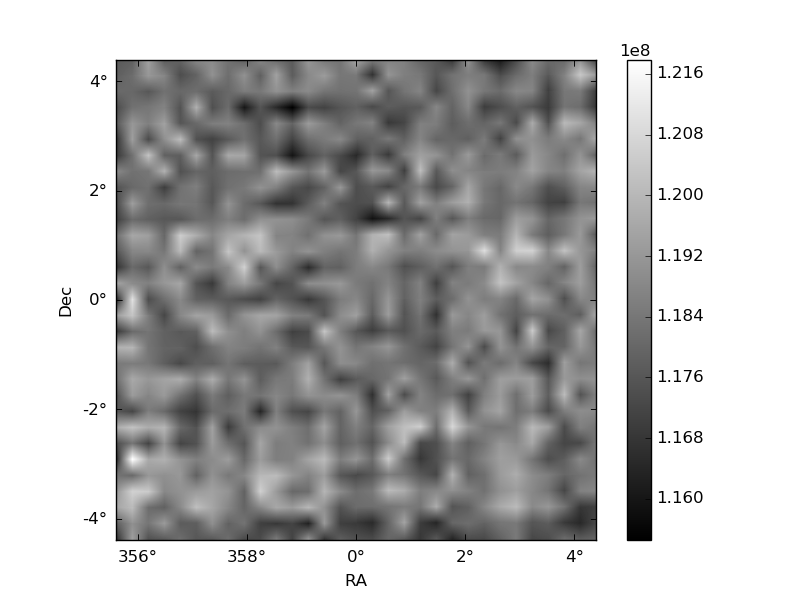
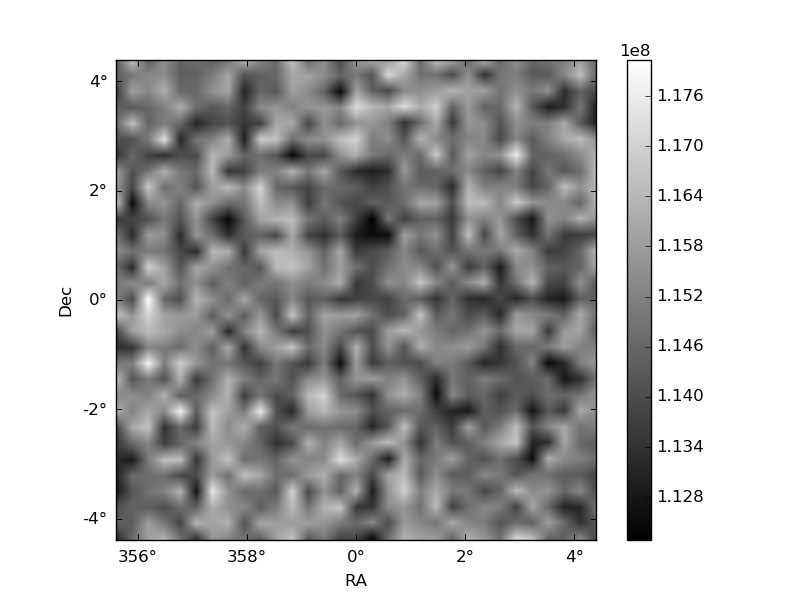
Histogram calculated using DETX and DETY for each event in the final _common_clean file
| Quadrant A | 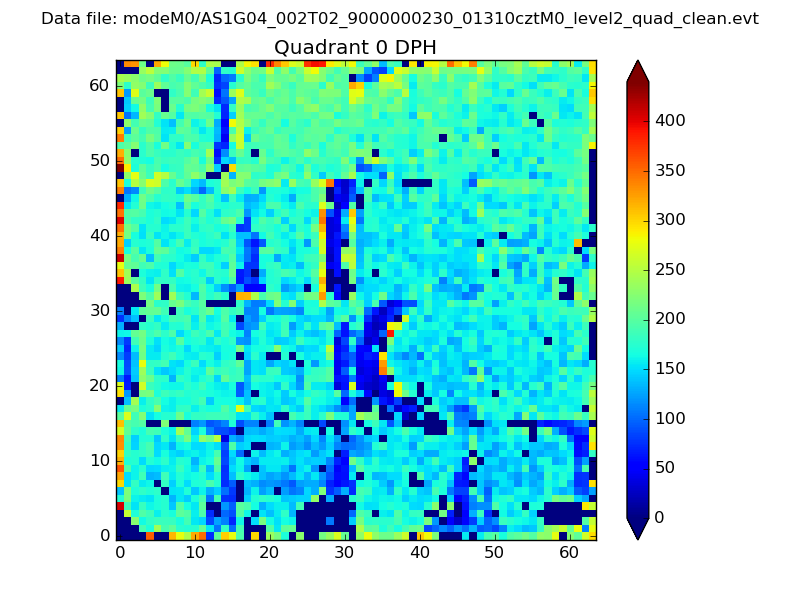 |
 |
Quadrant B |
|---|---|---|---|
| Quadrant D | 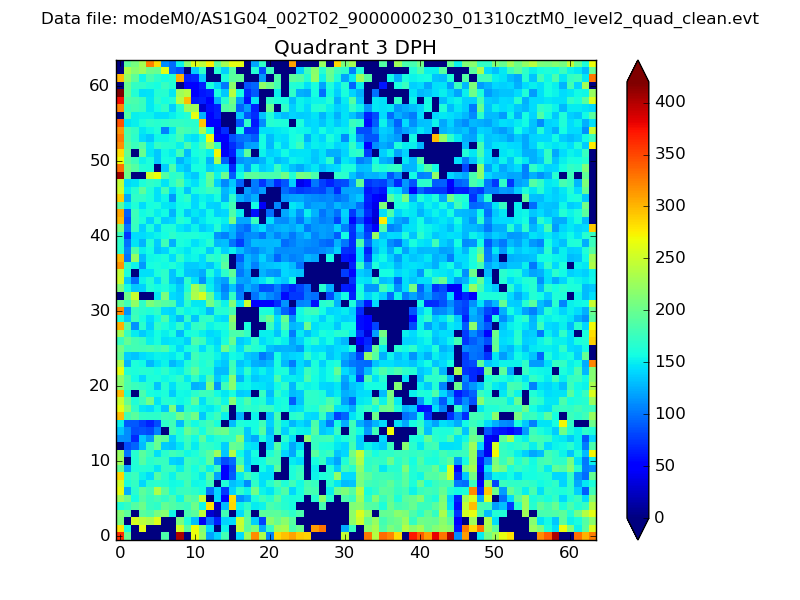 |
 |
Quadrant C |
| Plot type | Count rate plots | Images |
|---|---|---|
| Comparison with Poisson distribution Blue bars denote a histogram of data divided into 1 sec bins. Red curve is a Poisson curve with rate = median count rate of data. |
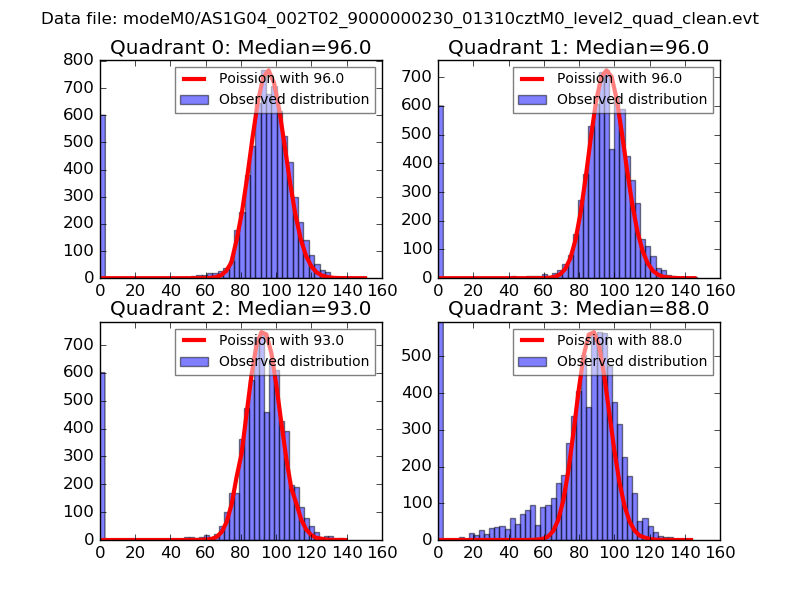 |
 |
| Quadrant-wise count rates Data is divided into 100 sec bins |
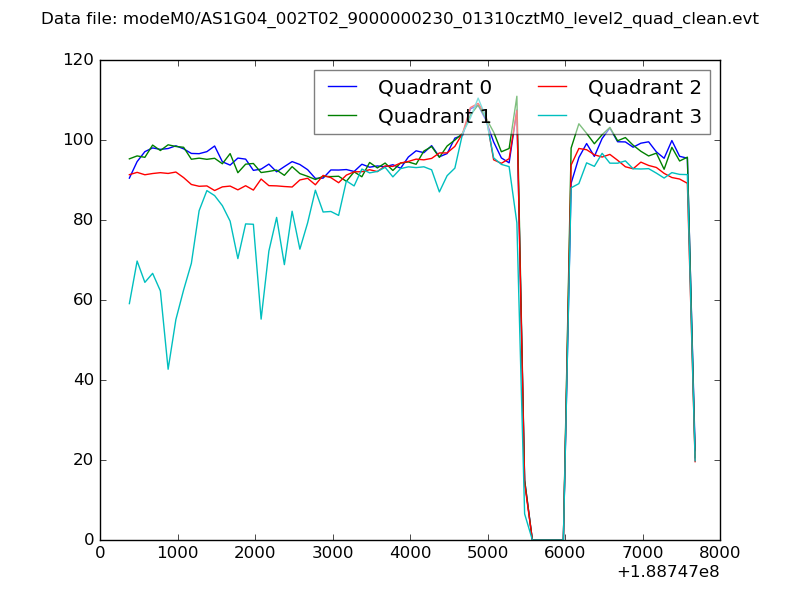 |
|
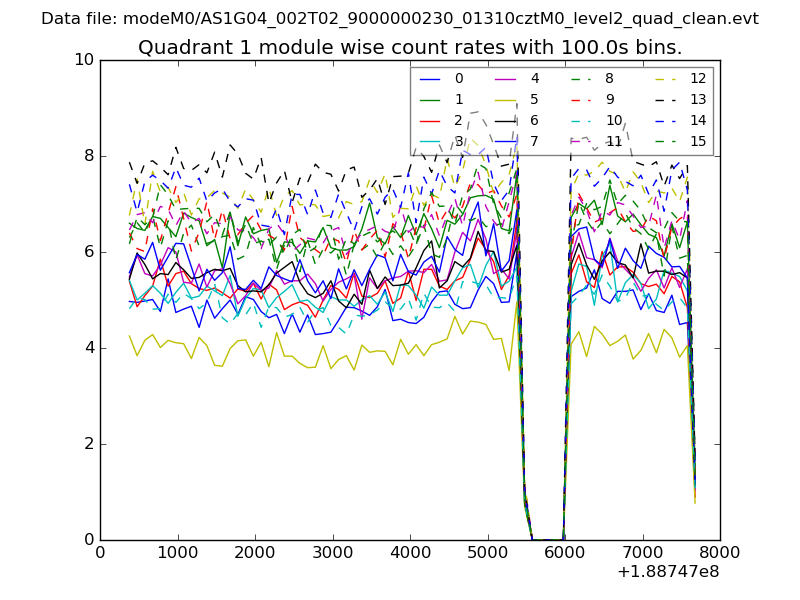
| Module-wise count rates for Quadrant A Data is divided into 100 sec bins |
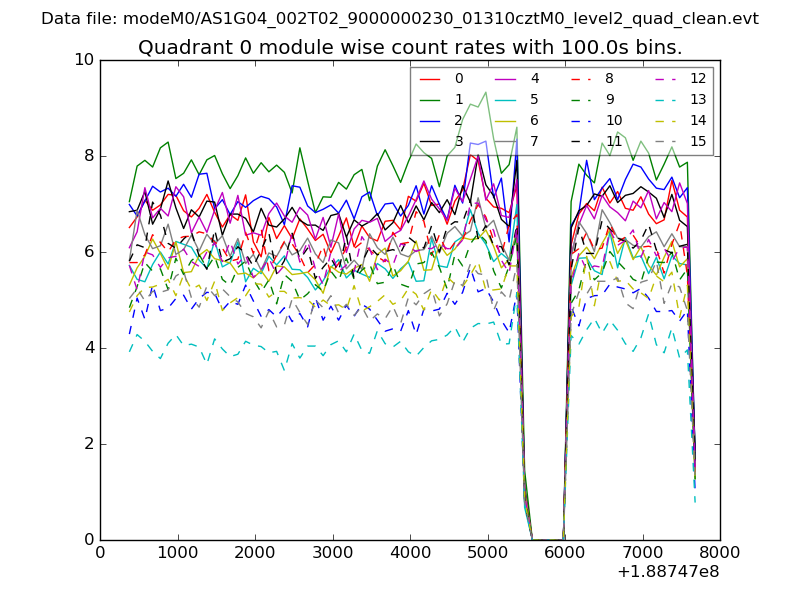 |
 |
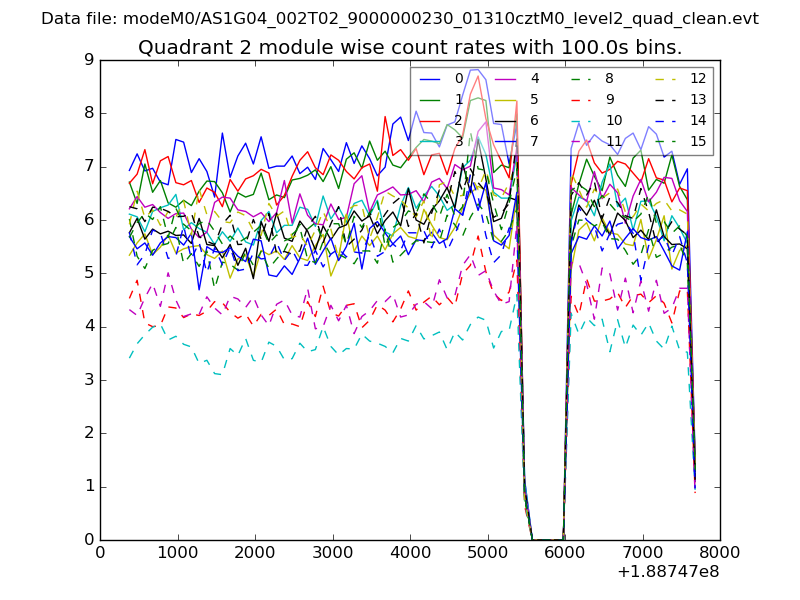
| Module-wise count rates for Quadrant B Data is divided into 100 sec bins |
 |
 |
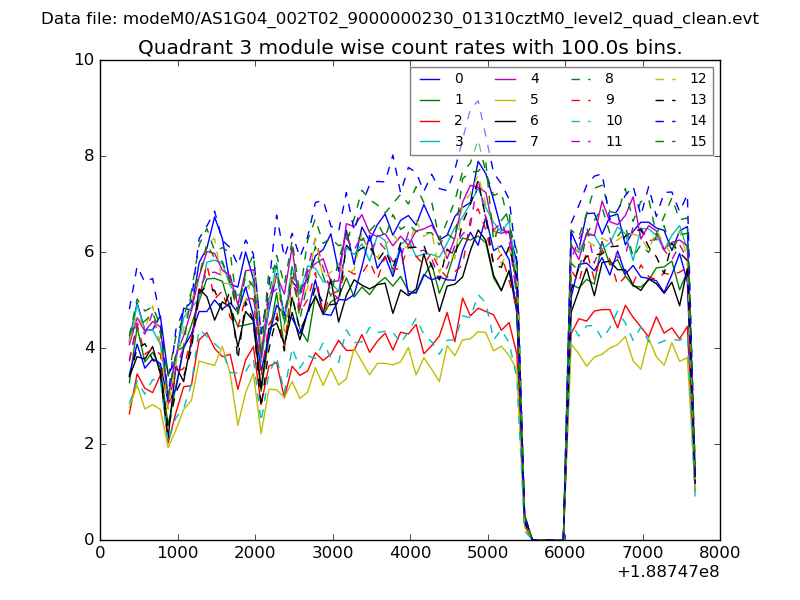
| Module-wise count rates for Quadrant C Data is divided into 100 sec bins |
 |
 |
| Module-wise count rates for Quadrant D Data is divided into 100 sec bins |
 |
 |
| Parameter | Plot |
|---|---|
| CZT HV Monitor | 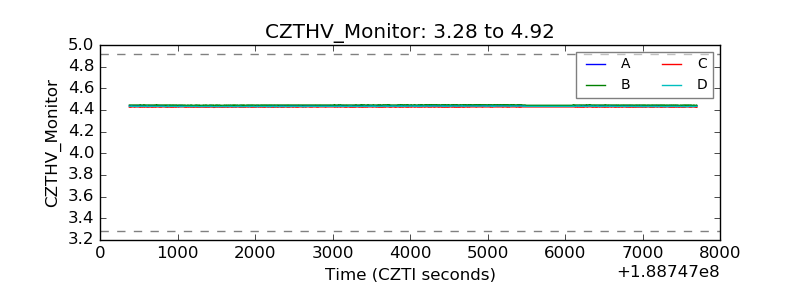 |
| D_VDD | 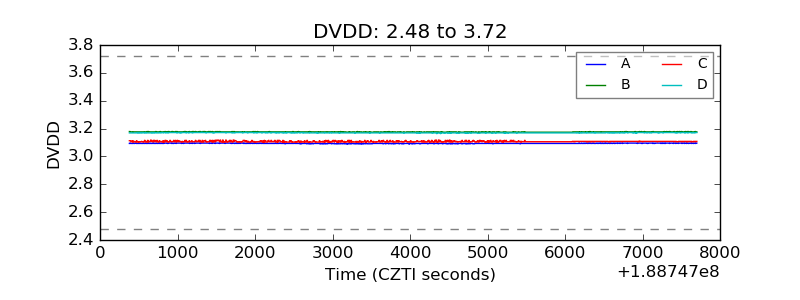 |
| Temperature 1 | 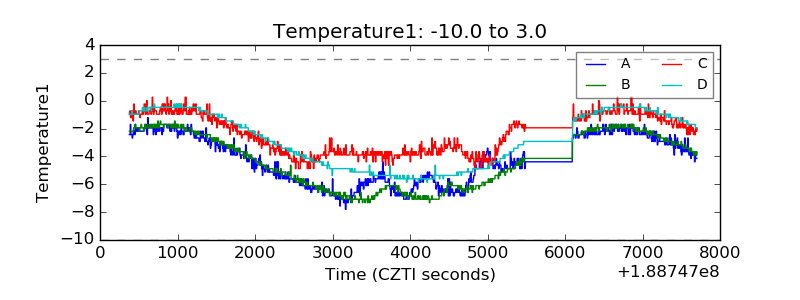 |
| Veto HV Monitor | 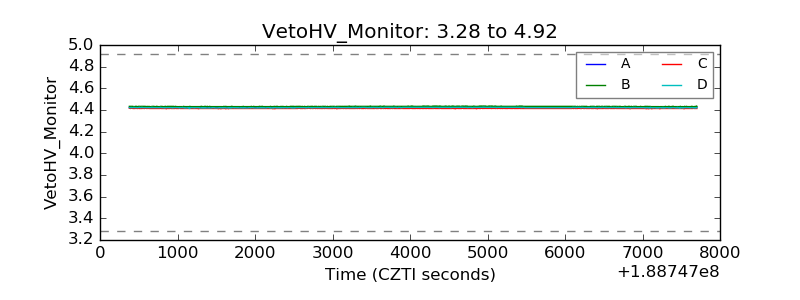 |
| Veto LLD | 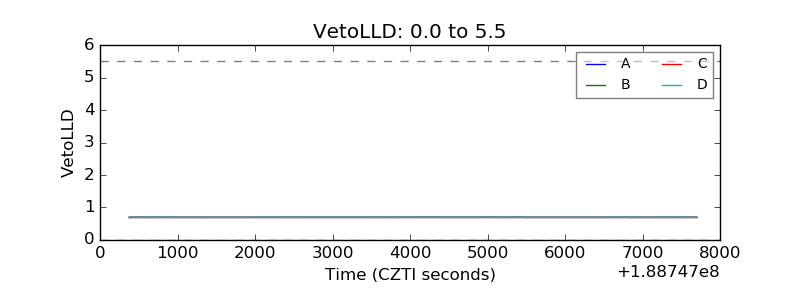 |
| Alpha Counter | 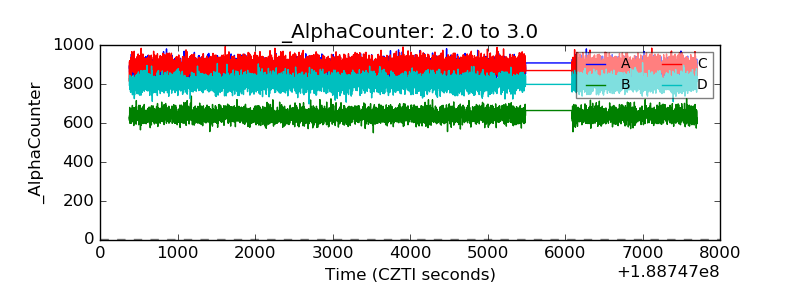 |
| _CPM_Rate | 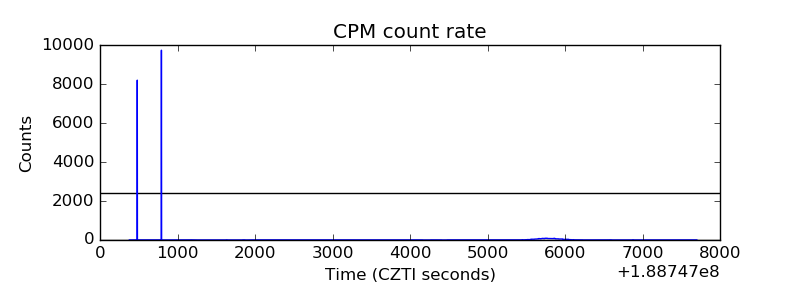 |
| CZT Counter | 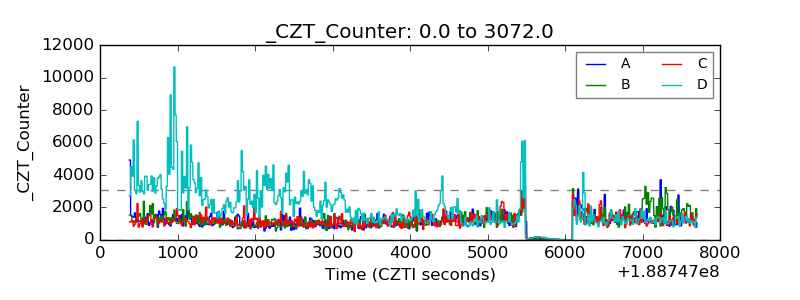 |
| +2.5 Volts monitor |  |
| +5 Volts monitor |  |
| _ROLL_ROT | 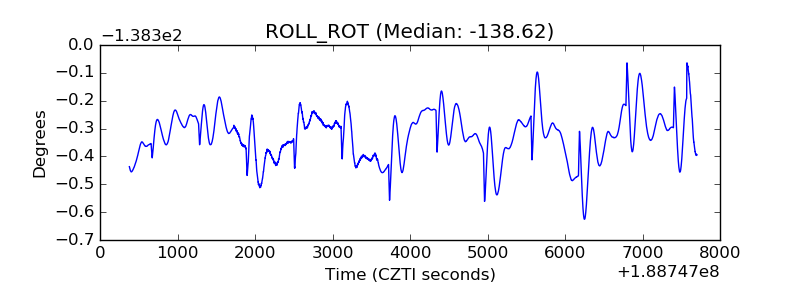 |
| _Roll_DEC | 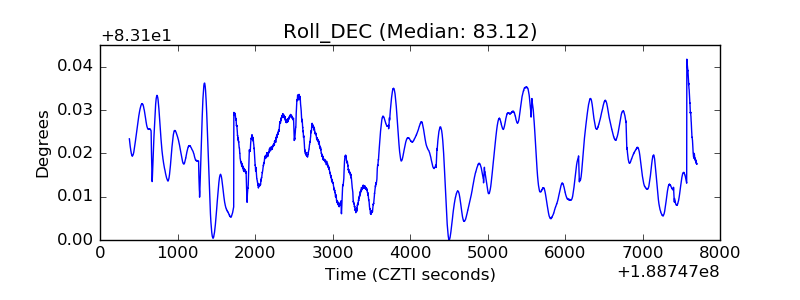 |
| _Roll_RA | 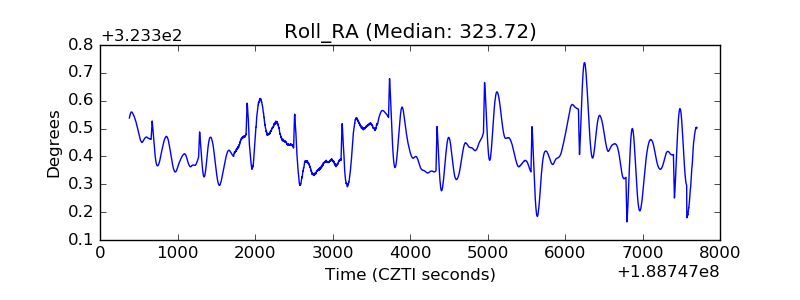 |
| Veto Counter | 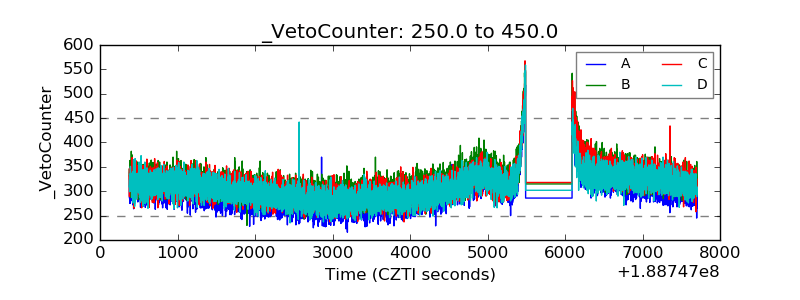 |