| Param | Original file | Final file |
|---|---|---|
| Filename | modeM0/AS1G04_002T02_9000000230_01311cztM0_level2.evt | modeM0/AS1G04_002T02_9000000230_01311cztM0_level2_quad_clean.evt |
| Size (bytes) | 1,090,630,080 | 96,039,360 |
| Size | 1.0 GB | 91.6 MB |
| Events in quadrant A | 7,901,656 | 627,533 |
| Events in quadrant B | 9,334,797 | 621,060 |
| Events in quadrant C | 7,779,613 | 609,066 |
| Events in quadrant D | 7,586,469 | 600,483 |
| Mode M9 | |||
|---|---|---|---|
| Quadrant | BADHDUFLAG | Total packets | Discarded packets |
| A | 0 | 8 | 0 |
| B | 0 | 8 | 0 |
| C | 0 | 8 | 0 |
| D | 0 | 8 | 0 |
| Mode M0 | |||
|---|---|---|---|
| Quadrant | BADHDUFLAG | Total packets | Discarded packets |
| A | 0 | 28076 | 2 |
| B | 0 | 32281 | 1 |
| C | 0 | 27720 | 1 |
| D | 0 | 27082 | 1 |
| Mode SS | |||
|---|---|---|---|
| Quadrant | BADHDUFLAG | Total packets | Discarded packets |
| A | 0 | 132 | 0 |
| B | 0 | 132 | 0 |
| C | 0 | 132 | 0 |
| D | 0 | 132 | 0 |
| Quadrant | Total seconds | Saturated seconds | Saturation percentage |
|---|---|---|---|
| A | 6454 | 46 | 0.712736% |
| B | 6454 | 79 | 1.224047% |
| C | 6454 | 15 | 0.232414% |
| D | 6454 | 19 | 0.294391% |
Noise dominated data is calculated using 1-second bins in cleaned event files. If a bin has >2000 counts, and if more than 50% of those come from <1% of pixels, then it is considered to be noise-dominated and hence unusable.
| Quadrant | # 1 sec bins | Bins with >0 counts | Bins with >2000 counts | High rate bins dominated by noise | Noise dominated (total time) | Noise dominated (detector-on time) | Marked lightcurve |
|---|---|---|---|---|---|---|---|
| A | 7224 | 6455 | 267 | 267 | 3.70% | 4.14% | 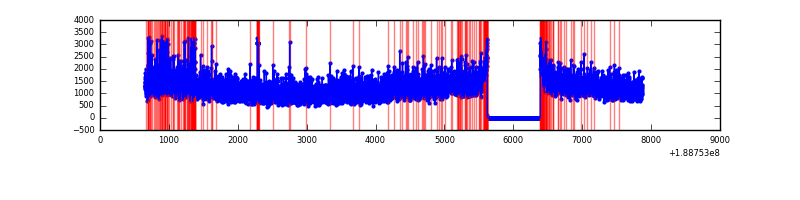 |
| B | 7224 | 6455 | 831 | 831 | 11.50% | 12.87% | 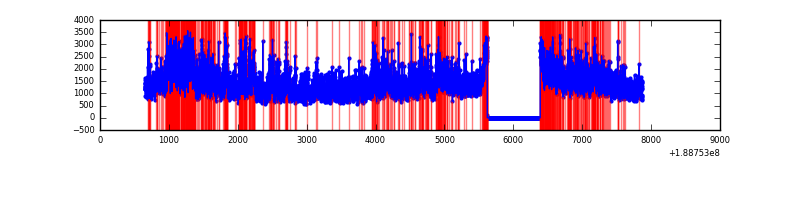 |
| C | 7224 | 6454 | 161 | 161 | 2.23% | 2.49% | 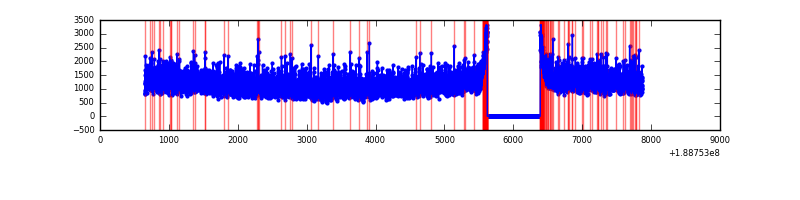 |
| D | 7224 | 6454 | 161 | 161 | 2.23% | 2.49% | 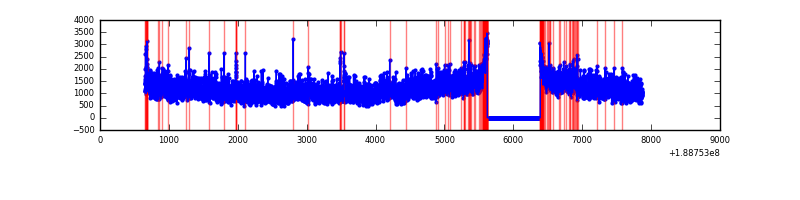 |
Top three noisy pixels from each quadrant. If the there are fewer than three noisy pixels in the level2.evt file, extra rows are filled as -1
| Pixel properties | Quadrant properties | ||||||
|---|---|---|---|---|---|---|---|
| Quadrant | DetID | PixID | Counts | Sigma | Mean | Median | Sigma |
| A | 0 | 128 | 171963 | 355.37 | 1964 | 1979 | 478.3 |
| A | 12 | 243 | 80146 | 163.42 | 1964 | 1979 | 478.3 |
| A | 4 | 32 | 43444 | 86.69 | 1964 | 1979 | 478.3 |
| B | 8 | 4 | 1481189 | 3074.95 | 2037 | 2042 | 481.0 |
| B | 6 | 53 | 49563 | 98.79 | 2037 | 2042 | 481.0 |
| B | 15 | 22 | 21233 | 39.9 | 2037 | 2042 | 481.0 |
| C | 15 | 241 | 305849 | 575.6 | 1892 | 1959 | 528.0 |
| C | 3 | 79 | 28868 | 50.97 | 1892 | 1959 | 528.0 |
| C | 3 | 111 | 26796 | 47.04 | 1892 | 1959 | 528.0 |
| D | 12 | 22 | 361899 | 638.87 | 1822 | 1887 | 563.5 |
| D | 15 | 13 | 291723 | 514.34 | 1822 | 1887 | 563.5 |
| D | 2 | 88 | 32997 | 55.21 | 1822 | 1887 | 563.5 |
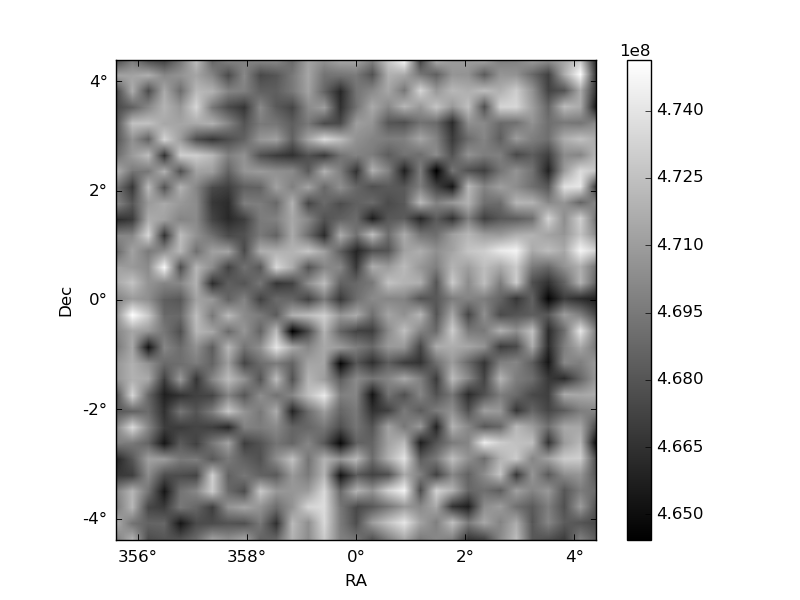
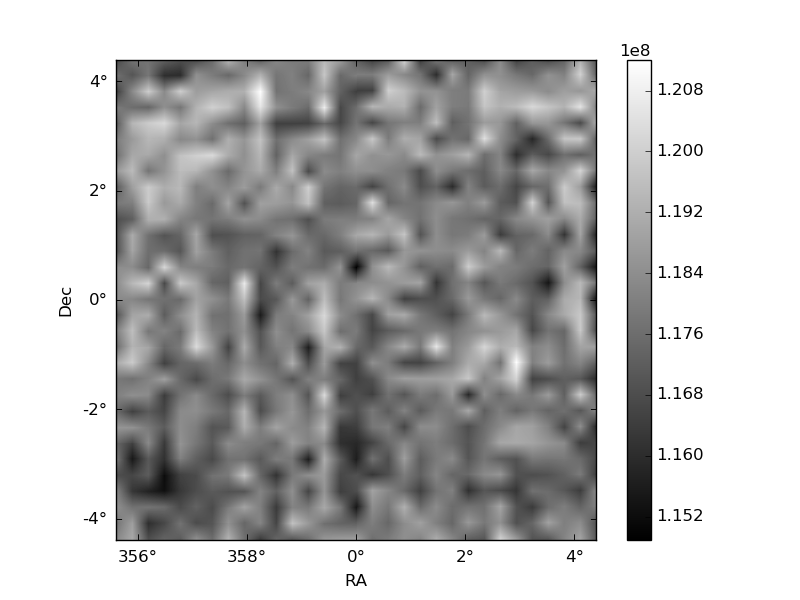
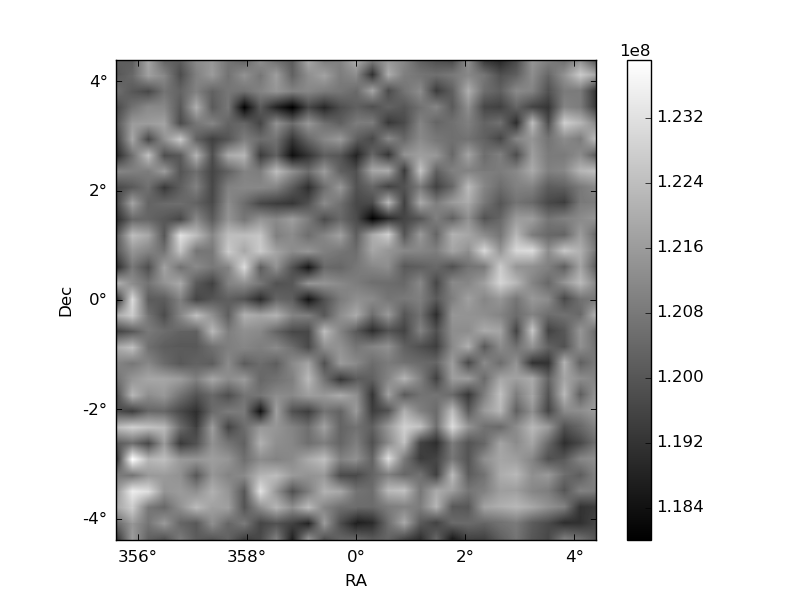
Histogram calculated using DETX and DETY for each event in the final _common_clean file
| Quadrant A | 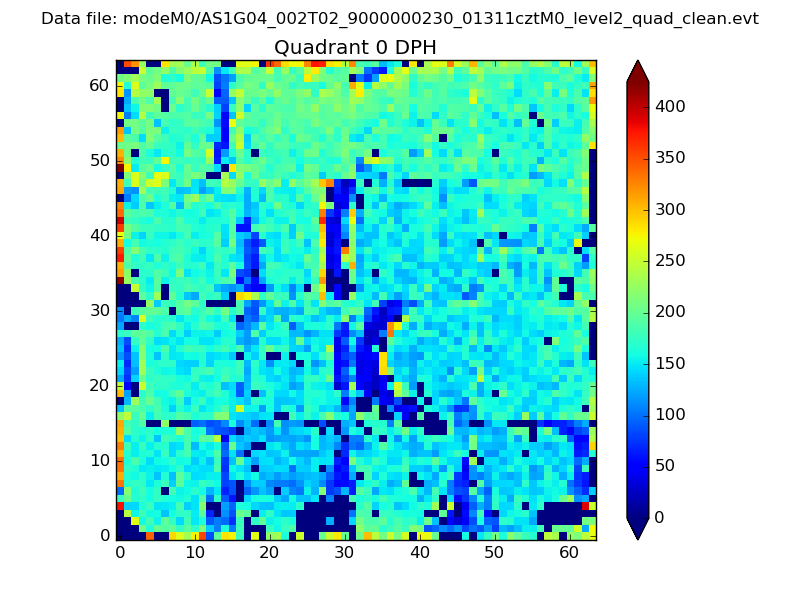 |
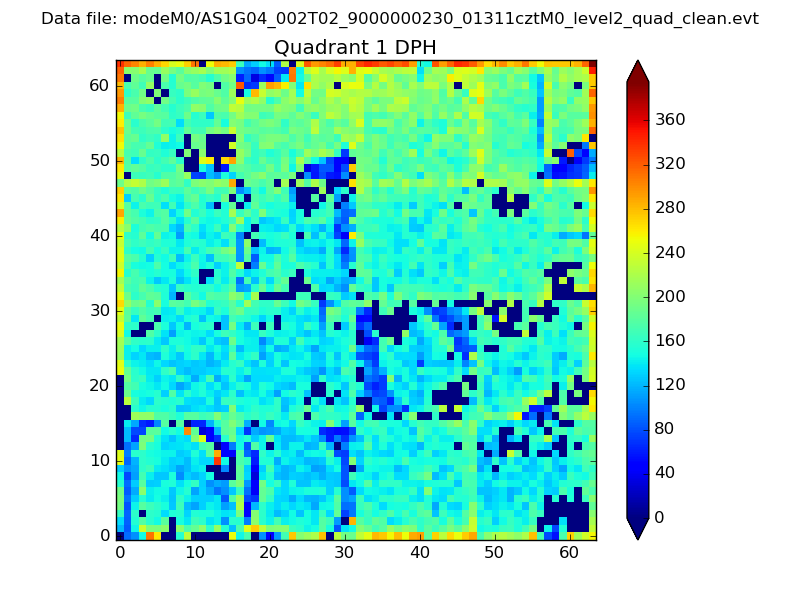 |
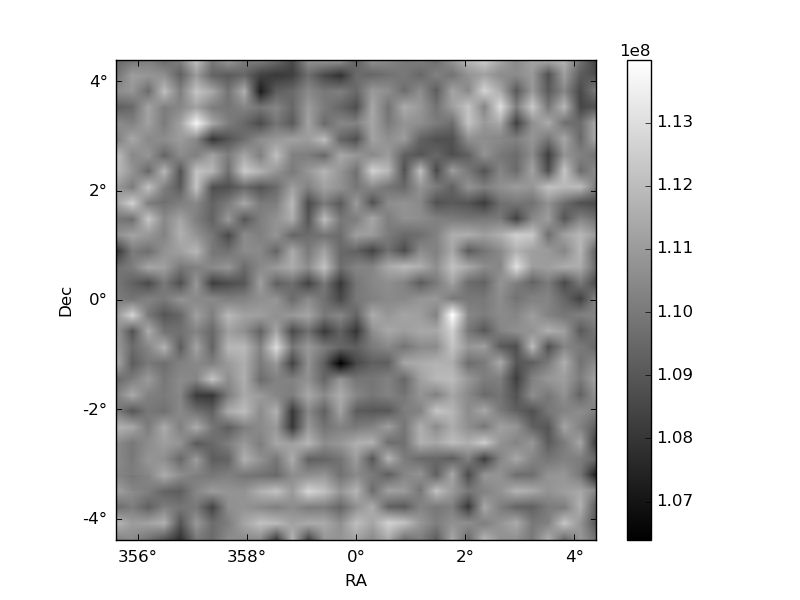
Quadrant B |
|---|---|---|---|
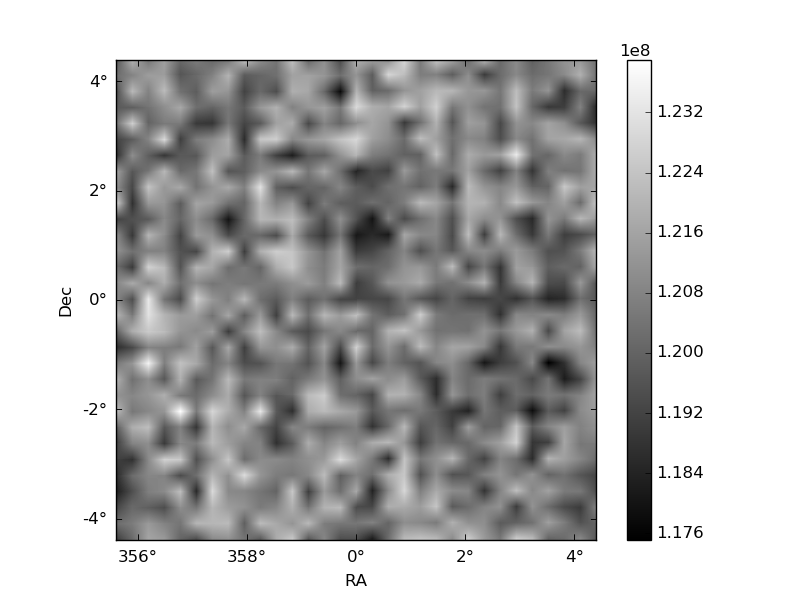
| Quadrant D | 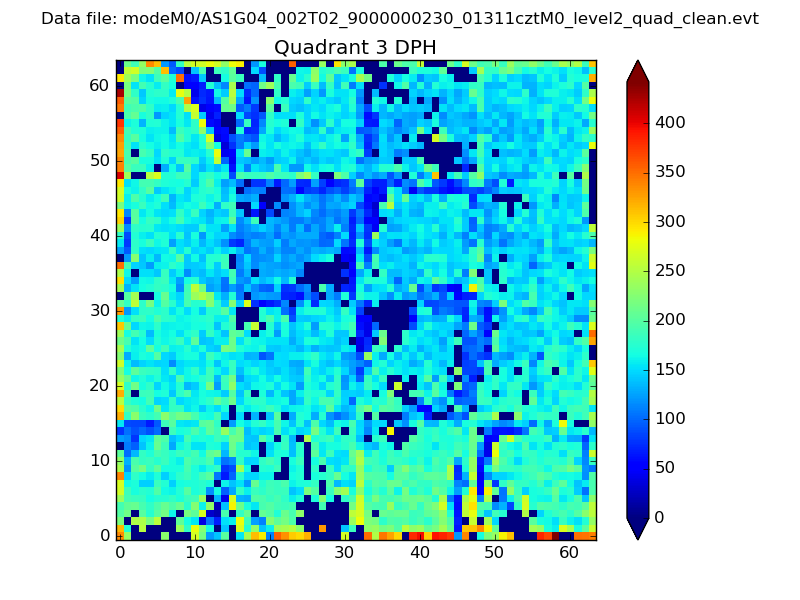 |
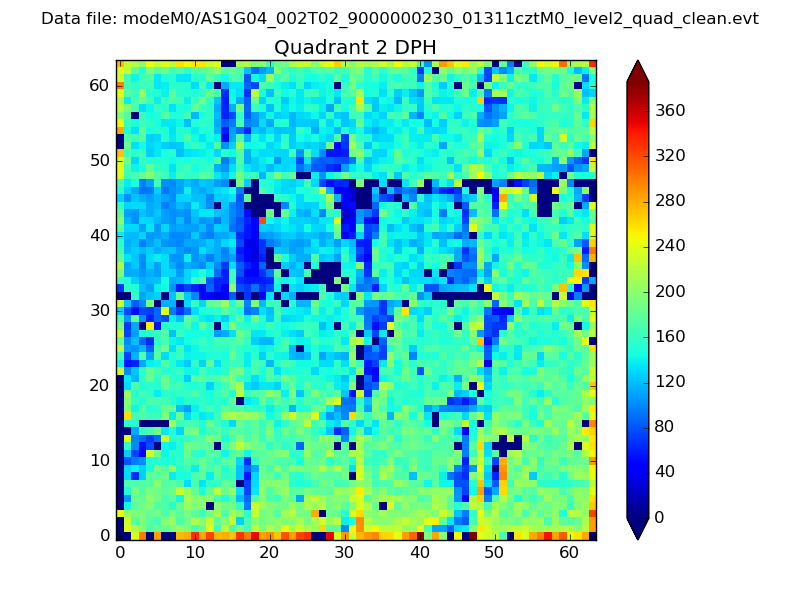 |
Quadrant C |
| Plot type | Count rate plots | Images |
|---|---|---|
| Comparison with Poisson distribution Blue bars denote a histogram of data divided into 1 sec bins. Red curve is a Poisson curve with rate = median count rate of data. |
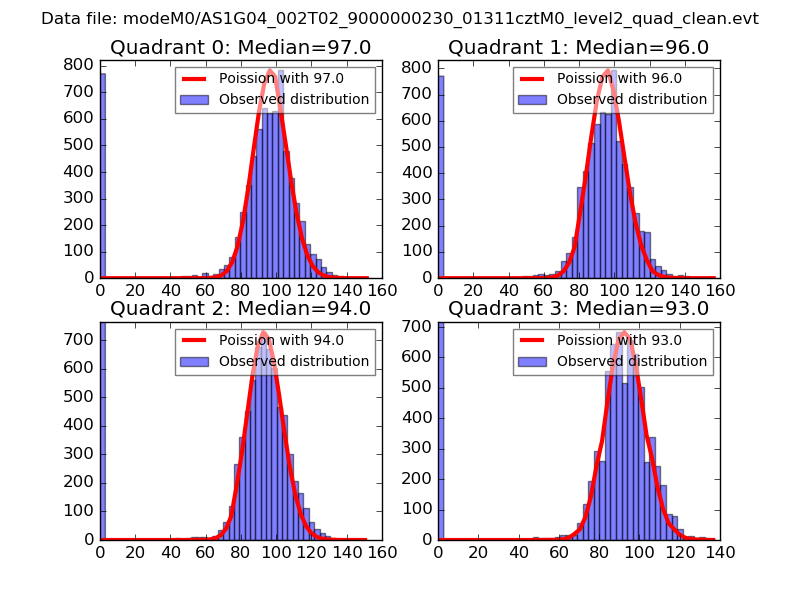 |
 |
| Quadrant-wise count rates Data is divided into 100 sec bins |
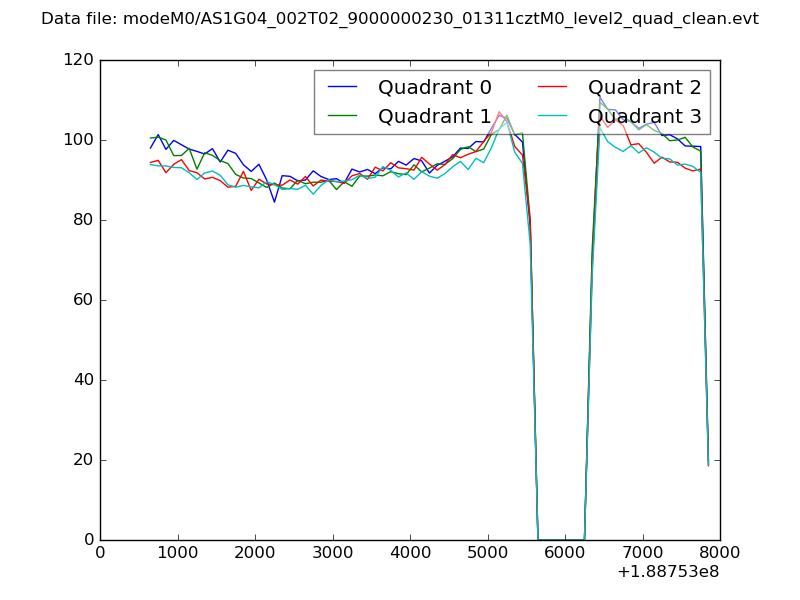 |
|
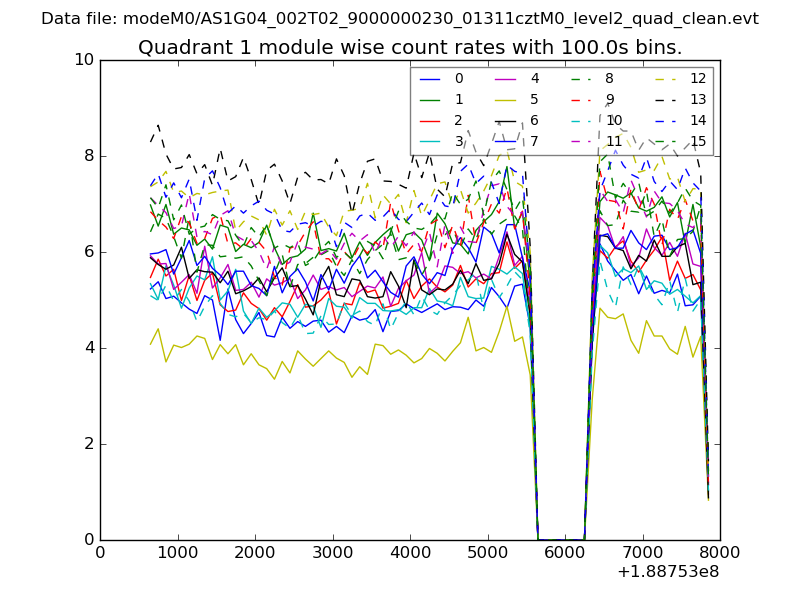
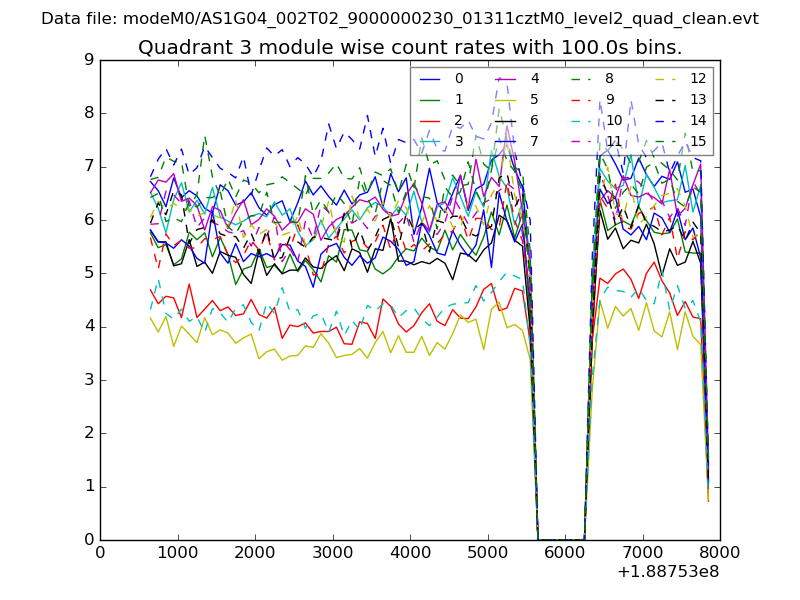
| Module-wise count rates for Quadrant A Data is divided into 100 sec bins |
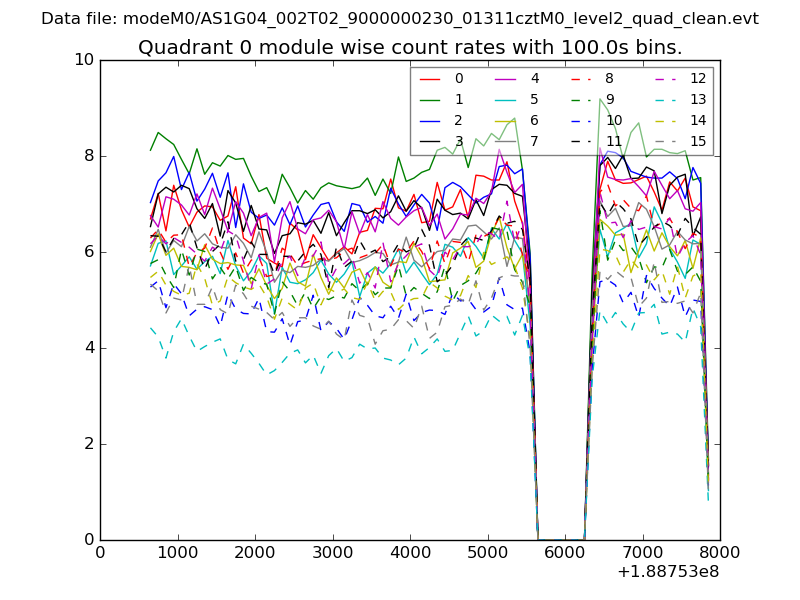 |
 |
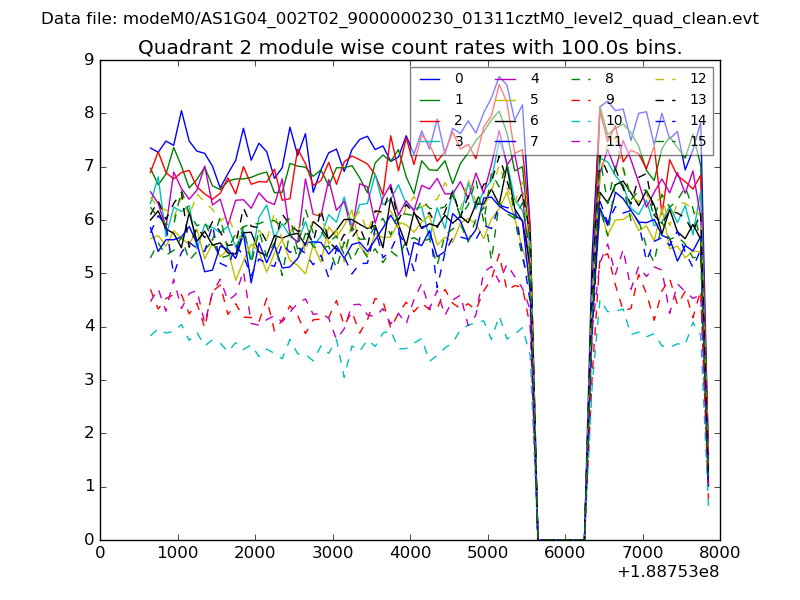
| Module-wise count rates for Quadrant B Data is divided into 100 sec bins |
 |
 |
| Module-wise count rates for Quadrant C Data is divided into 100 sec bins |
 |
 |
| Module-wise count rates for Quadrant D Data is divided into 100 sec bins |
 |
 |
| Parameter | Plot |
|---|---|
| CZT HV Monitor | 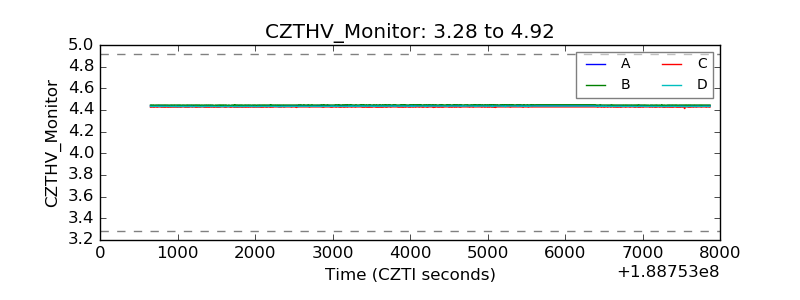 |
| D_VDD | 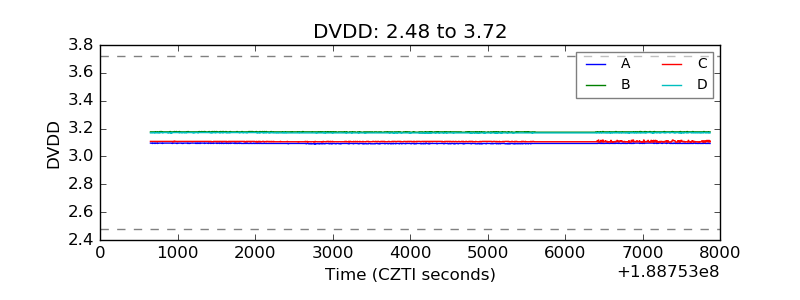 |
| Temperature 1 | 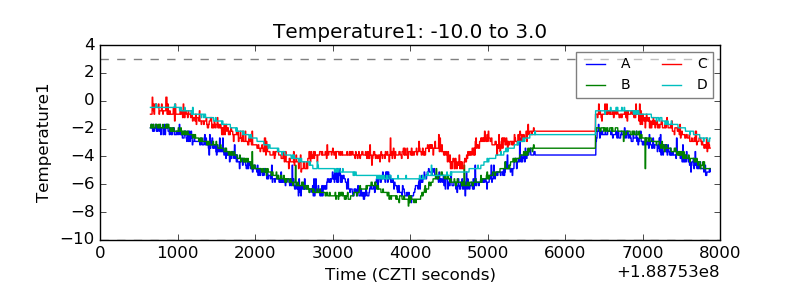 |
| Veto HV Monitor | 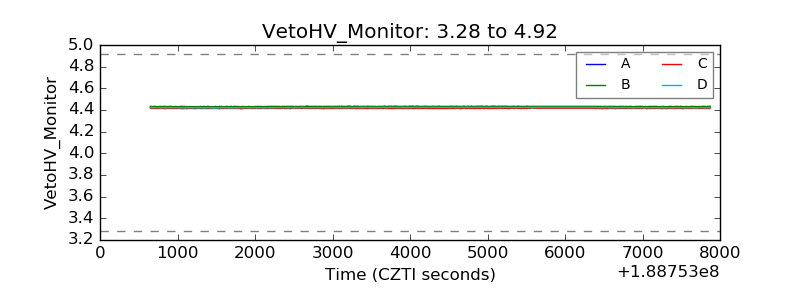 |
| Veto LLD | 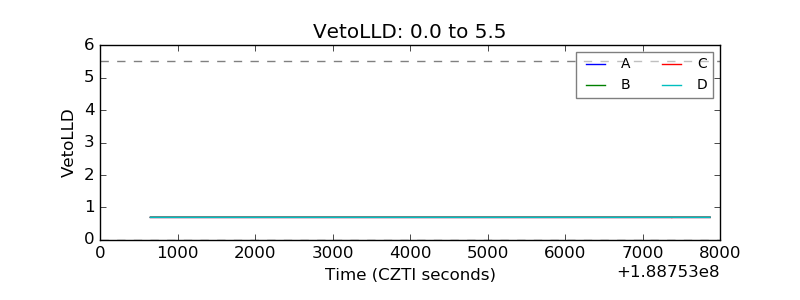 |
| Alpha Counter | 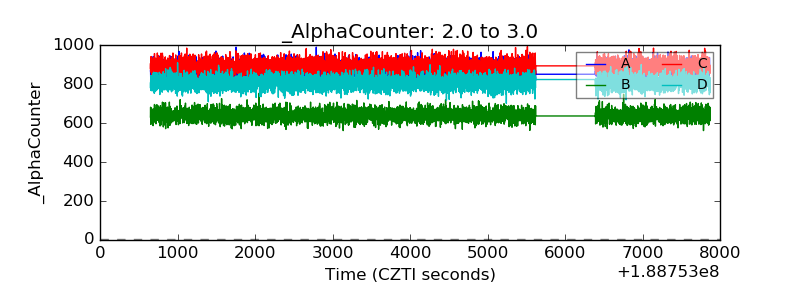 |
| _CPM_Rate | 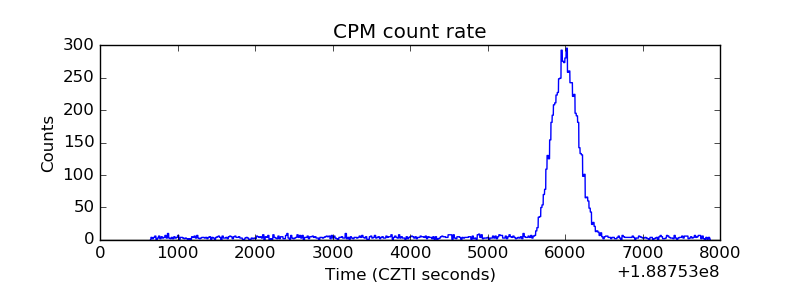 |
| CZT Counter | 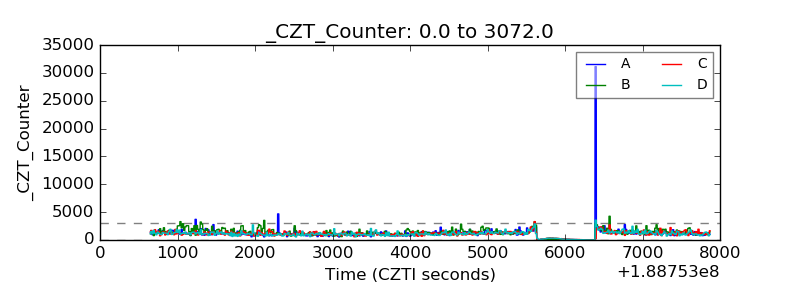 |
| +2.5 Volts monitor | 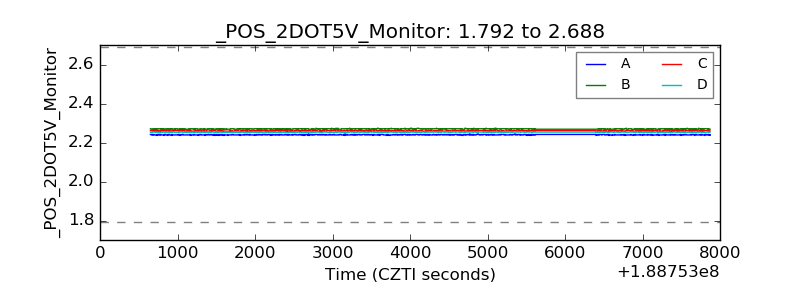 |
| +5 Volts monitor | 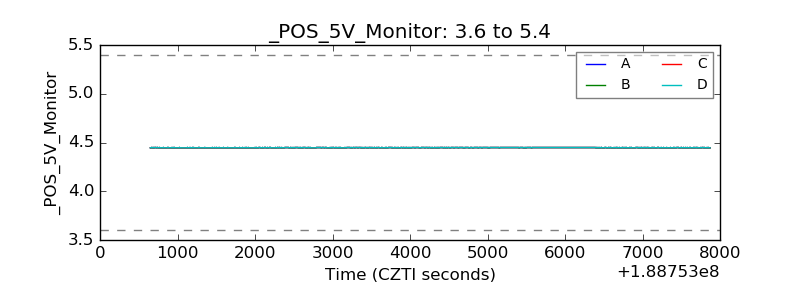 |
| _ROLL_ROT | 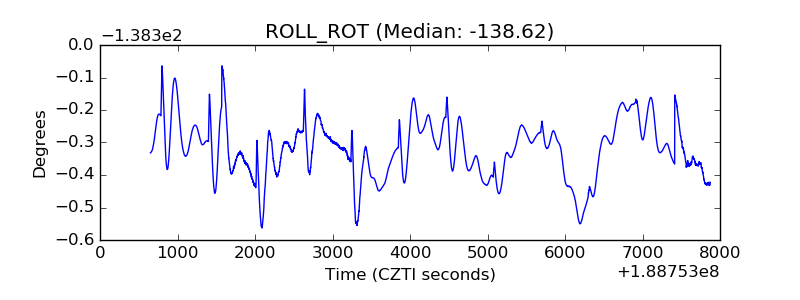 |
| _Roll_DEC | 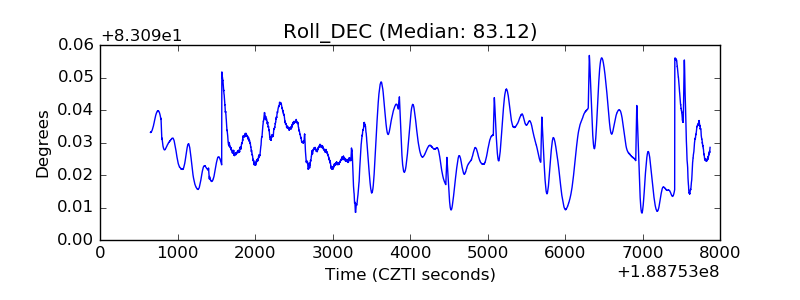 |
| _Roll_RA | 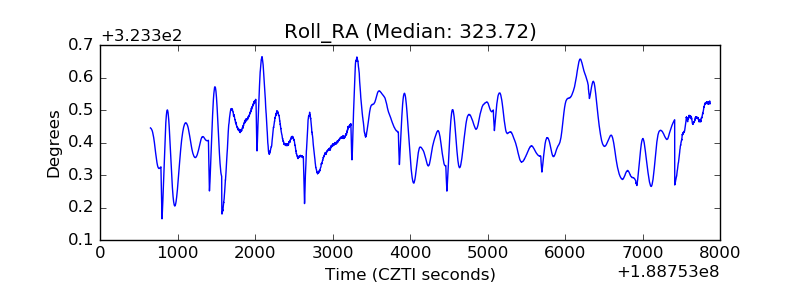 |
| Veto Counter | 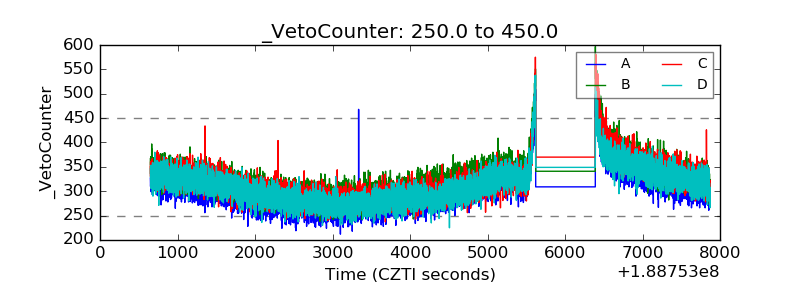 |