| Param | Original file | Final file |
|---|---|---|
| Filename | modeM0/AS1G04_002T02_9000000230_01312cztM0_level2.evt | modeM0/AS1G04_002T02_9000000230_01312cztM0_level2_quad_clean.evt |
| Size (bytes) | 1,087,560,000 | 98,455,680 |
| Size | 1.0 GB | 93.9 MB |
| Events in quadrant A | 7,687,229 | 644,323 |
| Events in quadrant B | 8,615,716 | 640,758 |
| Events in quadrant C | 7,764,724 | 629,033 |
| Events in quadrant D | 8,438,743 | 613,985 |
| Mode M9 | |||
|---|---|---|---|
| Quadrant | BADHDUFLAG | Total packets | Discarded packets |
| A | 0 | 9 | 0 |
| B | 0 | 9 | 0 |
| C | 0 | 9 | 0 |
| D | 0 | 9 | 0 |
| Mode M0 | |||
|---|---|---|---|
| Quadrant | BADHDUFLAG | Total packets | Discarded packets |
| A | 0 | 27465 | 2 |
| B | 0 | 30192 | 1 |
| C | 0 | 27708 | 1 |
| D | 0 | 29727 | 1 |
| Mode SS | |||
|---|---|---|---|
| Quadrant | BADHDUFLAG | Total packets | Discarded packets |
| A | 0 | 132 | 0 |
| B | 0 | 132 | 0 |
| C | 0 | 132 | 0 |
| D | 0 | 132 | 0 |
| Quadrant | Total seconds | Saturated seconds | Saturation percentage |
|---|---|---|---|
| A | 6502 | 18 | 0.276838% |
| B | 6502 | 46 | 0.707475% |
| C | 6502 | 15 | 0.230698% |
| D | 6502 | 230 | 3.537373% |
Noise dominated data is calculated using 1-second bins in cleaned event files. If a bin has >2000 counts, and if more than 50% of those come from <1% of pixels, then it is considered to be noise-dominated and hence unusable.
| Quadrant | # 1 sec bins | Bins with >0 counts | Bins with >2000 counts | High rate bins dominated by noise | Noise dominated (total time) | Noise dominated (detector-on time) | Marked lightcurve |
|---|---|---|---|---|---|---|---|
| A | 7472 | 6503 | 141 | 141 | 1.89% | 2.17% | 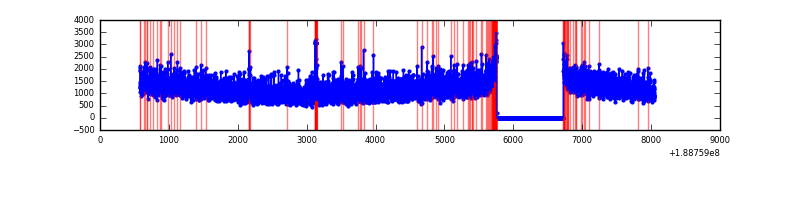 |
| B | 7472 | 6503 | 478 | 478 | 6.40% | 7.35% | 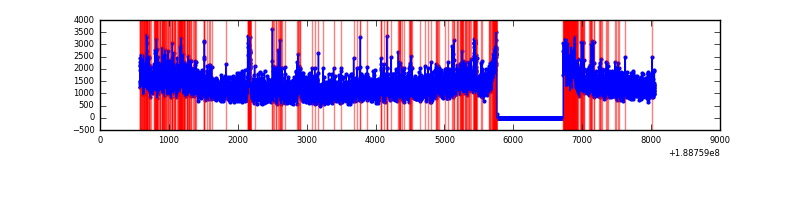 |
| C | 7472 | 6502 | 155 | 155 | 2.07% | 2.38% | 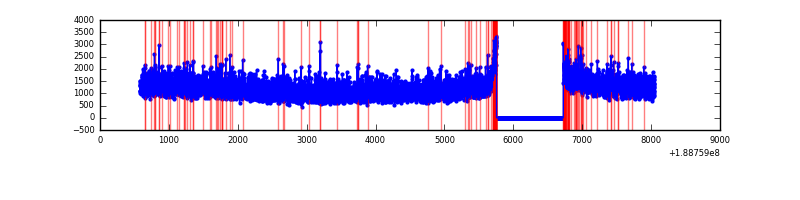 |
| D | 7472 | 6502 | 736 | 736 | 9.85% | 11.32% | 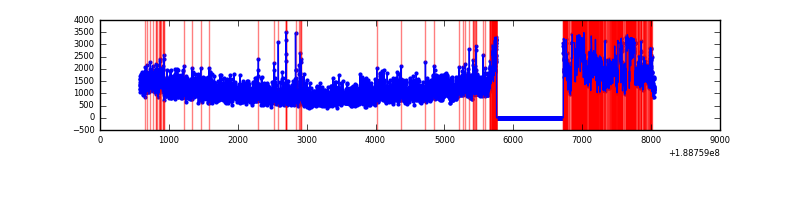 |
Top three noisy pixels from each quadrant. If the there are fewer than three noisy pixels in the level2.evt file, extra rows are filled as -1
| Pixel properties | Quadrant properties | ||||||
|---|---|---|---|---|---|---|---|
| Quadrant | DetID | PixID | Counts | Sigma | Mean | Median | Sigma |
| A | 4 | 32 | 87422 | 182.24 | 1959 | 1976 | 468.9 |
| A | 12 | 243 | 55889 | 114.98 | 1959 | 1976 | 468.9 |
| A | 15 | 233 | 13001 | 23.51 | 1959 | 1976 | 468.9 |
| B | 8 | 4 | 685640 | 1427.32 | 2037 | 2039 | 478.9 |
| B | 6 | 53 | 76293 | 155.04 | 2037 | 2039 | 478.9 |
| B | 12 | 52 | 38825 | 76.81 | 2037 | 2039 | 478.9 |
| C | 15 | 241 | 315549 | 596.57 | 1888 | 1955 | 525.7 |
| C | 3 | 111 | 26356 | 46.42 | 1888 | 1955 | 525.7 |
| C | 3 | 79 | 21774 | 37.7 | 1888 | 1955 | 525.7 |
| D | 10 | 84 | 1286660 | 2286.77 | 1813 | 1877 | 561.8 |
| D | 12 | 22 | 95888 | 167.33 | 1813 | 1877 | 561.8 |
| D | 10 | 85 | 89958 | 156.77 | 1813 | 1877 | 561.8 |
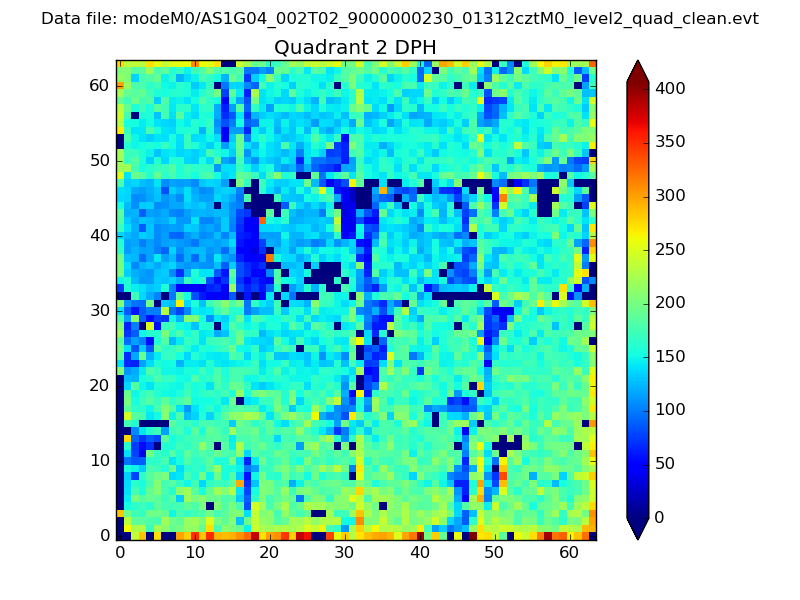
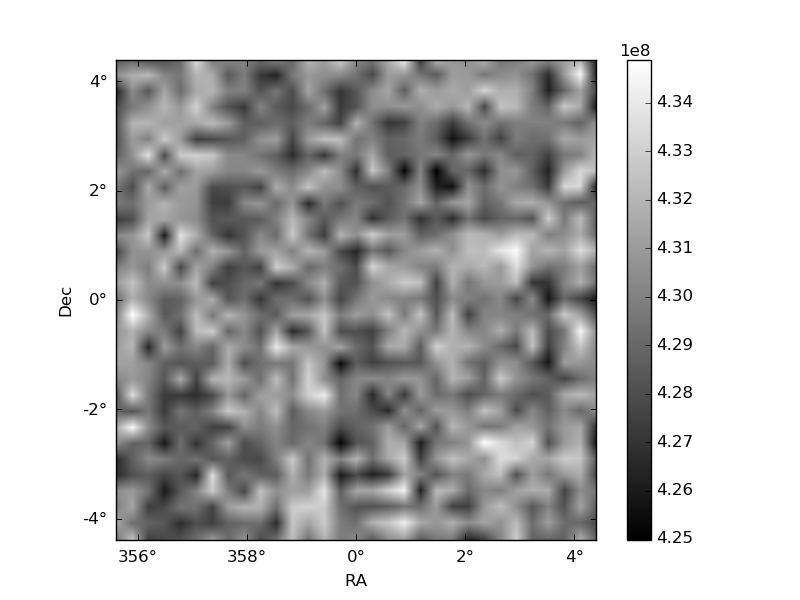
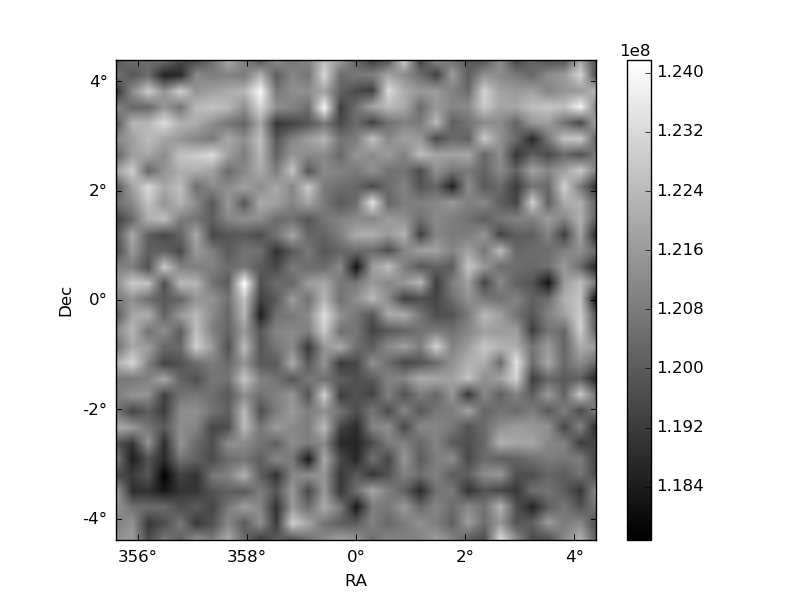
Histogram calculated using DETX and DETY for each event in the final _common_clean file
| Quadrant A | 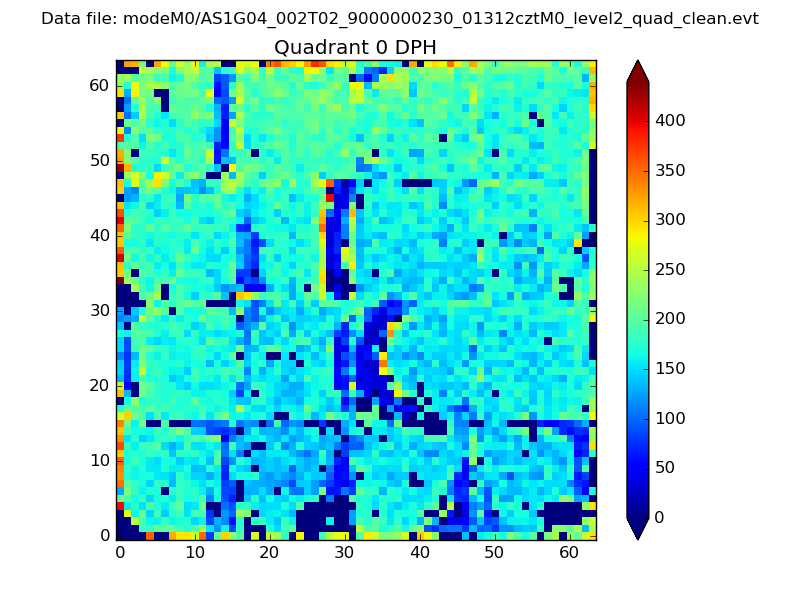 |
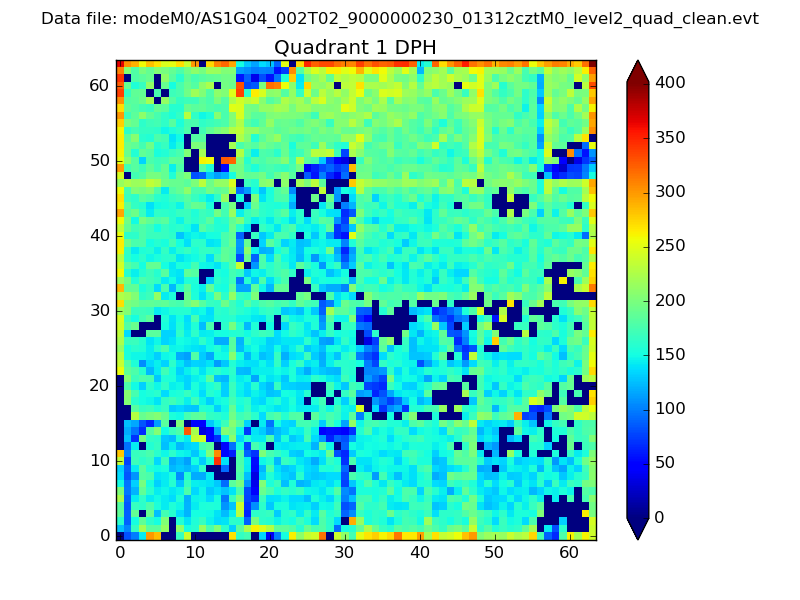 |
Quadrant B |
|---|---|---|---|
| Quadrant D | 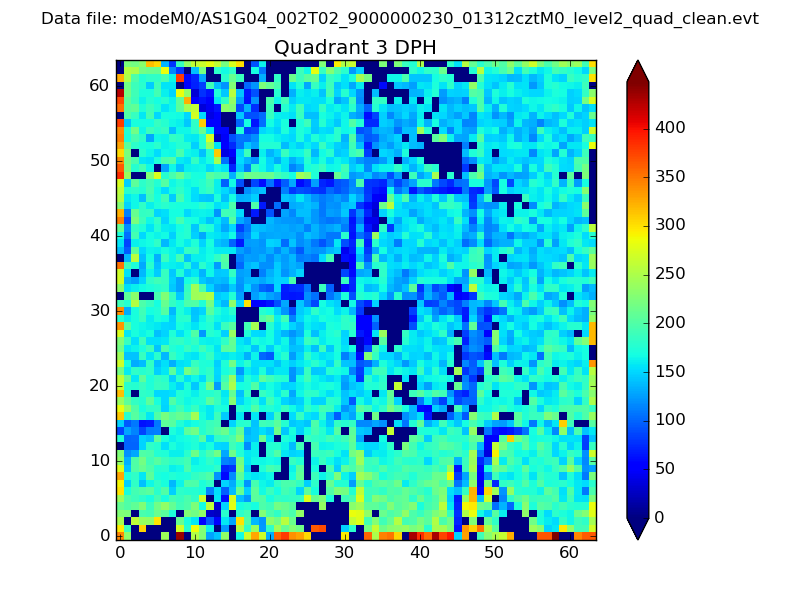 |
 |
Quadrant C |
| Plot type | Count rate plots | Images |
|---|---|---|
| Comparison with Poisson distribution Blue bars denote a histogram of data divided into 1 sec bins. Red curve is a Poisson curve with rate = median count rate of data. |
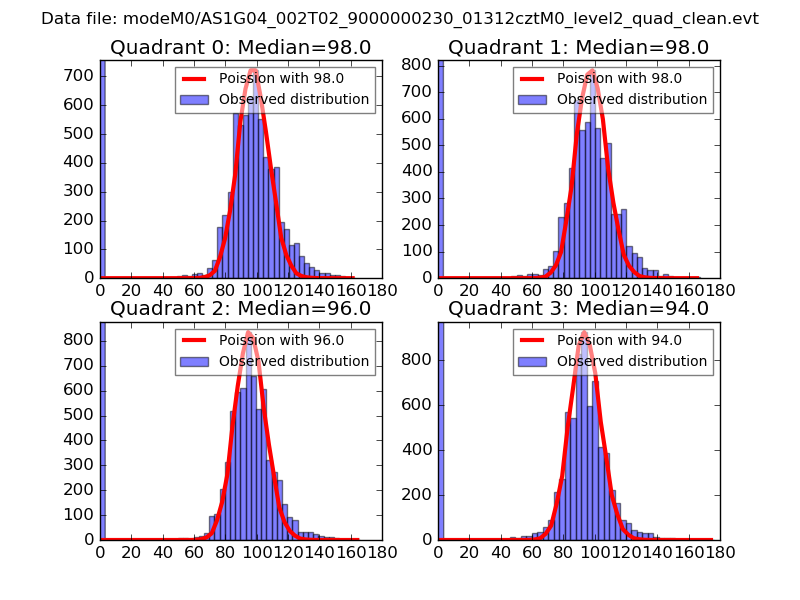 |
 |
| Quadrant-wise count rates Data is divided into 100 sec bins |
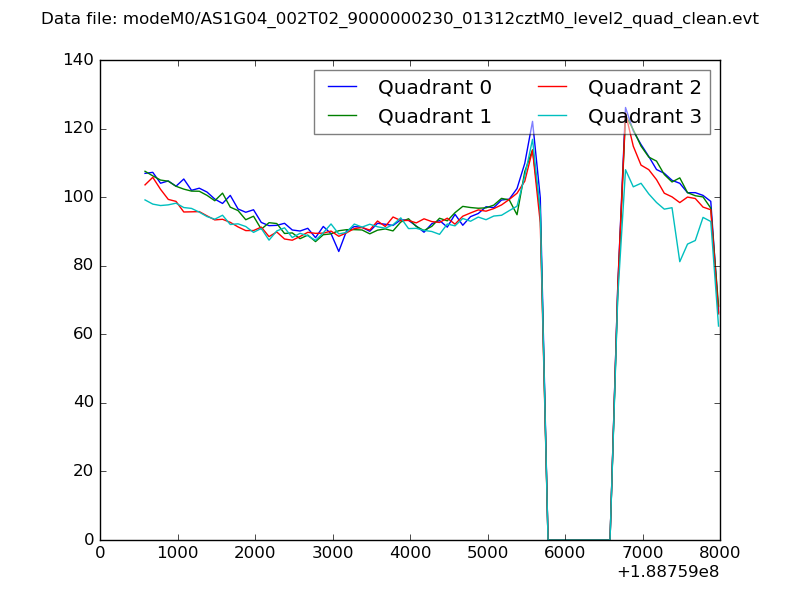 |
|
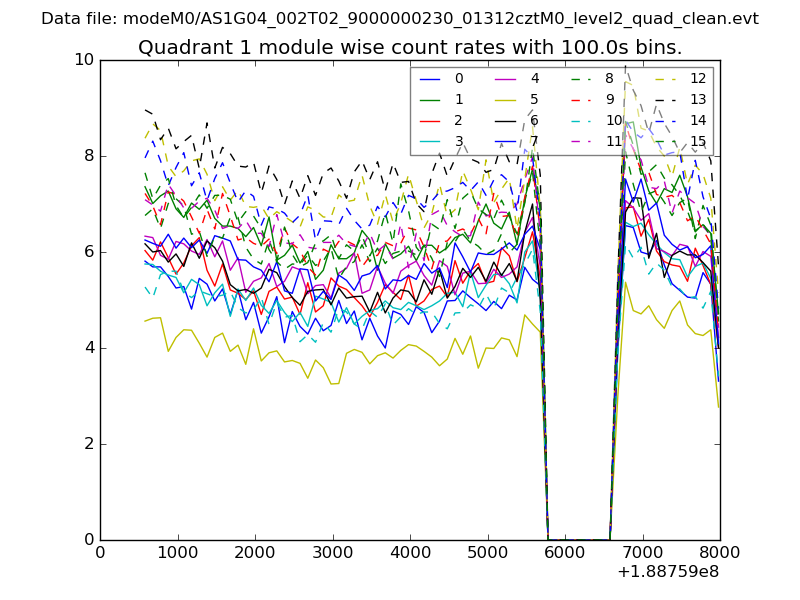
| Module-wise count rates for Quadrant A Data is divided into 100 sec bins |
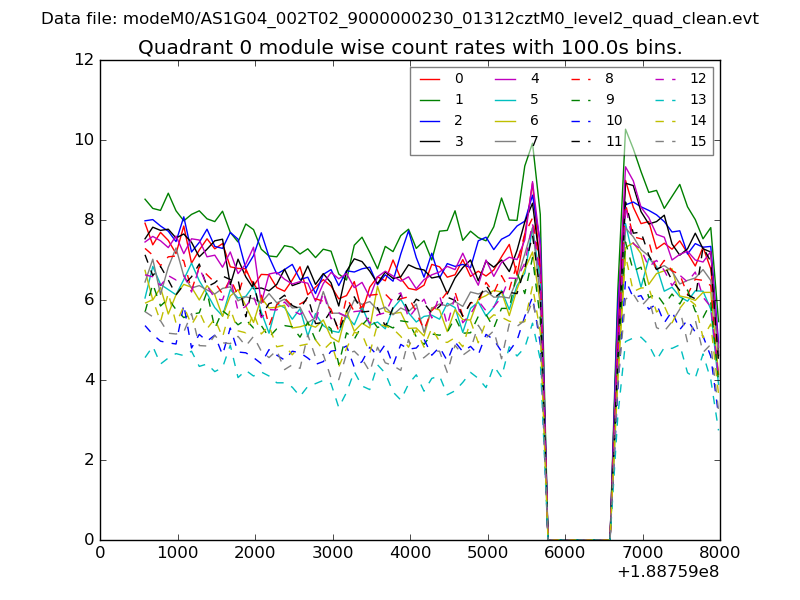 |
 |
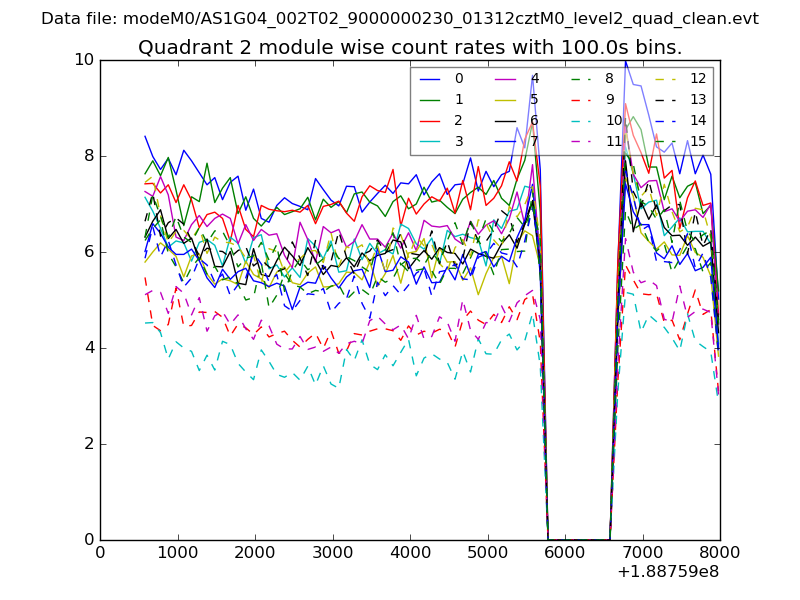
| Module-wise count rates for Quadrant B Data is divided into 100 sec bins |
 |
 |
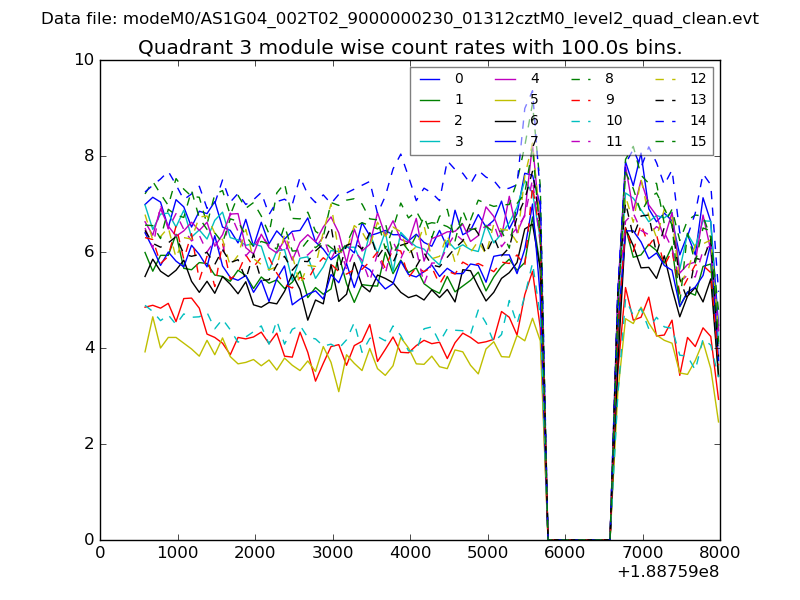
| Module-wise count rates for Quadrant C Data is divided into 100 sec bins |
 |
 |
| Module-wise count rates for Quadrant D Data is divided into 100 sec bins |
 |
 |
| Parameter | Plot |
|---|---|
| CZT HV Monitor | 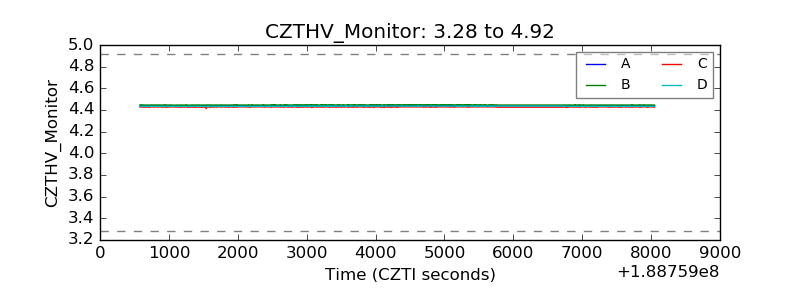 |
| D_VDD | 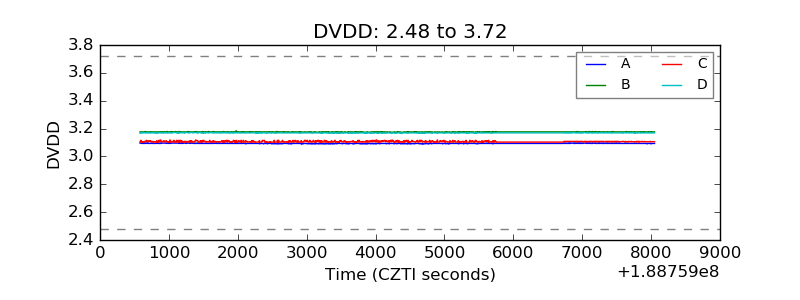 |
| Temperature 1 | 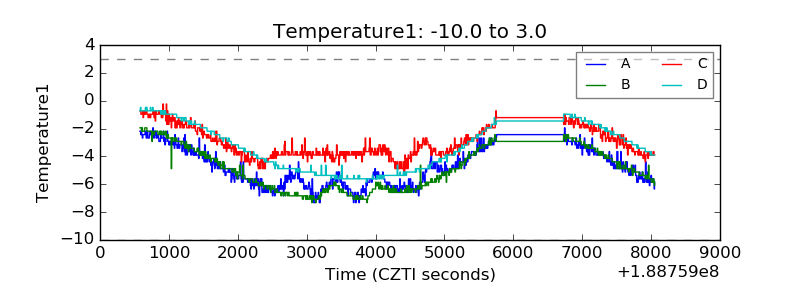 |
| Veto HV Monitor | 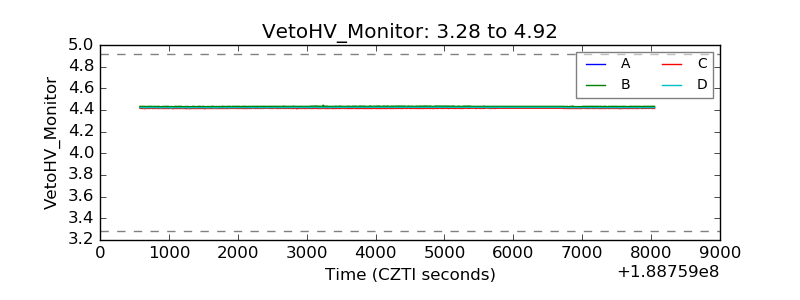 |
| Veto LLD | 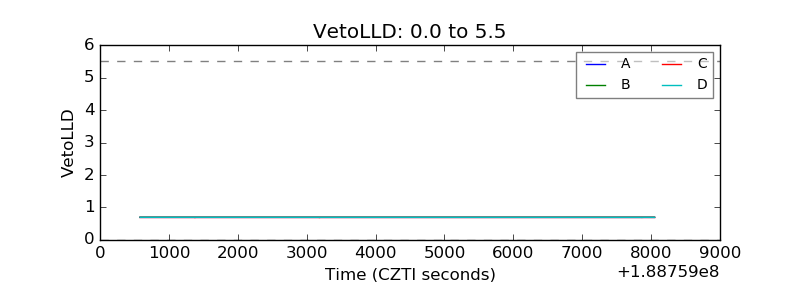 |
| Alpha Counter | 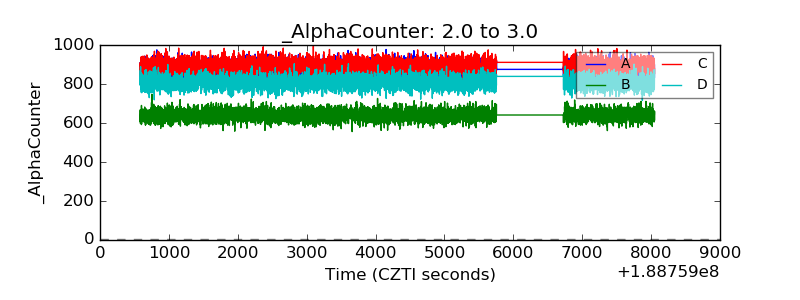 |
| _CPM_Rate | 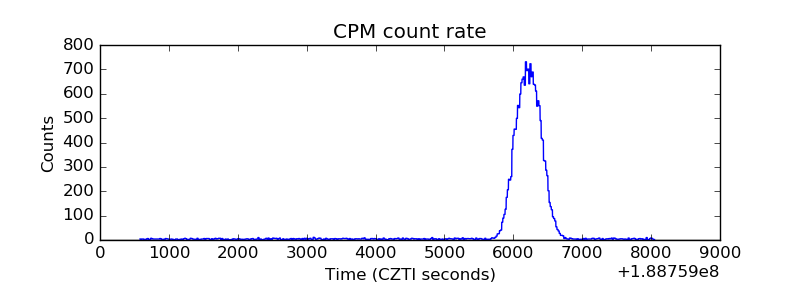 |
| CZT Counter | 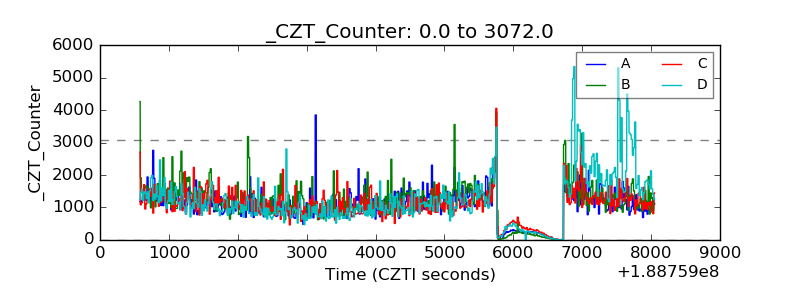 |
| +2.5 Volts monitor |  |
| +5 Volts monitor |  |
| _ROLL_ROT | 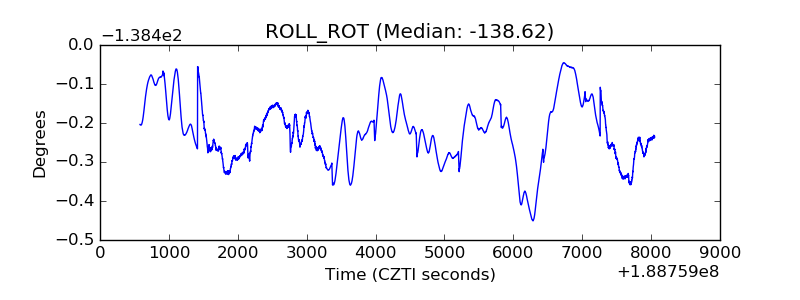 |
| _Roll_DEC | 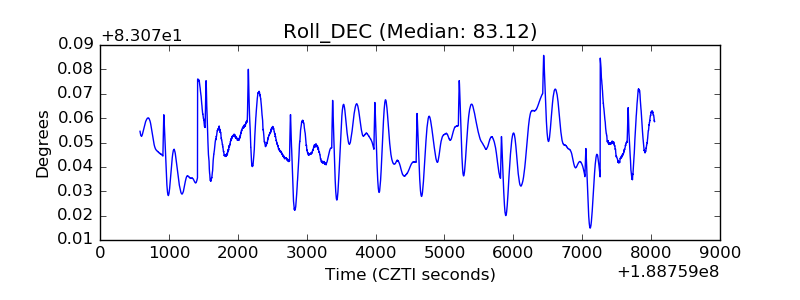 |
| _Roll_RA | 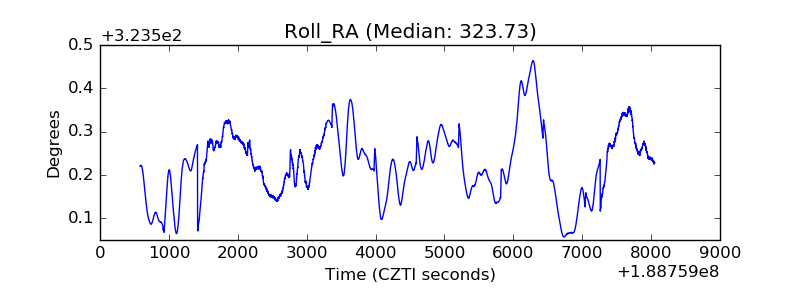 |
| Veto Counter | 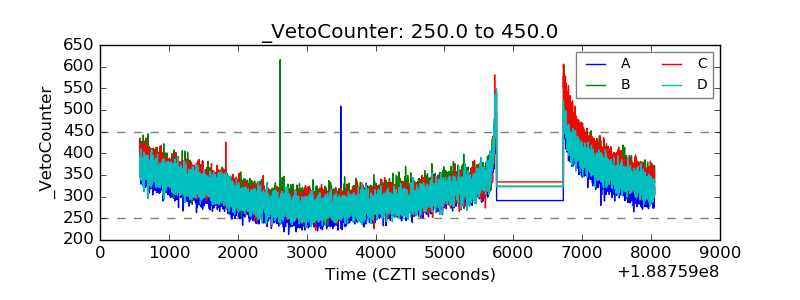 |