| Param | Original file | Final file |
|---|---|---|
| Filename | modeM0/AS1G04_002T02_9000000230_01314cztM0_level2.evt | modeM0/AS1G04_002T02_9000000230_01314cztM0_level2_quad_clean.evt |
| Size (bytes) | 1,208,787,840 | 97,323,840 |
| Size | 1.1 GB | 92.8 MB |
| Events in quadrant A | 7,829,838 | 645,452 |
| Events in quadrant B | 8,126,364 | 650,316 |
| Events in quadrant C | 7,697,452 | 640,390 |
| Events in quadrant D | 12,530,987 | 563,126 |
| Mode M9 | |||
|---|---|---|---|
| Quadrant | BADHDUFLAG | Total packets | Discarded packets |
| A | 0 | 11 | 0 |
| B | 0 | 11 | 0 |
| C | 0 | 11 | 0 |
| D | 0 | 12 | 0 |
| Mode M0 | |||
|---|---|---|---|
| Quadrant | BADHDUFLAG | Total packets | Discarded packets |
| A | 0 | 27822 | 3 |
| B | 0 | 28685 | 2 |
| C | 0 | 27433 | 2 |
| D | 0 | 41980 | 2 |
| Mode SS | |||
|---|---|---|---|
| Quadrant | BADHDUFLAG | Total packets | Discarded packets |
| A | 0 | 130 | 0 |
| B | 0 | 130 | 0 |
| C | 0 | 130 | 0 |
| D | 0 | 130 | 0 |
| Quadrant | Total seconds | Saturated seconds | Saturation percentage |
|---|---|---|---|
| A | 6415 | 46 | 0.717069% |
| B | 6415 | 23 | 0.358535% |
| C | 6415 | 14 | 0.218239% |
| D | 6415 | 1570 | 24.473889% |
Noise dominated data is calculated using 1-second bins in cleaned event files. If a bin has >2000 counts, and if more than 50% of those come from <1% of pixels, then it is considered to be noise-dominated and hence unusable.
| Quadrant | # 1 sec bins | Bins with >0 counts | Bins with >2000 counts | High rate bins dominated by noise | Noise dominated (total time) | Noise dominated (detector-on time) | Marked lightcurve |
|---|---|---|---|---|---|---|---|
| A | 7525 | 6416 | 270 | 270 | 3.59% | 4.21% | 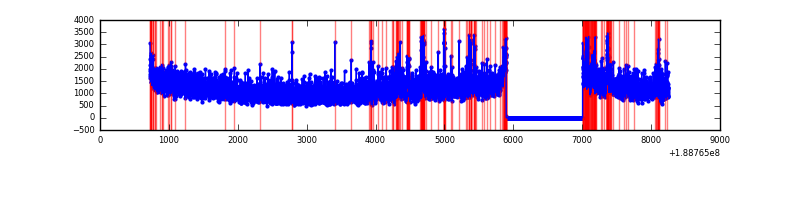 |
| B | 7525 | 6416 | 329 | 329 | 4.37% | 5.13% | 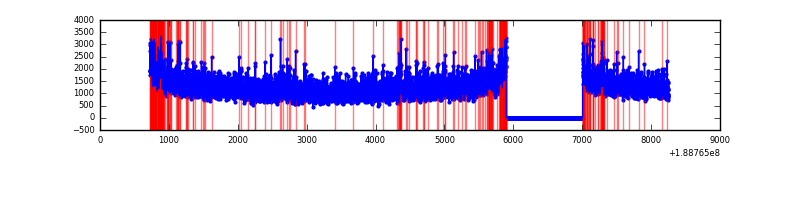 |
| C | 7525 | 6415 | 188 | 188 | 2.50% | 2.93% | 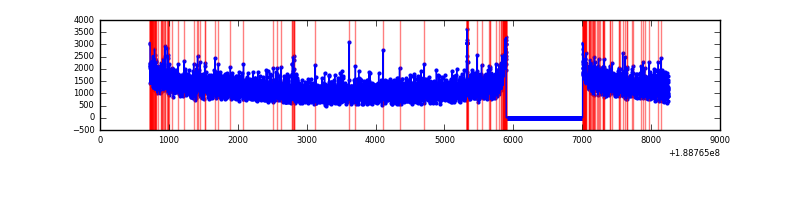 |
| D | 7524 | 6414 | 2789 | 2789 | 37.07% | 43.48% | 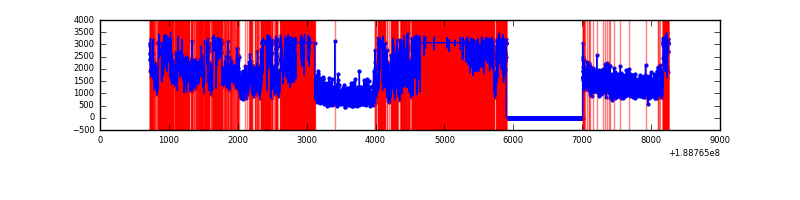 |
Top three noisy pixels from each quadrant. If the there are fewer than three noisy pixels in the level2.evt file, extra rows are filled as -1
| Pixel properties | Quadrant properties | ||||||
|---|---|---|---|---|---|---|---|
| Quadrant | DetID | PixID | Counts | Sigma | Mean | Median | Sigma |
| A | 4 | 32 | 452381 | 983.92 | 1915 | 1925 | 457.8 |
| A | 0 | 128 | 16926 | 32.77 | 1915 | 1925 | 457.8 |
| A | 11 | 79 | 7142 | 11.4 | 1915 | 1925 | 457.8 |
| B | 8 | 4 | 269665 | 568.74 | 2015 | 2017 | 470.6 |
| B | 12 | 52 | 69540 | 143.48 | 2015 | 2017 | 470.6 |
| B | 0 | 220 | 36099 | 72.42 | 2015 | 2017 | 470.6 |
| C | 15 | 241 | 315285 | 604.23 | 1861 | 1929 | 518.6 |
| C | 9 | 52 | 44855 | 82.77 | 1861 | 1929 | 518.6 |
| C | 3 | 9 | 30695 | 55.47 | 1861 | 1929 | 518.6 |
| D | 10 | 84 | 5779212 | 11158.43 | 1674 | 1738 | 517.8 |
| D | 12 | 22 | 203537 | 389.75 | 1674 | 1738 | 517.8 |
| D | 15 | 13 | 132212 | 251.99 | 1674 | 1738 | 517.8 |
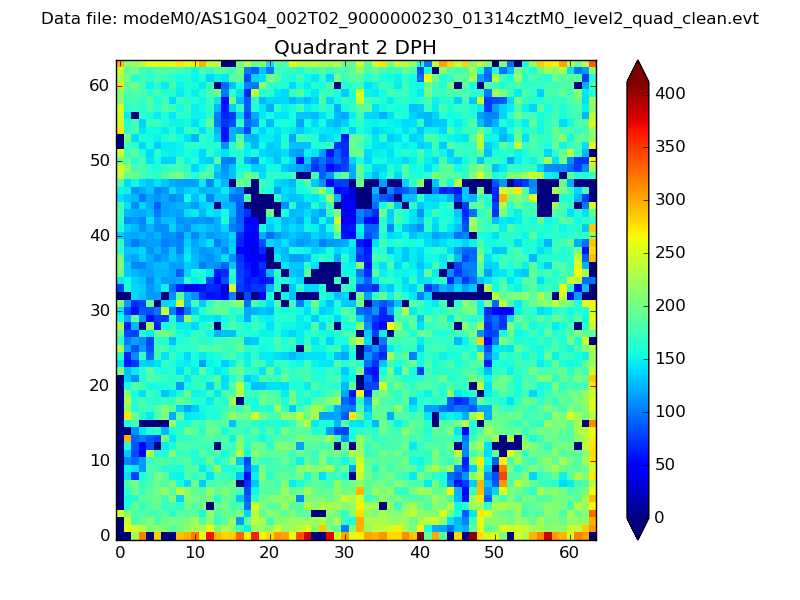
Histogram calculated using DETX and DETY for each event in the final _common_clean file
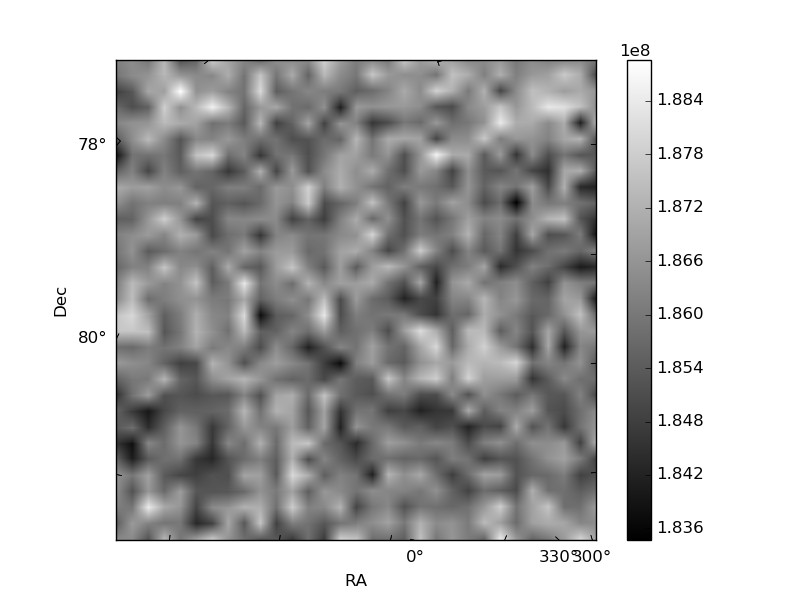
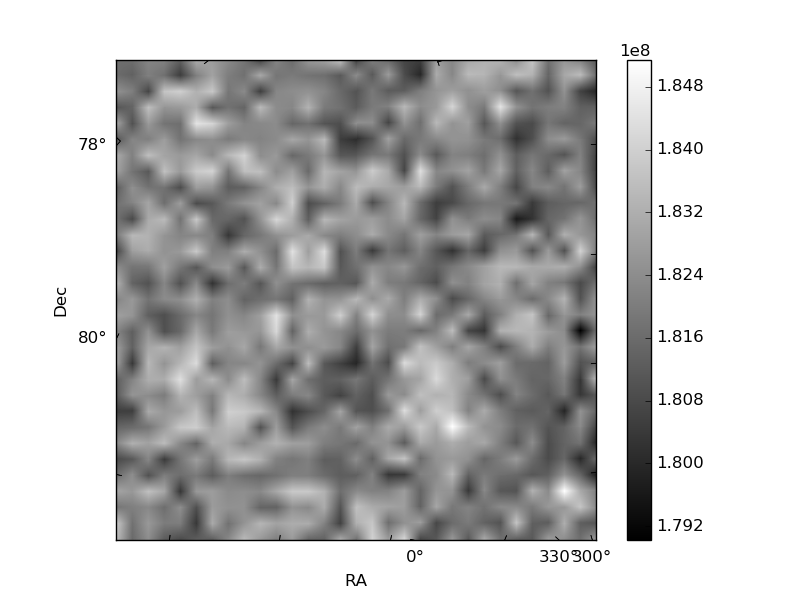
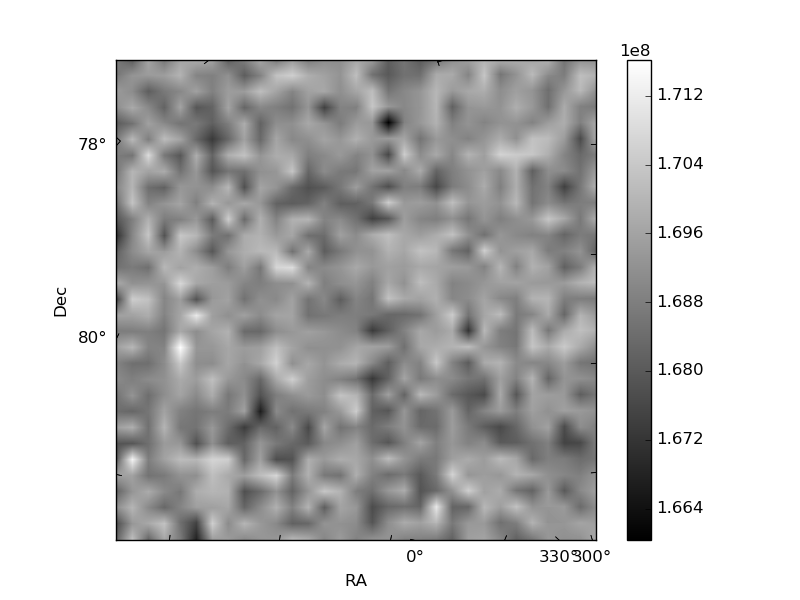
| Quadrant A | 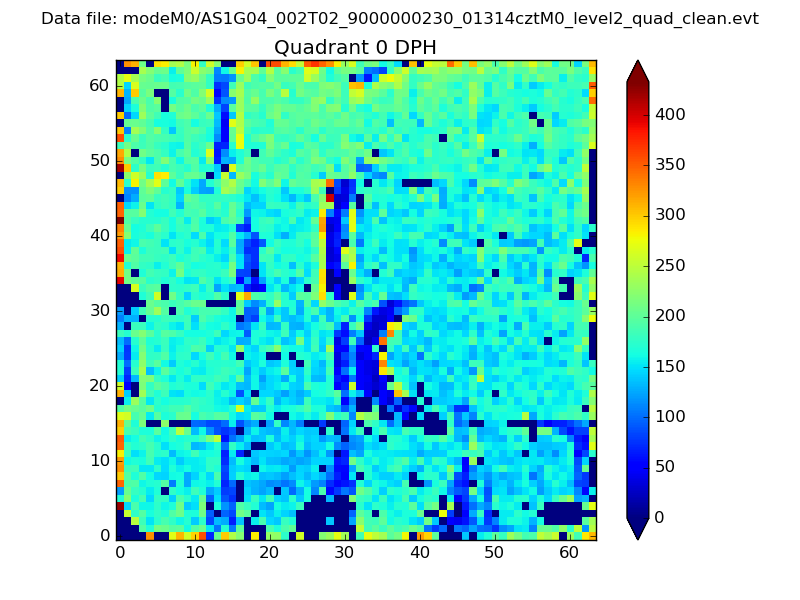 |
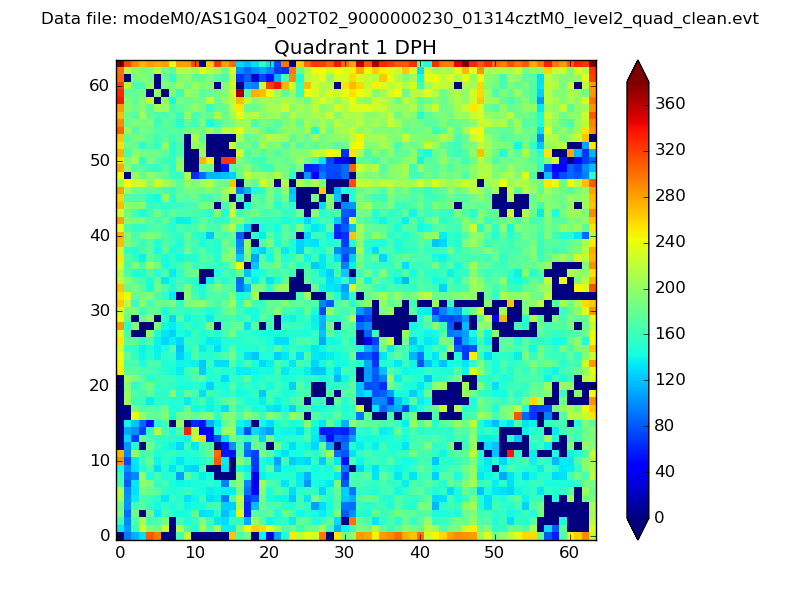 |
Quadrant B |
|---|---|---|---|
| Quadrant D | 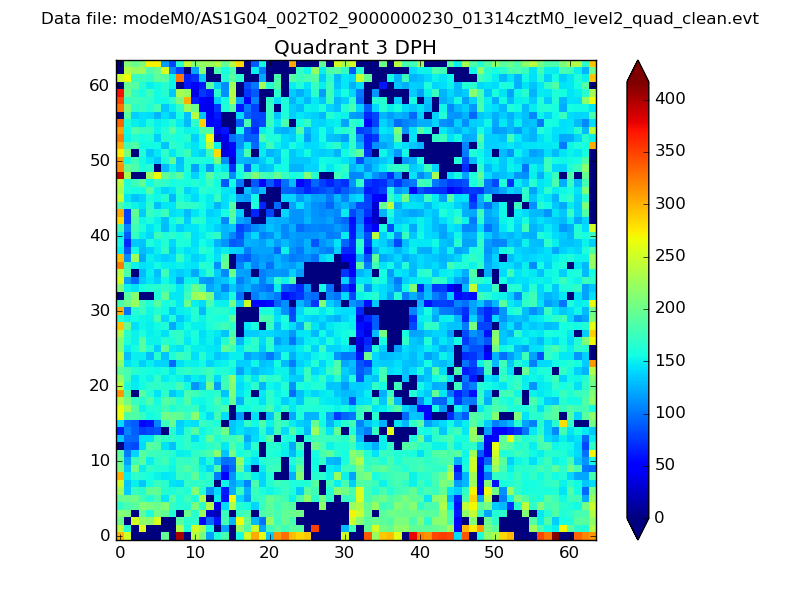 |
 |
Quadrant C |
| Plot type | Count rate plots | Images |
|---|---|---|
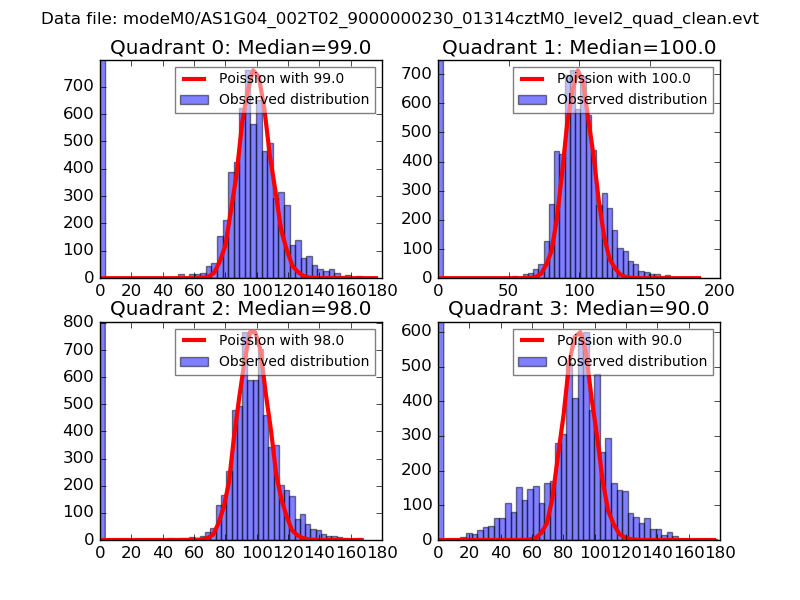
| Comparison with Poisson distribution Blue bars denote a histogram of data divided into 1 sec bins. Red curve is a Poisson curve with rate = median count rate of data. |
 |
 |
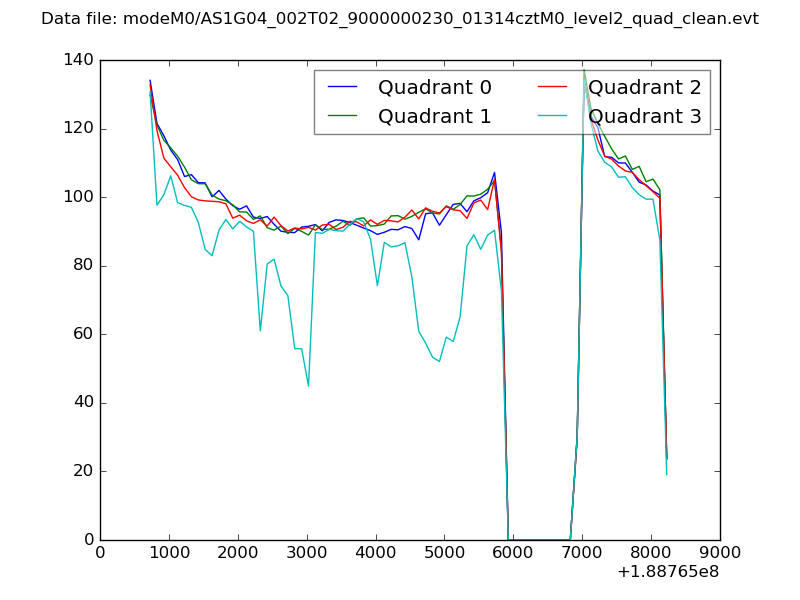
| Quadrant-wise count rates Data is divided into 100 sec bins |
 |
|
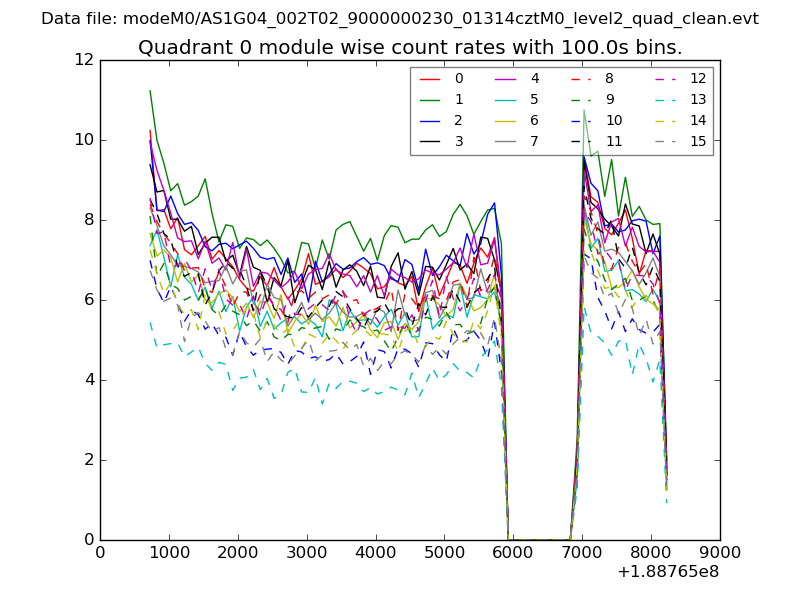
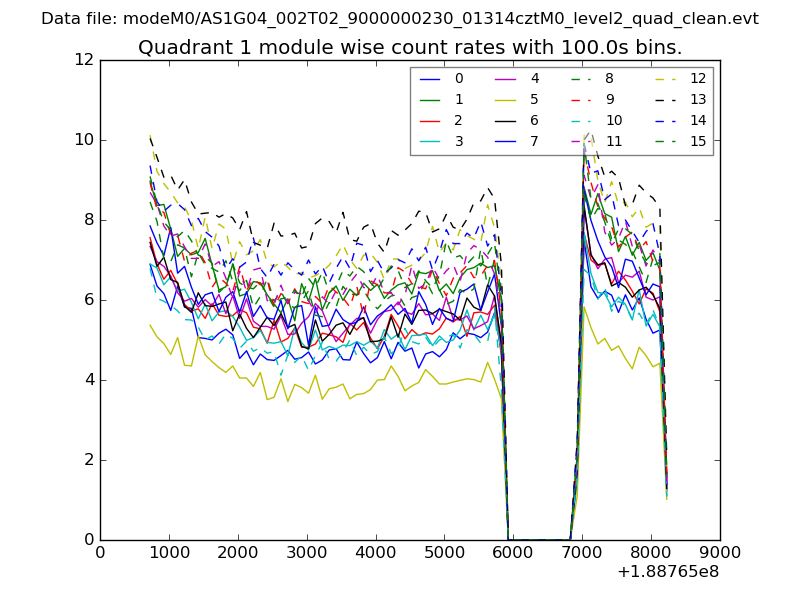
| Module-wise count rates for Quadrant A Data is divided into 100 sec bins |
 |
 |
| Module-wise count rates for Quadrant B Data is divided into 100 sec bins |
 |
 |
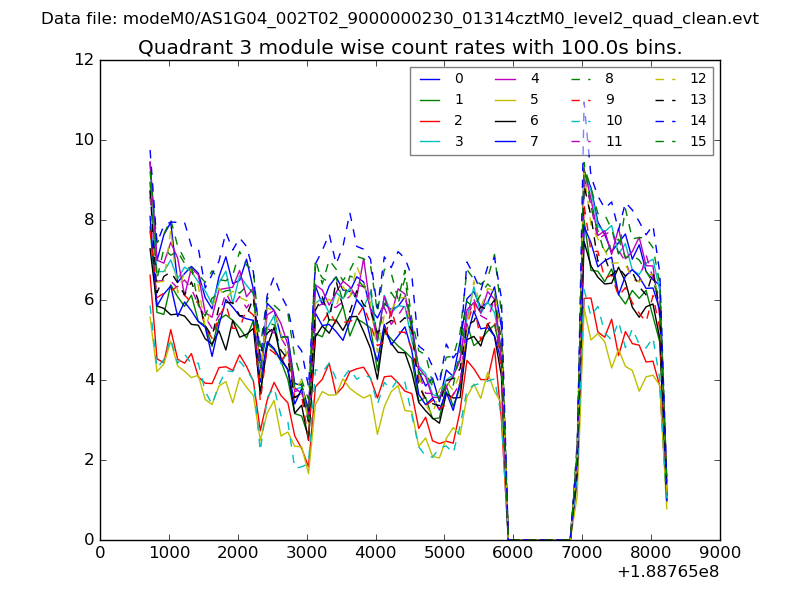
| Module-wise count rates for Quadrant C Data is divided into 100 sec bins |
 |
 |
| Module-wise count rates for Quadrant D Data is divided into 100 sec bins |
 |
 |
| Parameter | Plot |
|---|---|
| CZT HV Monitor | 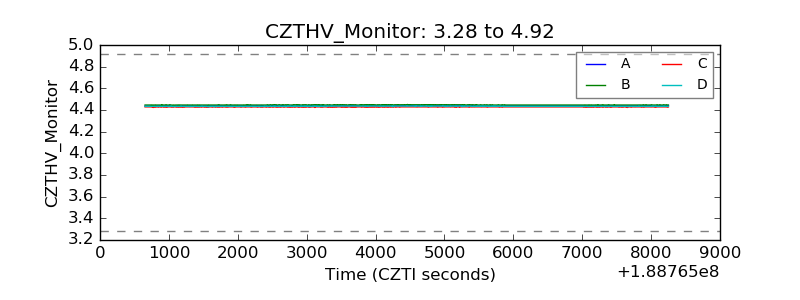 |
| D_VDD | 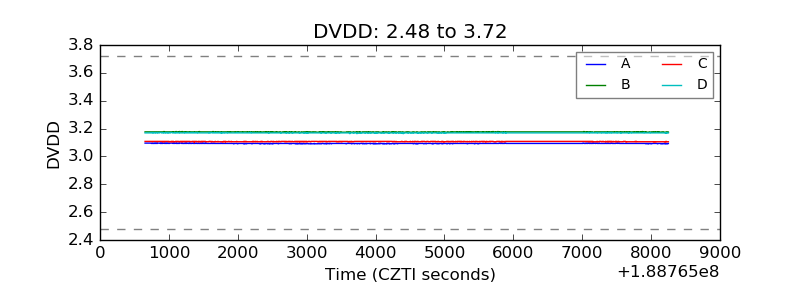 |
| Temperature 1 | 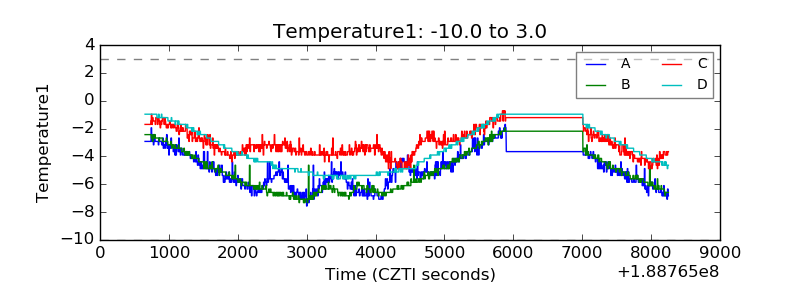 |
| Veto HV Monitor | 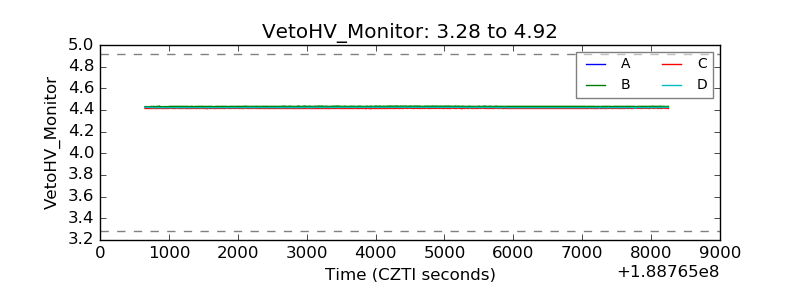 |
| Veto LLD | 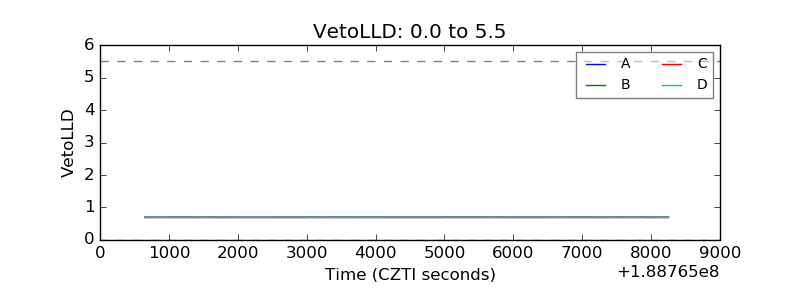 |
| Alpha Counter | 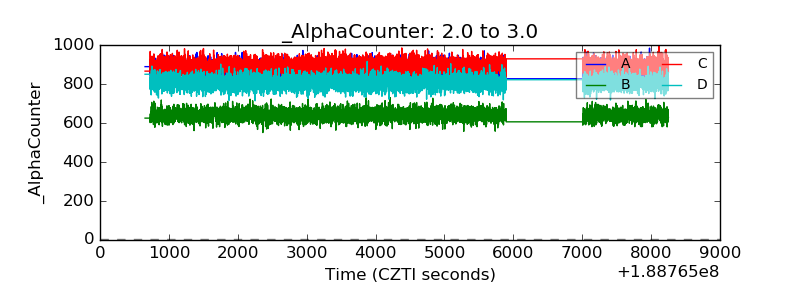 |
| _CPM_Rate | 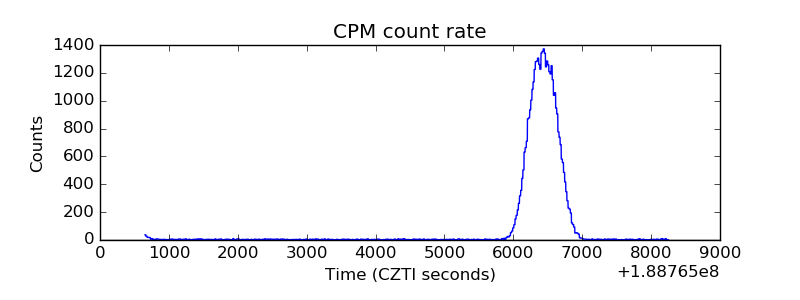 |
| CZT Counter | 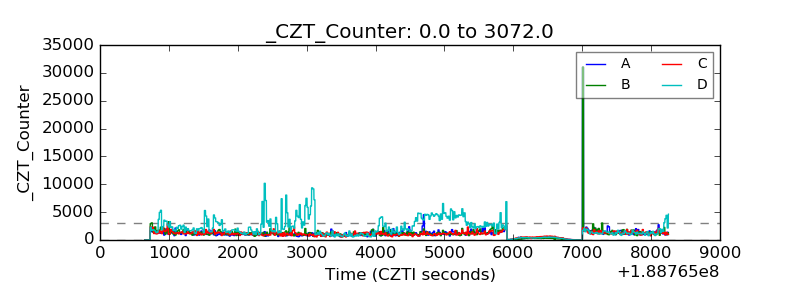 |
| +2.5 Volts monitor |  |
| +5 Volts monitor |  |
| _ROLL_ROT | 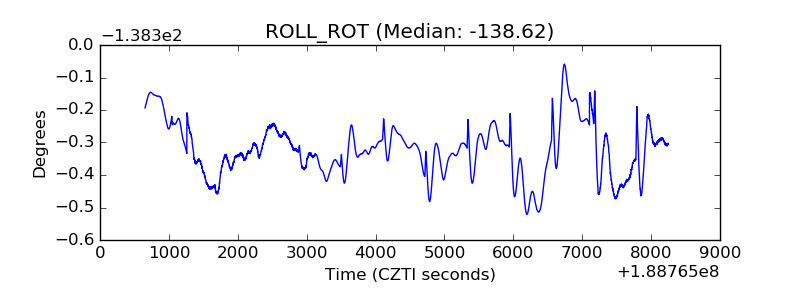 |
| _Roll_DEC | 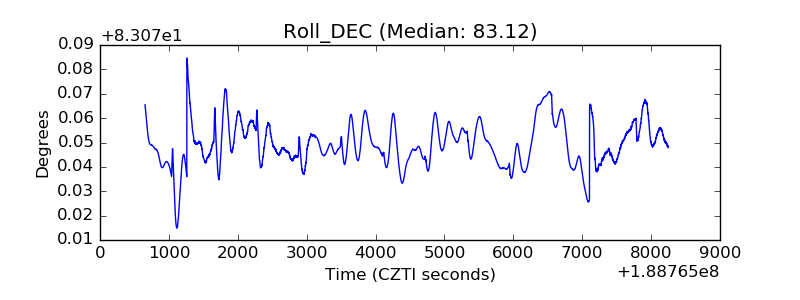 |
| _Roll_RA | 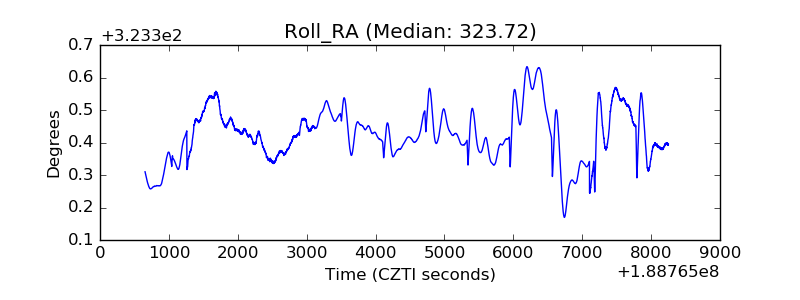 |
| Veto Counter | 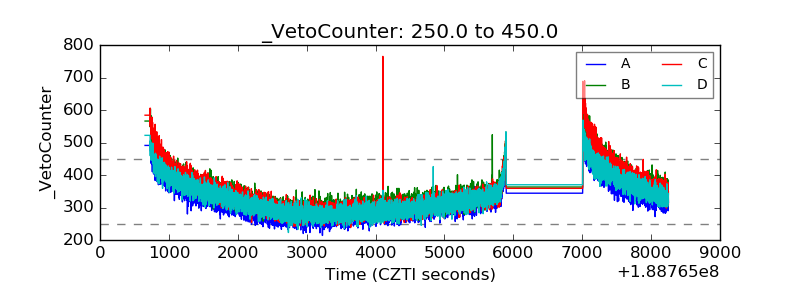 |