| Param | Original file | Final file |
|---|---|---|
| Filename | modeM0/AS1G04_002T02_9000000230_01315cztM0_level2.evt | modeM0/AS1G04_002T02_9000000230_01315cztM0_level2_quad_clean.evt |
| Size (bytes) | 1,046,543,040 | 98,928,000 |
| Size | 998.1 MB | 94.3 MB |
| Events in quadrant A | 7,624,418 | 644,472 |
| Events in quadrant B | 7,918,359 | 653,550 |
| Events in quadrant C | 7,431,616 | 644,195 |
| Events in quadrant D | 8,305,045 | 616,401 |
| Mode M9 | |||
|---|---|---|---|
| Quadrant | BADHDUFLAG | Total packets | Discarded packets |
| A | 0 | 19 | 0 |
| B | 0 | 19 | 0 |
| C | 0 | 19 | 0 |
| D | 0 | 20 | 0 |
| Mode M0 | |||
|---|---|---|---|
| Quadrant | BADHDUFLAG | Total packets | Discarded packets |
| A | 0 | 27093 | 3 |
| B | 0 | 27962 | 2 |
| C | 0 | 26526 | 2 |
| D | 0 | 29144 | 2 |
| Mode SS | |||
|---|---|---|---|
| Quadrant | BADHDUFLAG | Total packets | Discarded packets |
| A | 0 | 128 | 0 |
| B | 0 | 128 | 0 |
| C | 0 | 128 | 0 |
| D | 0 | 128 | 0 |
| Quadrant | Total seconds | Saturated seconds | Saturation percentage |
|---|---|---|---|
| A | 6264 | 18 | 0.287356% |
| B | 6264 | 38 | 0.606641% |
| C | 6264 | 6 | 0.095785% |
| D | 6264 | 289 | 4.613665% |
Noise dominated data is calculated using 1-second bins in cleaned event files. If a bin has >2000 counts, and if more than 50% of those come from <1% of pixels, then it is considered to be noise-dominated and hence unusable.
| Quadrant | # 1 sec bins | Bins with >0 counts | Bins with >2000 counts | High rate bins dominated by noise | Noise dominated (total time) | Noise dominated (detector-on time) | Marked lightcurve |
|---|---|---|---|---|---|---|---|
| A | 7489 | 6265 | 238 | 238 | 3.18% | 3.80% | 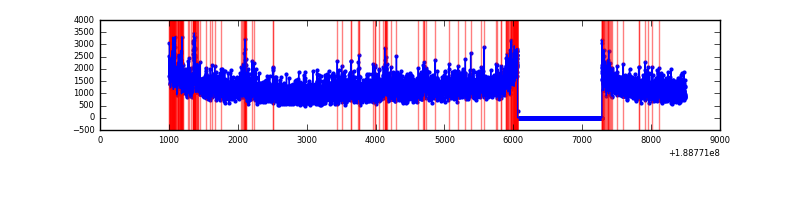 |
| B | 7489 | 6265 | 281 | 281 | 3.75% | 4.49% | 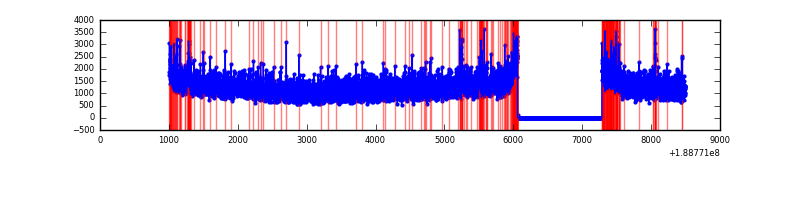 |
| C | 7489 | 6265 | 163 | 163 | 2.18% | 2.60% | 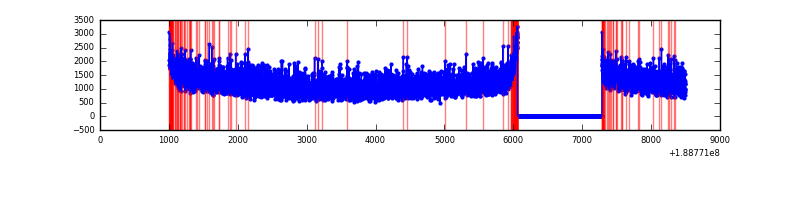 |
| D | 7489 | 6264 | 774 | 774 | 10.34% | 12.36% | 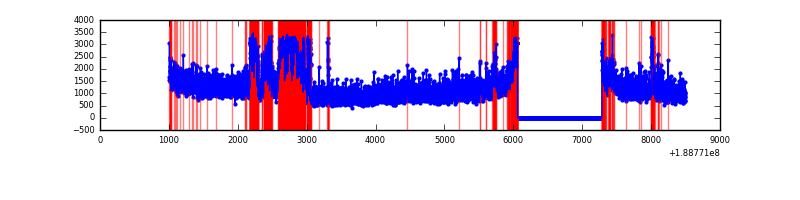 |
Top three noisy pixels from each quadrant. If the there are fewer than three noisy pixels in the level2.evt file, extra rows are filled as -1
| Pixel properties | Quadrant properties | ||||||
|---|---|---|---|---|---|---|---|
| Quadrant | DetID | PixID | Counts | Sigma | Mean | Median | Sigma |
| A | 4 | 32 | 413900 | 921.74 | 1872 | 1882 | 447.0 |
| A | 0 | 128 | 16963 | 33.74 | 1872 | 1882 | 447.0 |
| A | 13 | 235 | 7317 | 12.16 | 1872 | 1882 | 447.0 |
| B | 0 | 220 | 108642 | 235.08 | 1963 | 1971 | 453.8 |
| B | 5 | 249 | 85549 | 184.19 | 1963 | 1971 | 453.8 |
| B | 8 | 4 | 82631 | 177.76 | 1963 | 1971 | 453.8 |
| C | 15 | 241 | 303420 | 598.81 | 1811 | 1877 | 503.6 |
| C | 3 | 111 | 19812 | 35.62 | 1811 | 1877 | 503.6 |
| C | 9 | 52 | 14606 | 25.28 | 1811 | 1877 | 503.6 |
| D | 10 | 84 | 1428669 | 2700.09 | 1715 | 1776 | 528.5 |
| D | 12 | 22 | 263569 | 495.39 | 1715 | 1776 | 528.5 |
| D | 15 | 13 | 112724 | 209.94 | 1715 | 1776 | 528.5 |
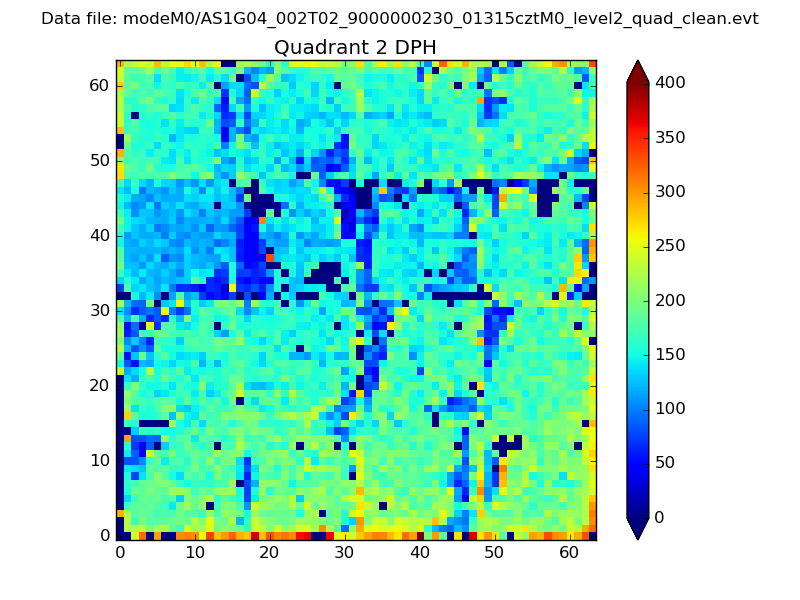
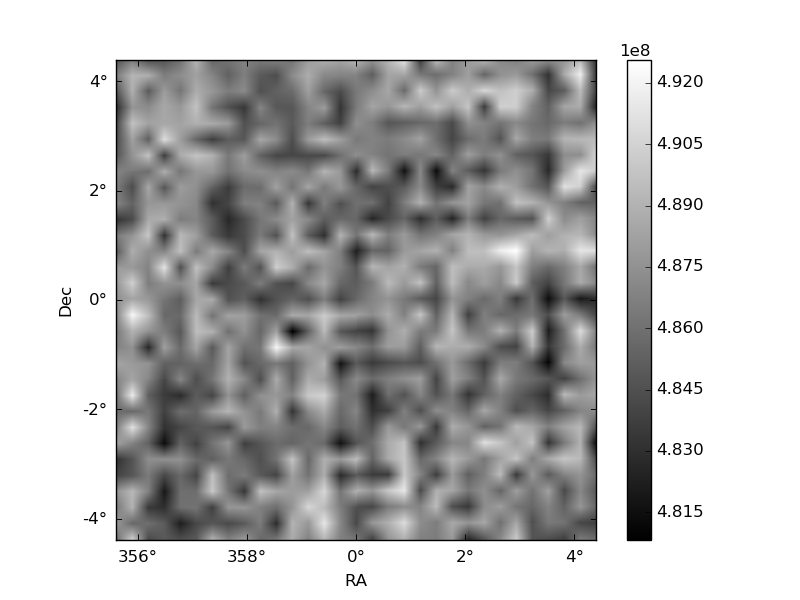
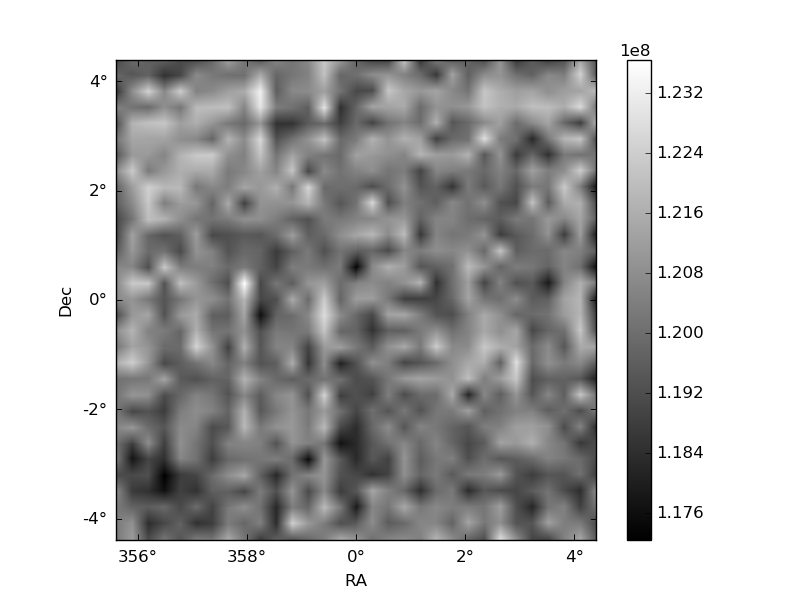
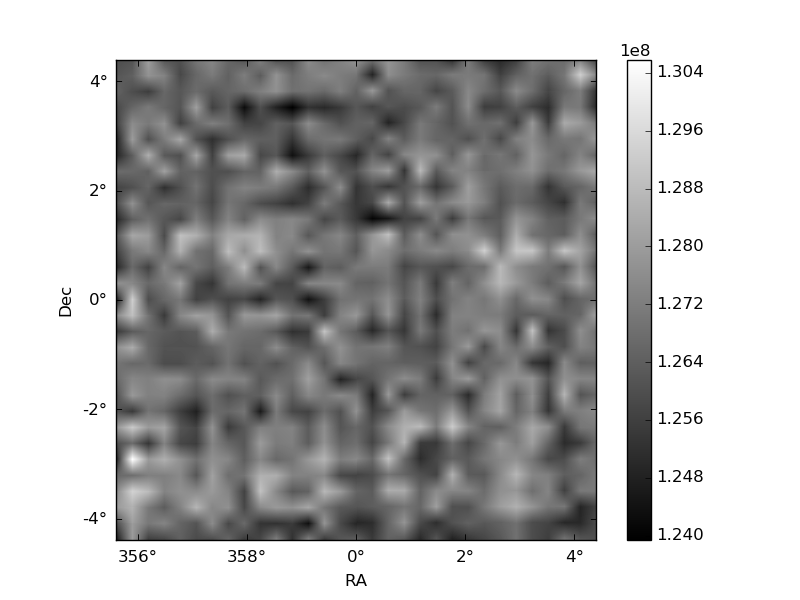
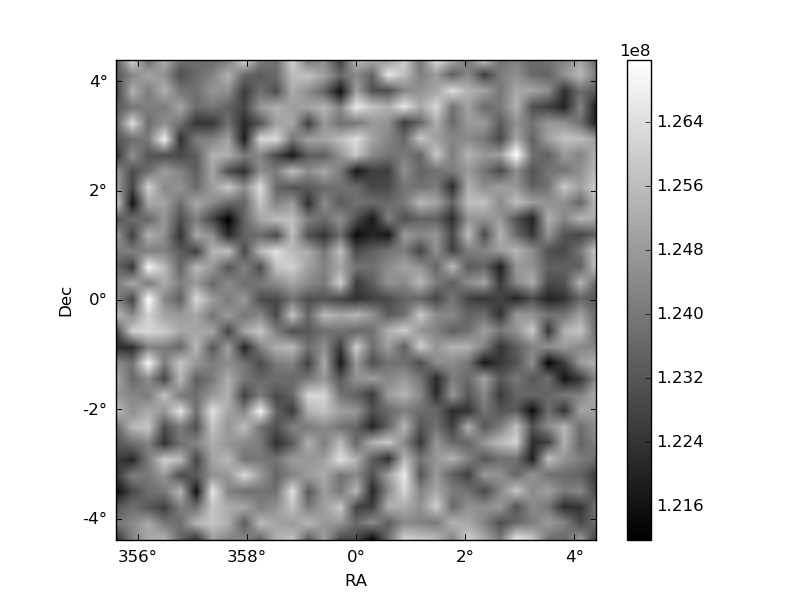
Histogram calculated using DETX and DETY for each event in the final _common_clean file
| Quadrant A | 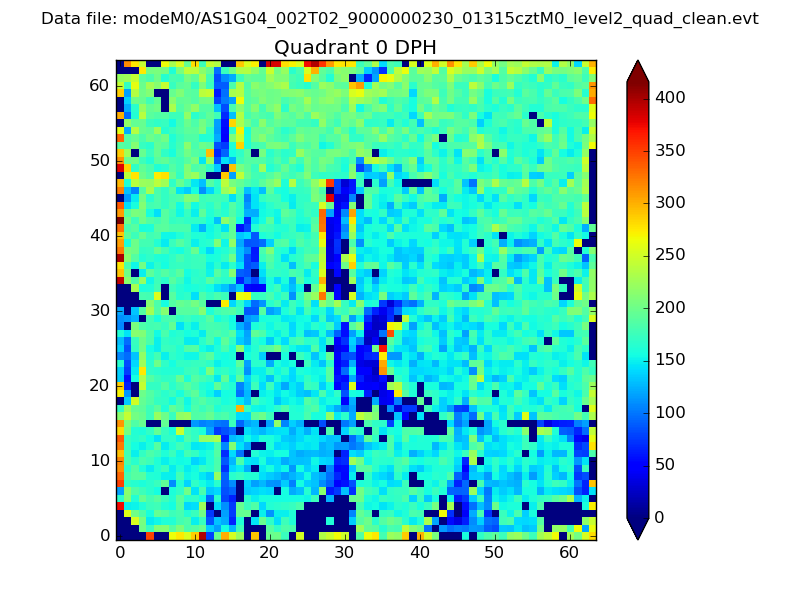 |
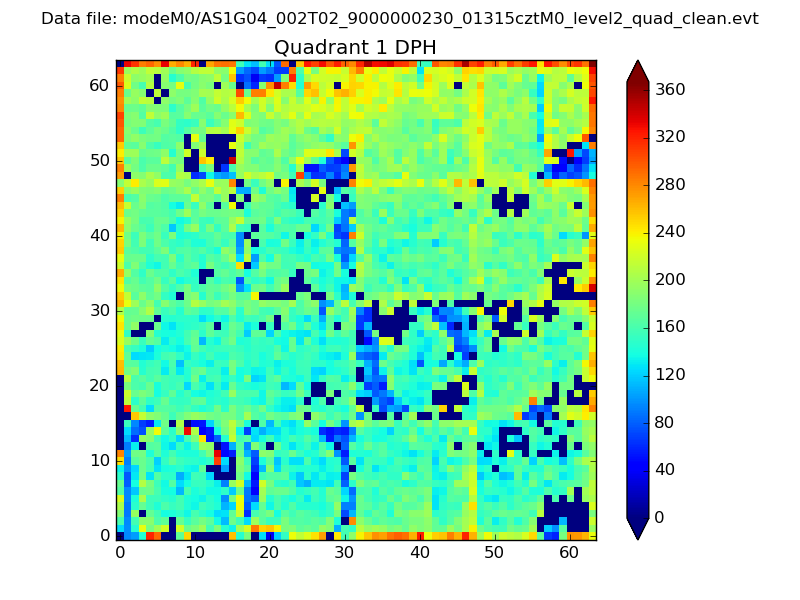 |
Quadrant B |
|---|---|---|---|
| Quadrant D | 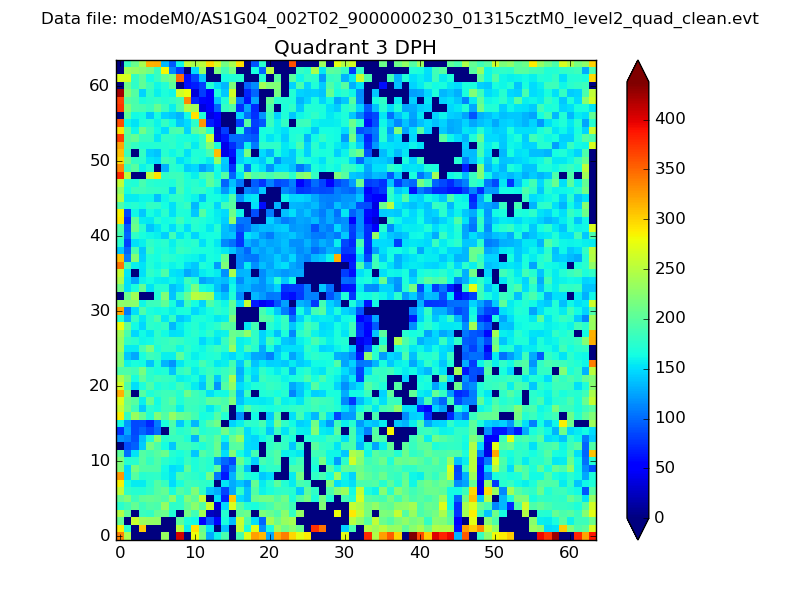 |
 |
Quadrant C |
| Plot type | Count rate plots | Images |
|---|---|---|
| Comparison with Poisson distribution Blue bars denote a histogram of data divided into 1 sec bins. Red curve is a Poisson curve with rate = median count rate of data. |
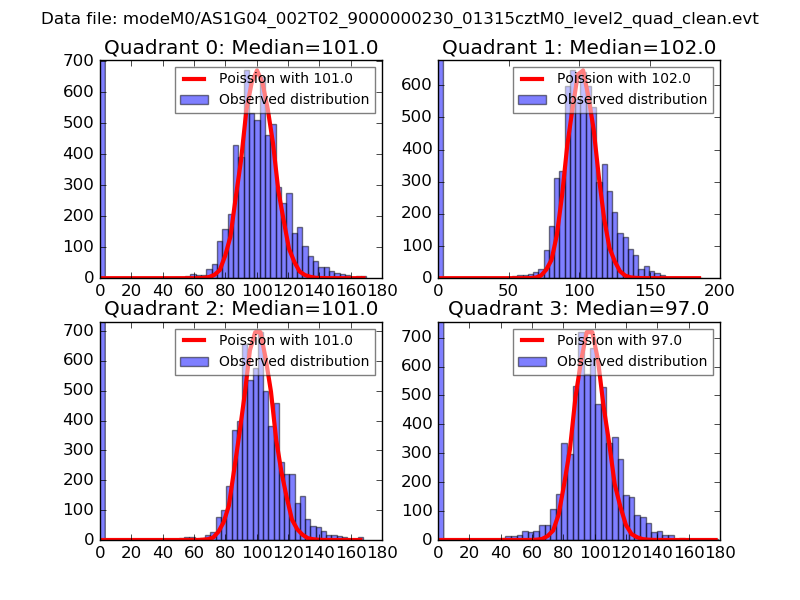 |
 |
| Quadrant-wise count rates Data is divided into 100 sec bins |
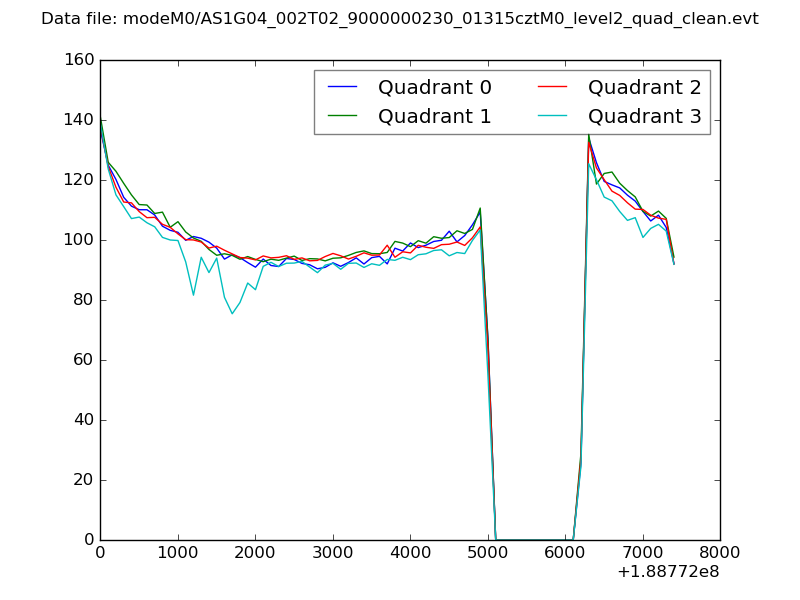 |
|
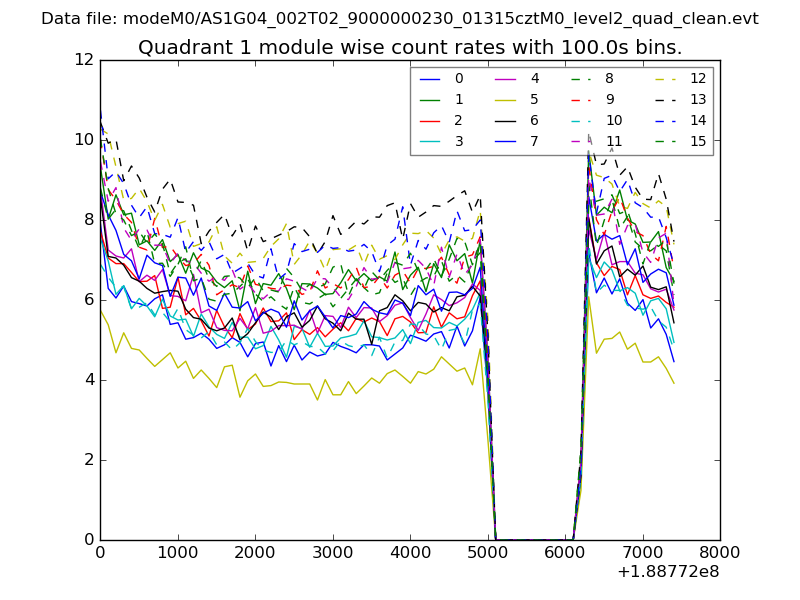
| Module-wise count rates for Quadrant A Data is divided into 100 sec bins |
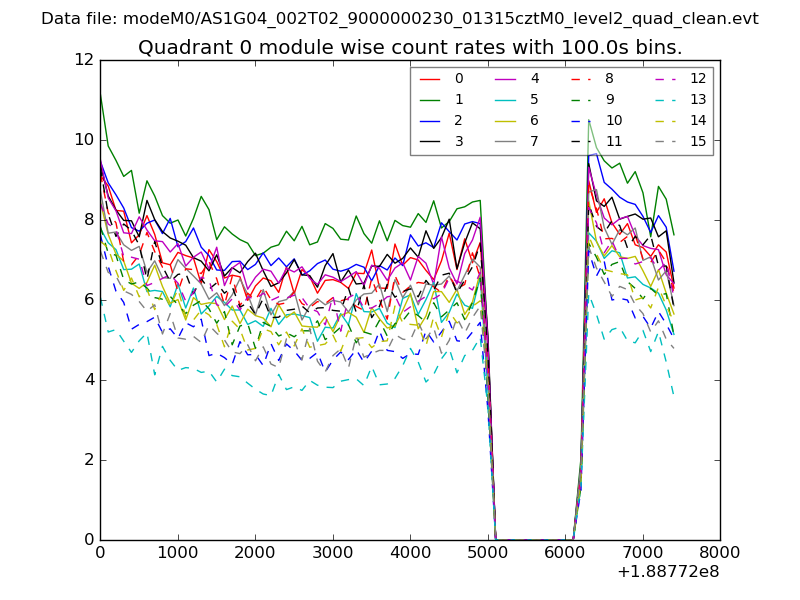 |
 |
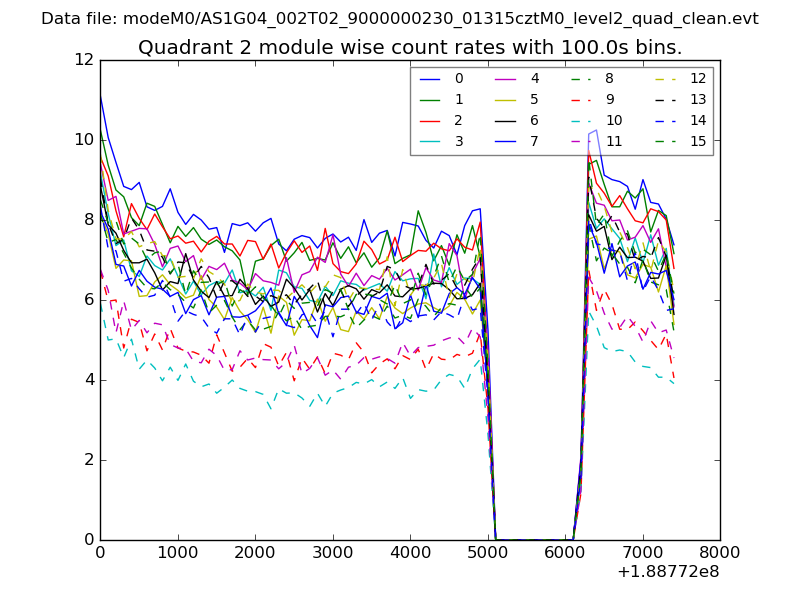
| Module-wise count rates for Quadrant B Data is divided into 100 sec bins |
 |
 |
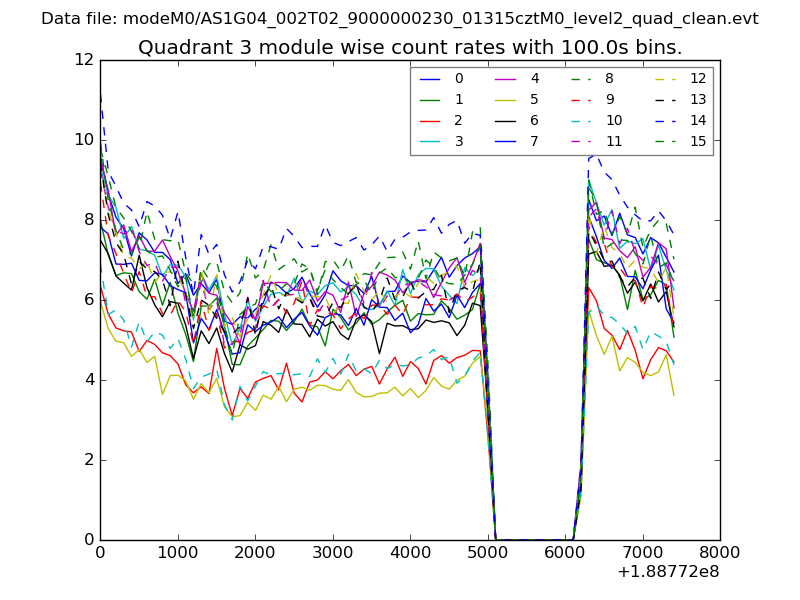
| Module-wise count rates for Quadrant C Data is divided into 100 sec bins |
 |
 |
| Module-wise count rates for Quadrant D Data is divided into 100 sec bins |
 |
 |
| Parameter | Plot |
|---|---|
| CZT HV Monitor | 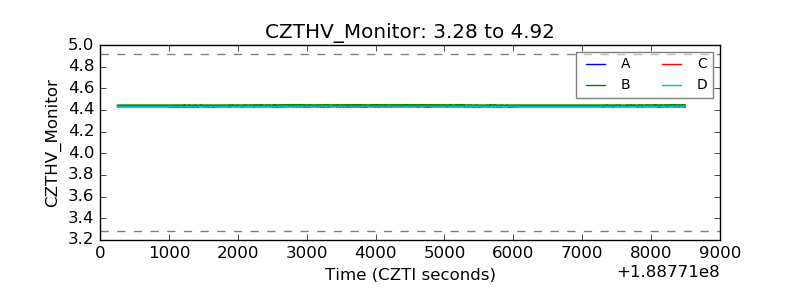 |
| D_VDD | 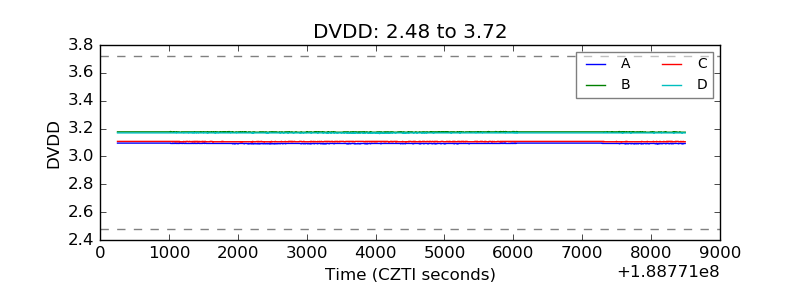 |
| Temperature 1 | 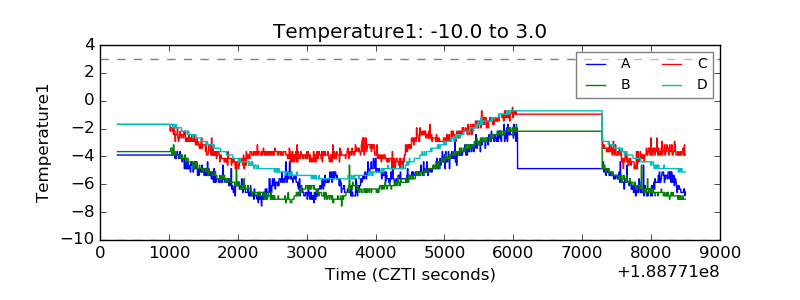 |
| Veto HV Monitor | 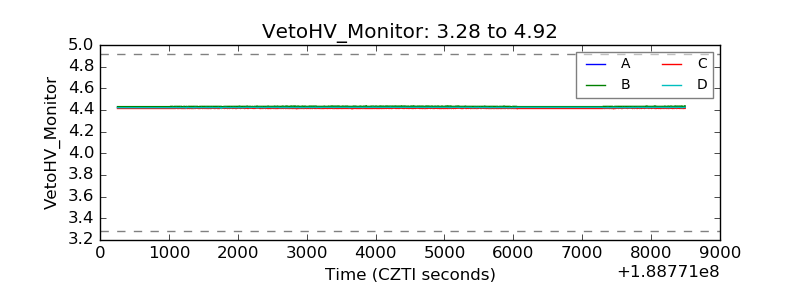 |
| Veto LLD | 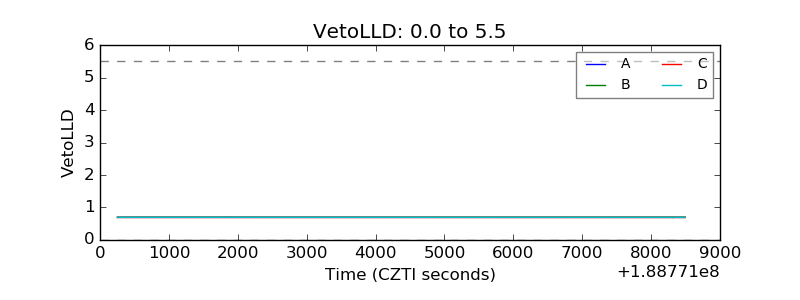 |
| Alpha Counter | 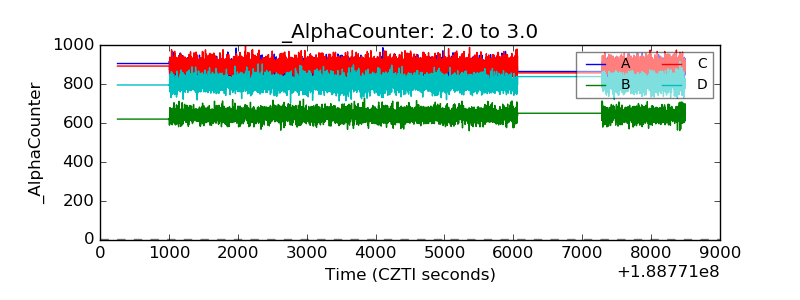 |
| _CPM_Rate | 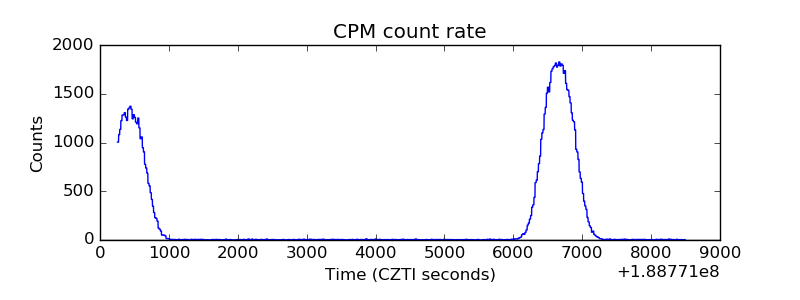 |
| CZT Counter | 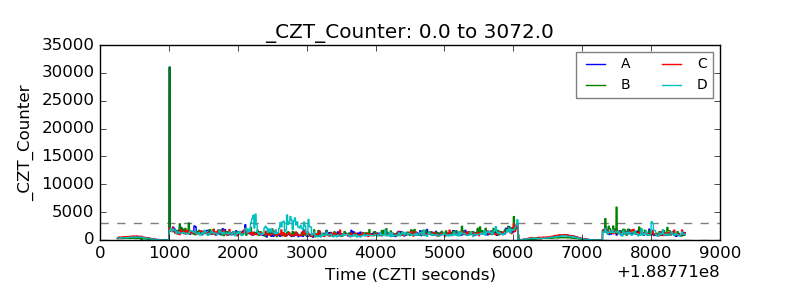 |
| +2.5 Volts monitor | 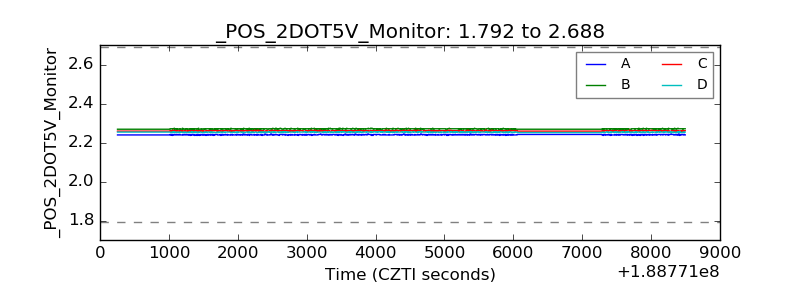 |
| +5 Volts monitor | 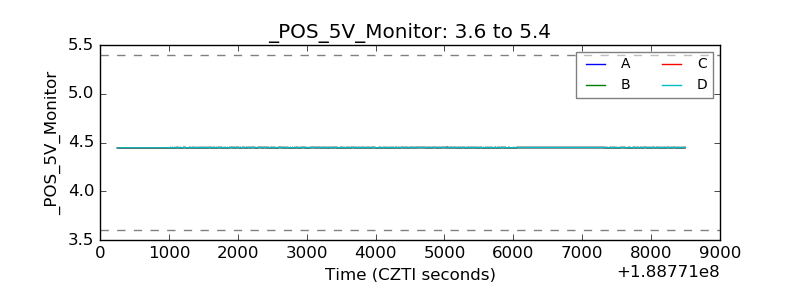 |
| _ROLL_ROT |  |
| _Roll_DEC | 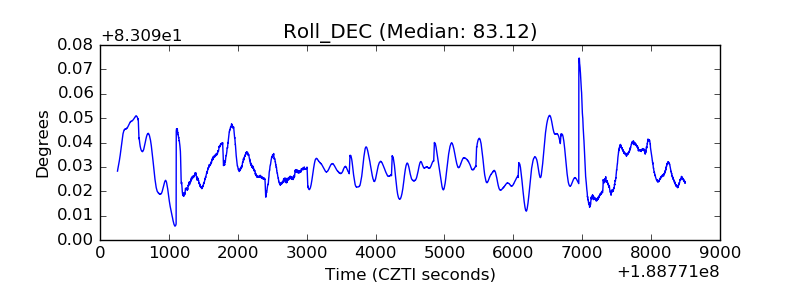 |
| _Roll_RA | 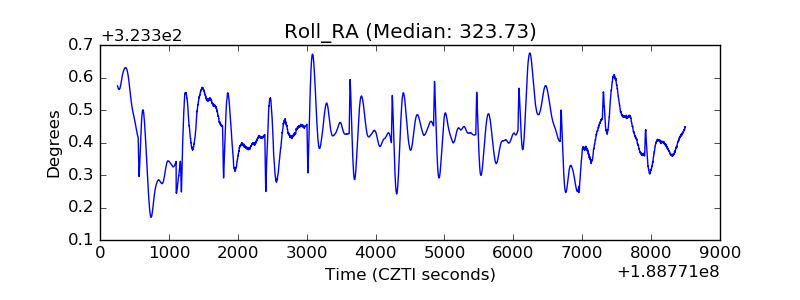 |
| Veto Counter | 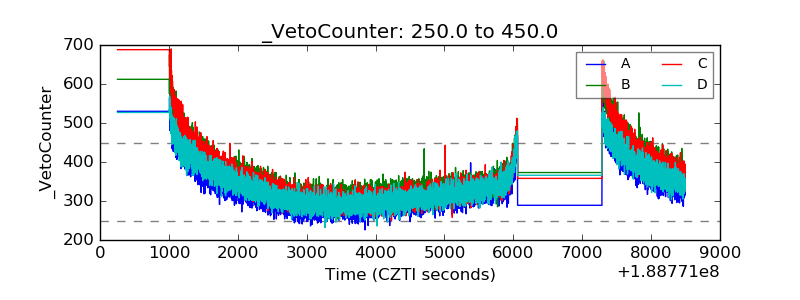 |