| Param | Original file | Final file |
|---|---|---|
| Filename | modeM0/AS1G04_002T02_9000000230_01316cztM0_level2.evt | modeM0/AS1G04_002T02_9000000230_01316cztM0_level2_quad_clean.evt |
| Size (bytes) | 1,071,650,880 | 103,936,320 |
| Size | 1022.0 MB | 99.1 MB |
| Events in quadrant A | 8,272,659 | 674,583 |
| Events in quadrant B | 8,345,896 | 693,388 |
| Events in quadrant C | 7,651,656 | 681,282 |
| Events in quadrant D | 7,752,272 | 643,363 |
| Mode M9 | |||
|---|---|---|---|
| Quadrant | BADHDUFLAG | Total packets | Discarded packets |
| A | 0 | 23 | 0 |
| B | 0 | 23 | 0 |
| C | 0 | 23 | 0 |
| D | 0 | 24 | 0 |
| Mode M0 | |||
|---|---|---|---|
| Quadrant | BADHDUFLAG | Total packets | Discarded packets |
| A | 0 | 29225 | 3 |
| B | 0 | 29397 | 2 |
| C | 0 | 27400 | 2 |
| D | 0 | 27694 | 2 |
| Mode SS | |||
|---|---|---|---|
| Quadrant | BADHDUFLAG | Total packets | Discarded packets |
| A | 0 | 132 | 0 |
| B | 0 | 132 | 0 |
| C | 0 | 132 | 0 |
| D | 0 | 132 | 0 |
| Quadrant | Total seconds | Saturated seconds | Saturation percentage |
|---|---|---|---|
| A | 6526 | 118 | 1.808152% |
| B | 6526 | 33 | 0.505670% |
| C | 6526 | 9 | 0.137910% |
| D | 6526 | 251 | 3.846154% |
Noise dominated data is calculated using 1-second bins in cleaned event files. If a bin has >2000 counts, and if more than 50% of those come from <1% of pixels, then it is considered to be noise-dominated and hence unusable.
| Quadrant | # 1 sec bins | Bins with >0 counts | Bins with >2000 counts | High rate bins dominated by noise | Noise dominated (total time) | Noise dominated (detector-on time) | Marked lightcurve |
|---|---|---|---|---|---|---|---|
| A | 7821 | 6527 | 461 | 461 | 5.89% | 7.06% | 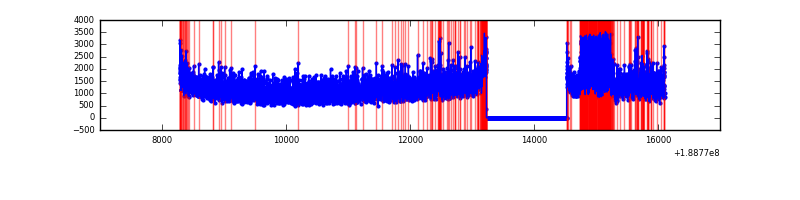 |
| B | 7821 | 6527 | 370 | 370 | 4.73% | 5.67% | 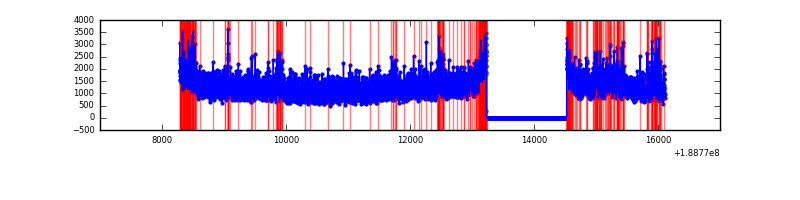 |
| C | 7821 | 6527 | 145 | 145 | 1.85% | 2.22% |  |
| D | 7821 | 6527 | 551 | 551 | 7.05% | 8.44% | 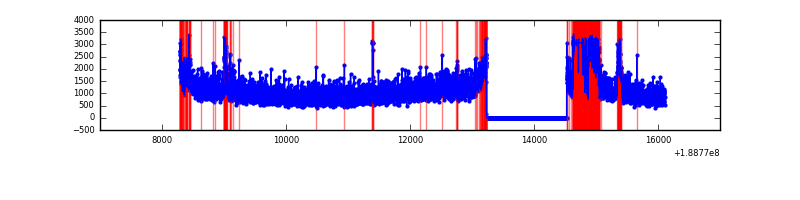 |
Top three noisy pixels from each quadrant. If the there are fewer than three noisy pixels in the level2.evt file, extra rows are filled as -1
| Pixel properties | Quadrant properties | ||||||
|---|---|---|---|---|---|---|---|
| Quadrant | DetID | PixID | Counts | Sigma | Mean | Median | Sigma |
| A | 4 | 32 | 846408 | 1842.04 | 1929 | 1943 | 458.4 |
| A | 11 | 79 | 8797 | 14.95 | 1929 | 1943 | 458.4 |
| A | 12 | 243 | 8231 | 13.72 | 1929 | 1943 | 458.4 |
| B | 0 | 182 | 222276 | 465.91 | 2037 | 2051 | 472.7 |
| B | 8 | 4 | 178592 | 373.49 | 2037 | 2051 | 472.7 |
| B | 6 | 53 | 128353 | 267.2 | 2037 | 2051 | 472.7 |
| C | 15 | 241 | 326864 | 637.72 | 1852 | 1915 | 509.5 |
| C | 9 | 52 | 44585 | 83.74 | 1852 | 1915 | 509.5 |
| C | 3 | 111 | 20027 | 35.54 | 1852 | 1915 | 509.5 |
| D | 10 | 84 | 826388 | 1552.7 | 1734 | 1793 | 531.1 |
| D | 1 | 83 | 240871 | 450.18 | 1734 | 1793 | 531.1 |
| D | 15 | 13 | 131869 | 244.93 | 1734 | 1793 | 531.1 |
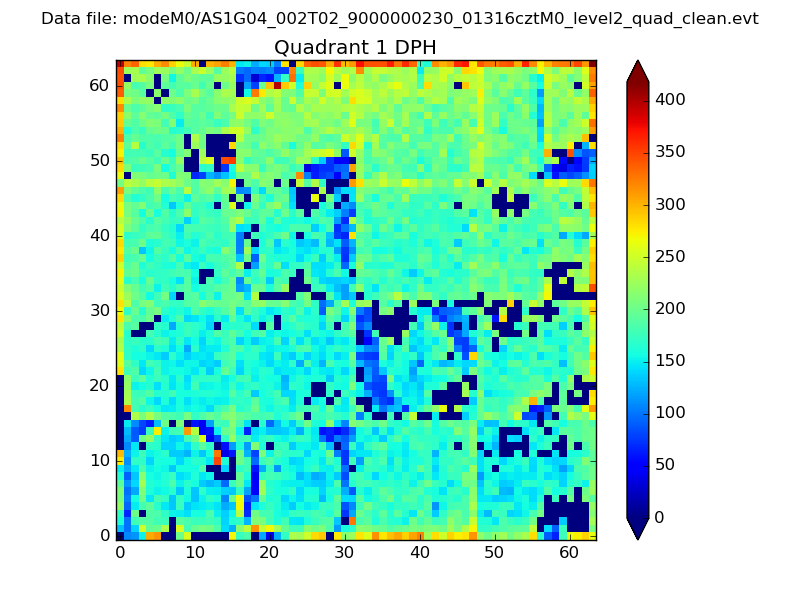
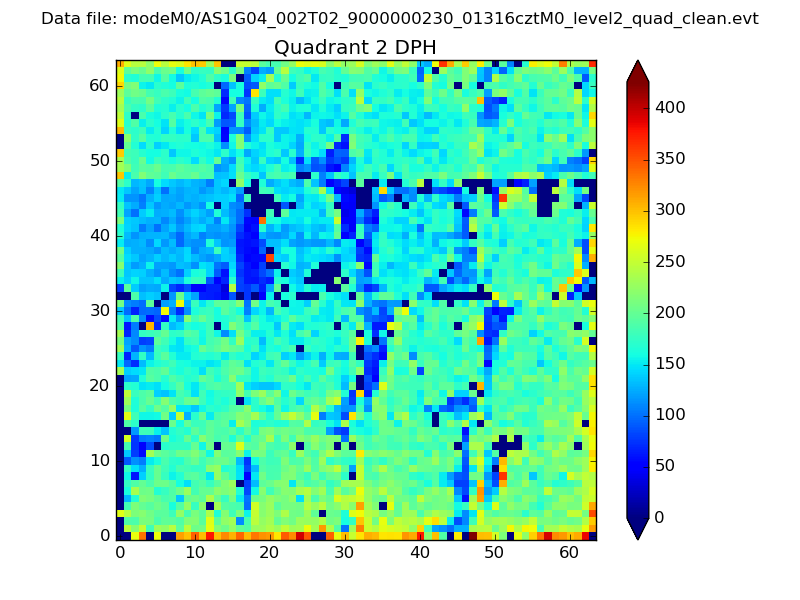
Histogram calculated using DETX and DETY for each event in the final _common_clean file
| Quadrant A | 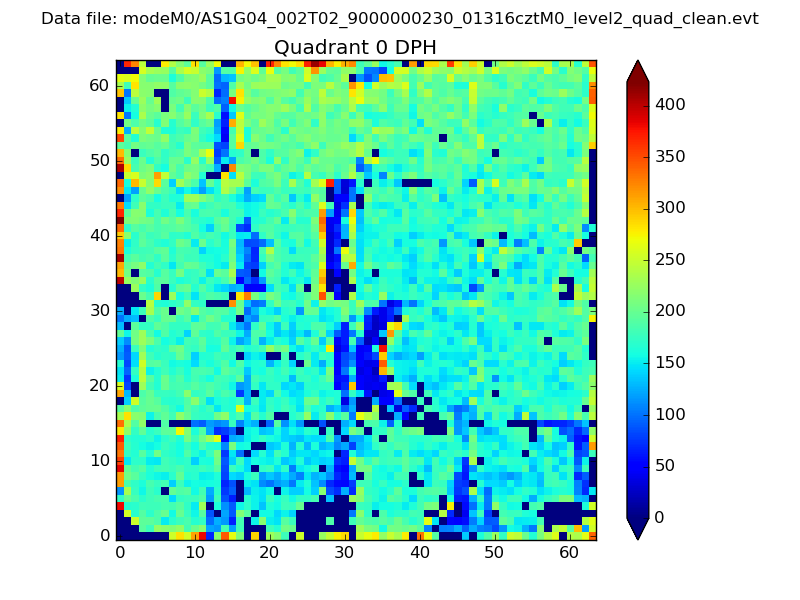 |
 |
Quadrant B |
|---|---|---|---|
| Quadrant D | 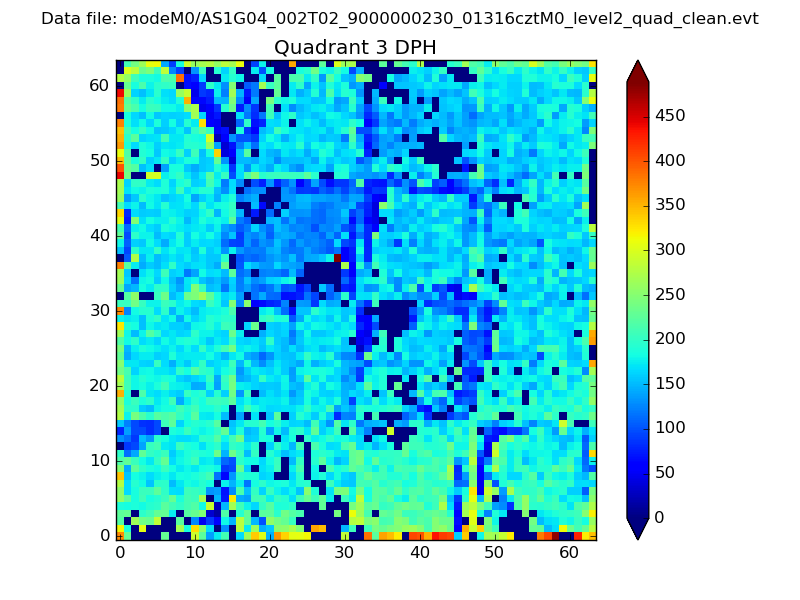 |
 |
Quadrant C |
| Plot type | Count rate plots | Images |
|---|---|---|
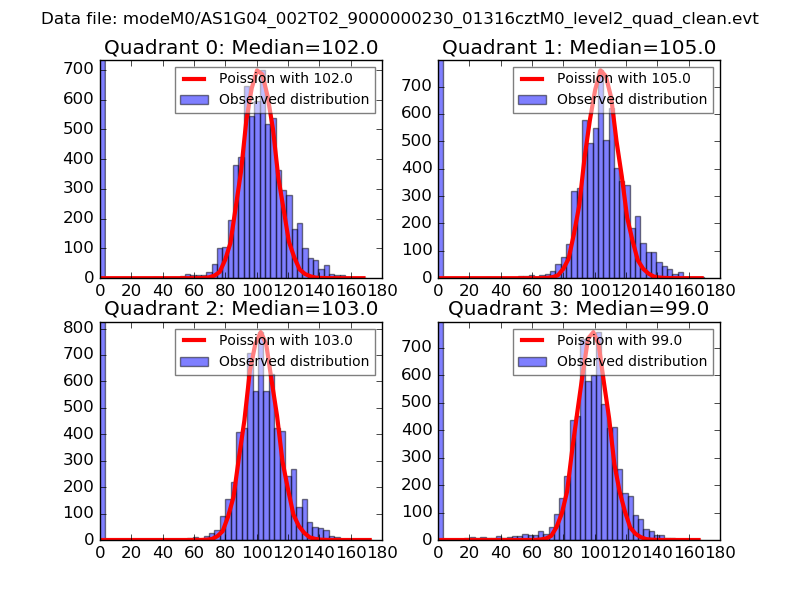
| Comparison with Poisson distribution Blue bars denote a histogram of data divided into 1 sec bins. Red curve is a Poisson curve with rate = median count rate of data. |
 |
 |
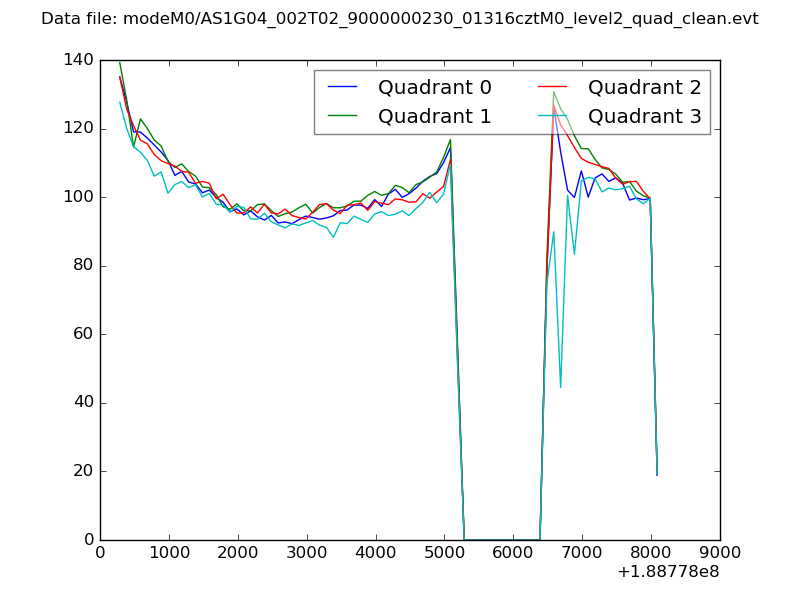
| Quadrant-wise count rates Data is divided into 100 sec bins |
 |
|
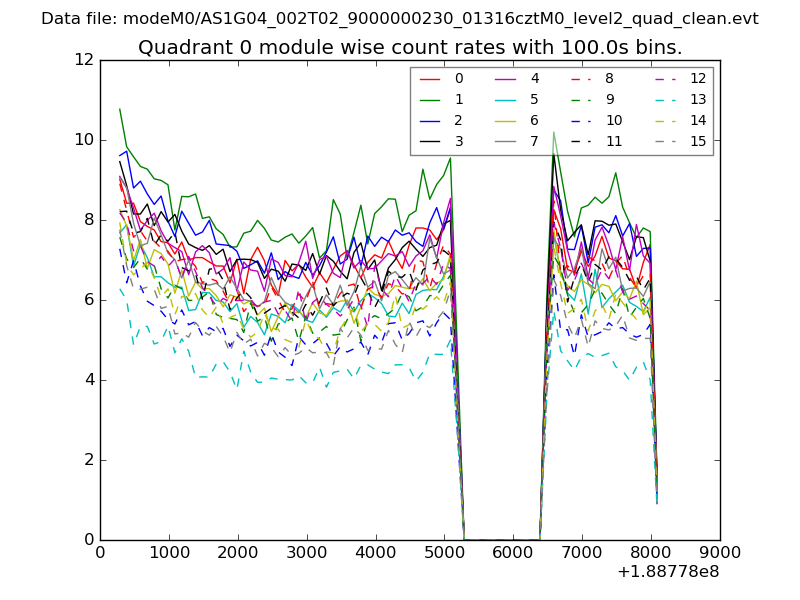
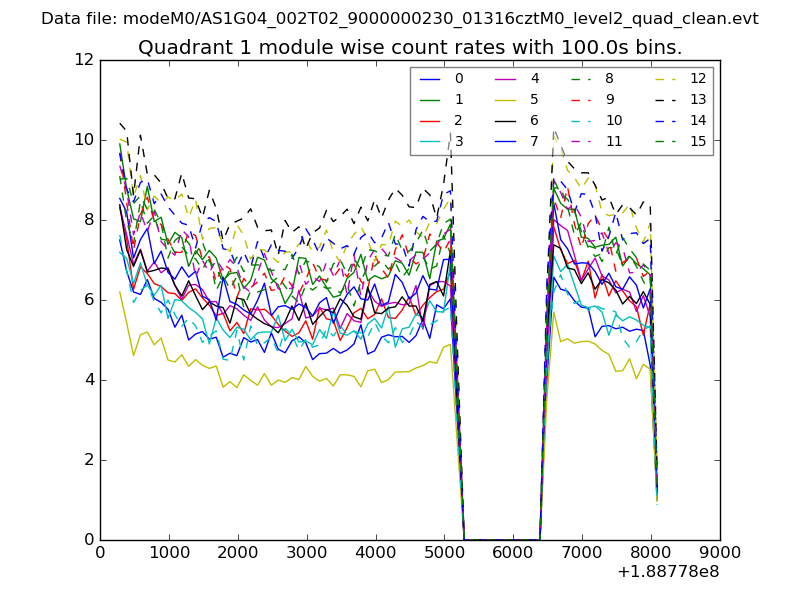
| Module-wise count rates for Quadrant A Data is divided into 100 sec bins |
 |
 |
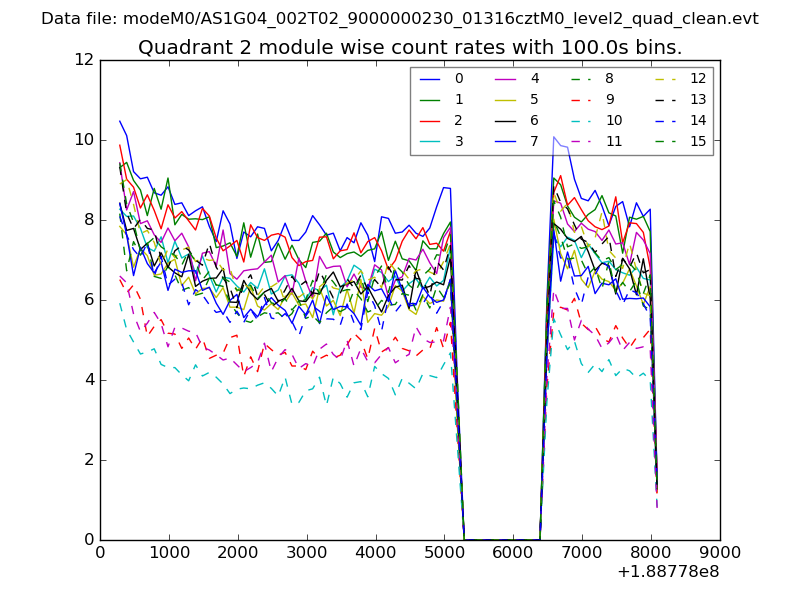
| Module-wise count rates for Quadrant B Data is divided into 100 sec bins |
 |
 |
| Module-wise count rates for Quadrant C Data is divided into 100 sec bins |
 |
 |
| Module-wise count rates for Quadrant D Data is divided into 100 sec bins |
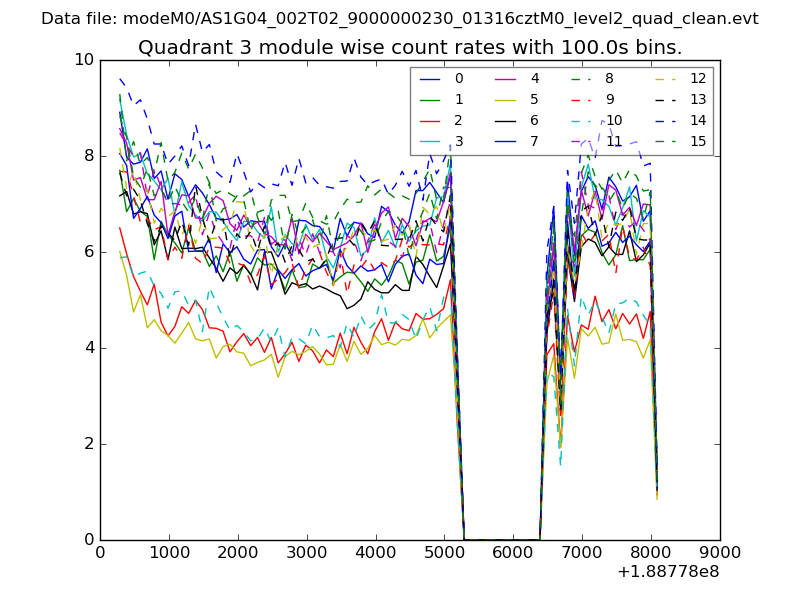 |
 |
| Parameter | Plot |
|---|---|
| CZT HV Monitor | 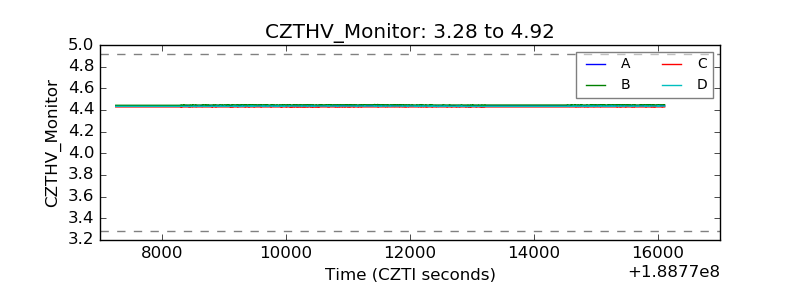 |
| D_VDD | 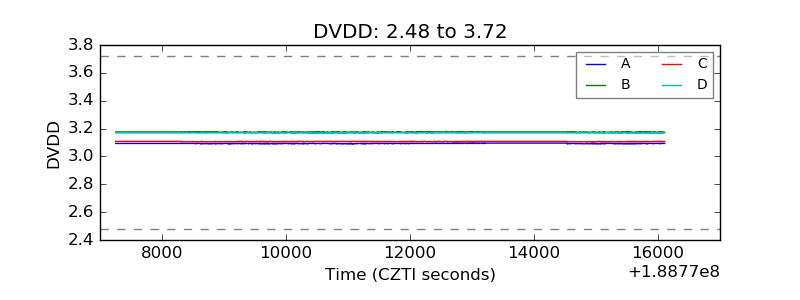 |
| Temperature 1 | 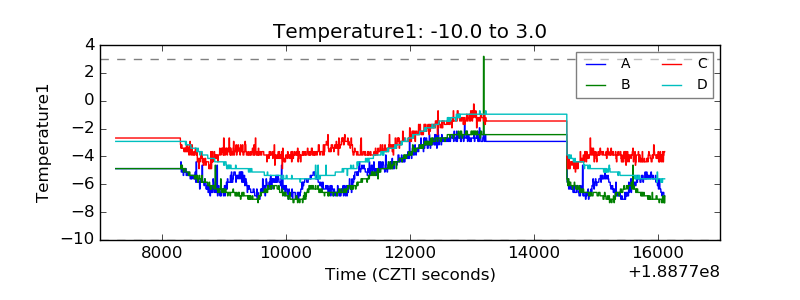 |
| Veto HV Monitor | 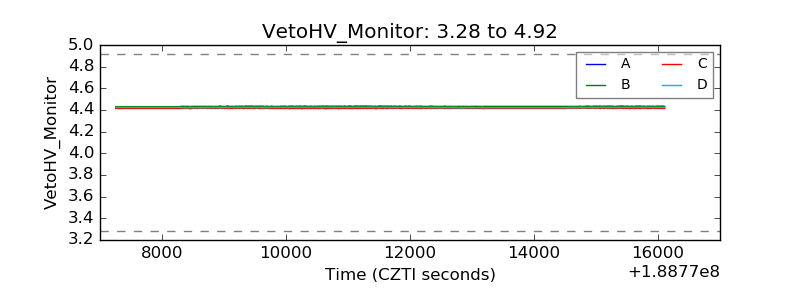 |
| Veto LLD | 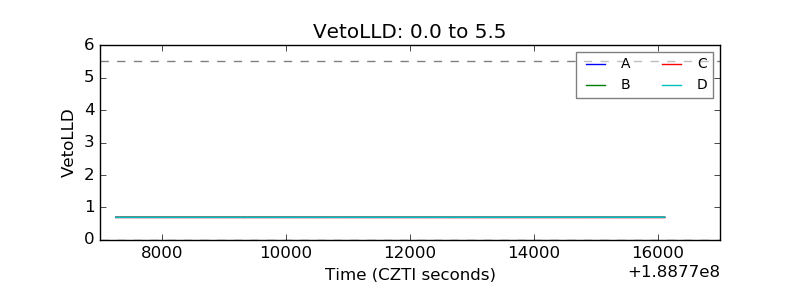 |
| Alpha Counter | 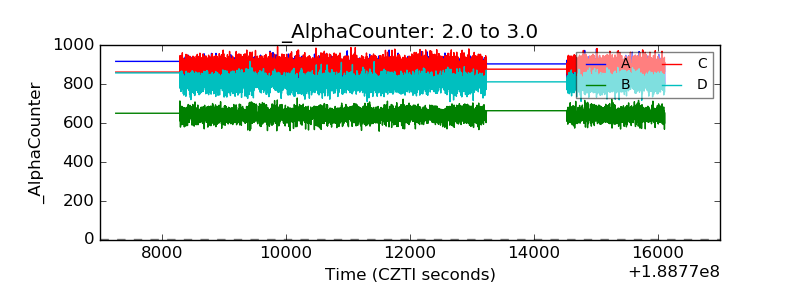 |
| _CPM_Rate | 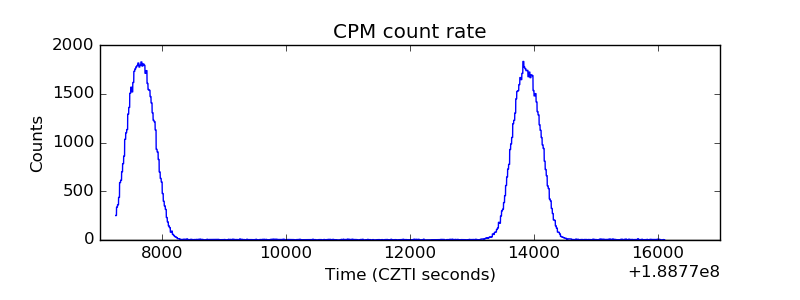 |
| CZT Counter | 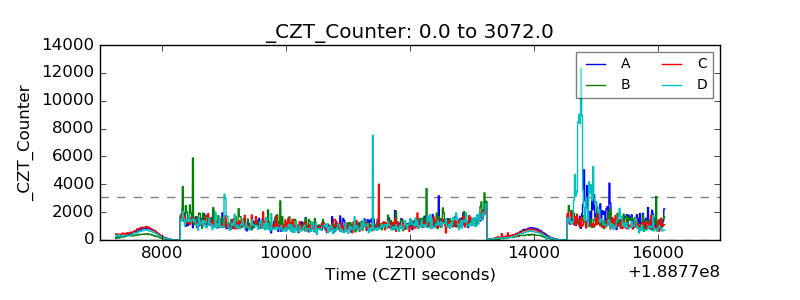 |
| +2.5 Volts monitor |  |
| +5 Volts monitor |  |
| _ROLL_ROT | 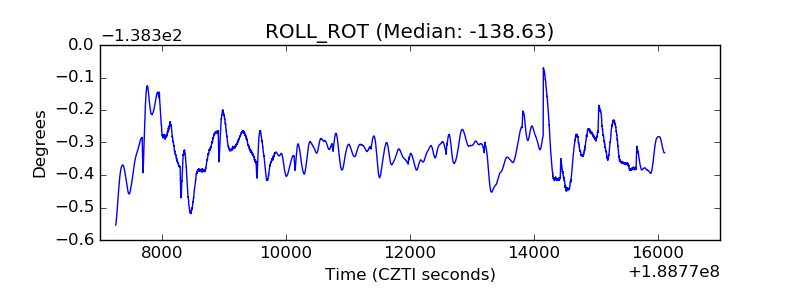 |
| _Roll_DEC | 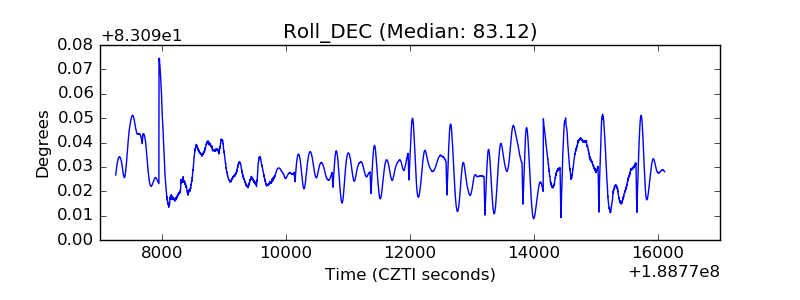 |
| _Roll_RA | 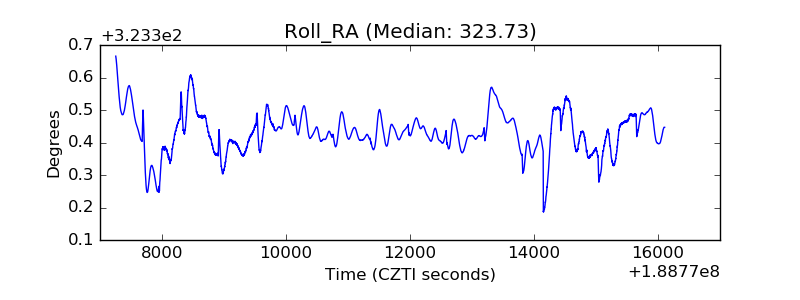 |
| Veto Counter | 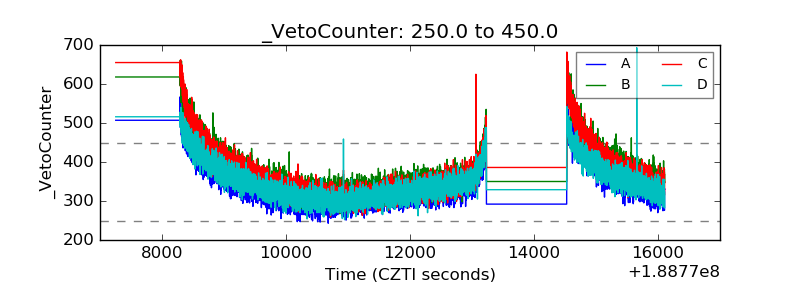 |