| Param | Original file | Final file |
|---|---|---|
| Filename | modeM0/AS1G04_002T02_9000000230_01317cztM0_level2.evt | modeM0/AS1G04_002T02_9000000230_01317cztM0_level2_quad_clean.evt |
| Size (bytes) | 1,233,829,440 | 101,891,520 |
| Size | 1.1 GB | 97.2 MB |
| Events in quadrant A | 13,322,134 | 613,582 |
| Events in quadrant B | 8,423,614 | 696,554 |
| Events in quadrant C | 7,598,972 | 677,597 |
| Events in quadrant D | 7,589,566 | 640,670 |
| Mode M9 | |||
|---|---|---|---|
| Quadrant | BADHDUFLAG | Total packets | Discarded packets |
| A | 0 | 12 | 0 |
| B | 0 | 12 | 0 |
| C | 0 | 12 | 0 |
| D | 0 | 12 | 0 |
| Mode M0 | |||
|---|---|---|---|
| Quadrant | BADHDUFLAG | Total packets | Discarded packets |
| A | 0 | 44341 | 2 |
| B | 0 | 29654 | 1 |
| C | 0 | 27244 | 1 |
| D | 0 | 27270 | 1 |
| Mode SS | |||
|---|---|---|---|
| Quadrant | BADHDUFLAG | Total packets | Discarded packets |
| A | 0 | 134 | 0 |
| B | 0 | 134 | 0 |
| C | 0 | 134 | 0 |
| D | 0 | 134 | 0 |
| Quadrant | Total seconds | Saturated seconds | Saturation percentage |
|---|---|---|---|
| A | 6544 | 1372 | 20.965770% |
| B | 6544 | 25 | 0.382029% |
| C | 6544 | 2 | 0.030562% |
| D | 6544 | 245 | 3.743888% |
Noise dominated data is calculated using 1-second bins in cleaned event files. If a bin has >2000 counts, and if more than 50% of those come from <1% of pixels, then it is considered to be noise-dominated and hence unusable.
| Quadrant | # 1 sec bins | Bins with >0 counts | Bins with >2000 counts | High rate bins dominated by noise | Noise dominated (total time) | Noise dominated (detector-on time) | Marked lightcurve |
|---|---|---|---|---|---|---|---|
| A | 7819 | 6544 | 3091 | 3091 | 39.53% | 47.23% | 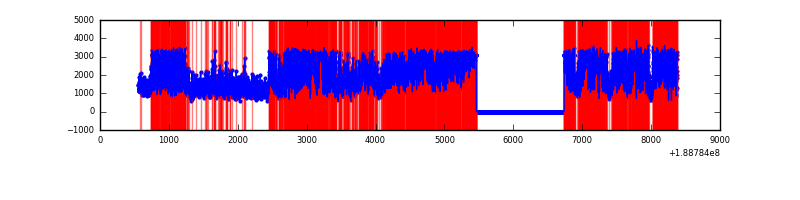 |
| B | 7819 | 6545 | 350 | 350 | 4.48% | 5.35% | 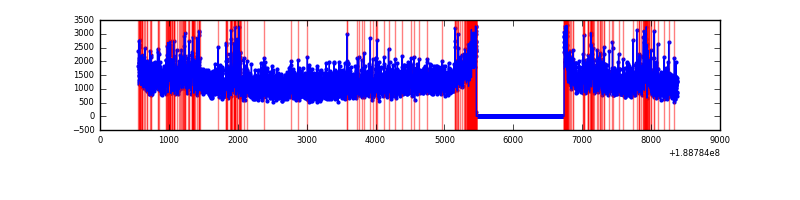 |
| C | 7819 | 6545 | 174 | 174 | 2.23% | 2.66% | 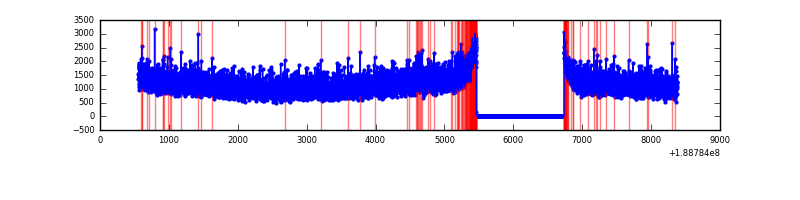 |
| D | 7819 | 6545 | 516 | 516 | 6.60% | 7.88% | 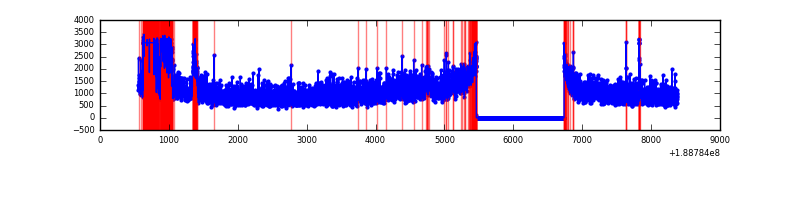 |
Top three noisy pixels from each quadrant. If the there are fewer than three noisy pixels in the level2.evt file, extra rows are filled as -1
| Pixel properties | Quadrant properties | ||||||
|---|---|---|---|---|---|---|---|
| Quadrant | DetID | PixID | Counts | Sigma | Mean | Median | Sigma |
| A | 4 | 32 | 6237980 | 14227.49 | 1842 | 1859 | 438.3 |
| A | 12 | 243 | 9054 | 16.42 | 1842 | 1859 | 438.3 |
| A | 14 | 234 | 8482 | 15.11 | 1842 | 1859 | 438.3 |
| B | 0 | 182 | 244102 | 504.71 | 2058 | 2069 | 479.6 |
| B | 8 | 4 | 214696 | 443.39 | 2058 | 2069 | 479.6 |
| B | 6 | 53 | 92449 | 188.47 | 2058 | 2069 | 479.6 |
| C | 15 | 241 | 326814 | 634.91 | 1850 | 1910 | 511.7 |
| C | 3 | 111 | 20175 | 35.69 | 1850 | 1910 | 511.7 |
| C | 3 | 79 | 15800 | 27.14 | 1850 | 1910 | 511.7 |
| D | 10 | 84 | 710022 | 1335.31 | 1722 | 1787 | 530.4 |
| D | 1 | 83 | 285808 | 535.49 | 1722 | 1787 | 530.4 |
| D | 9 | 66 | 39343 | 70.81 | 1722 | 1787 | 530.4 |
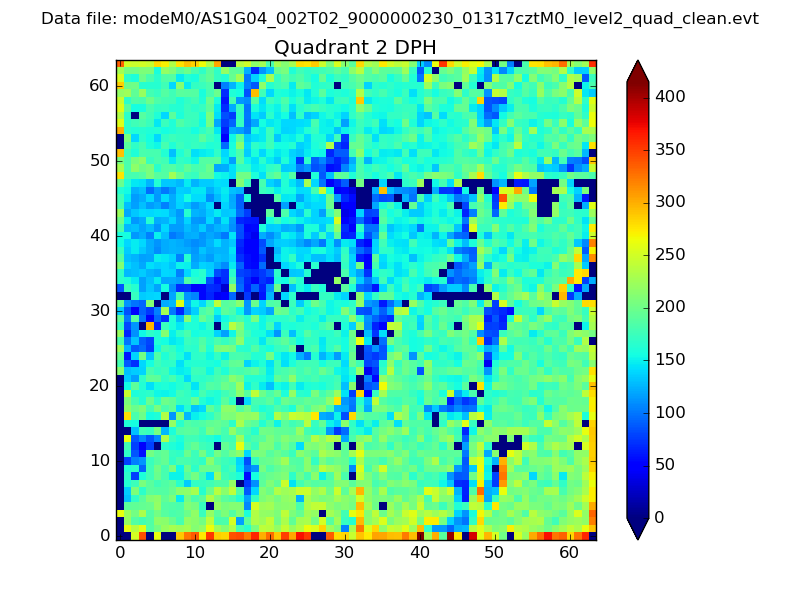
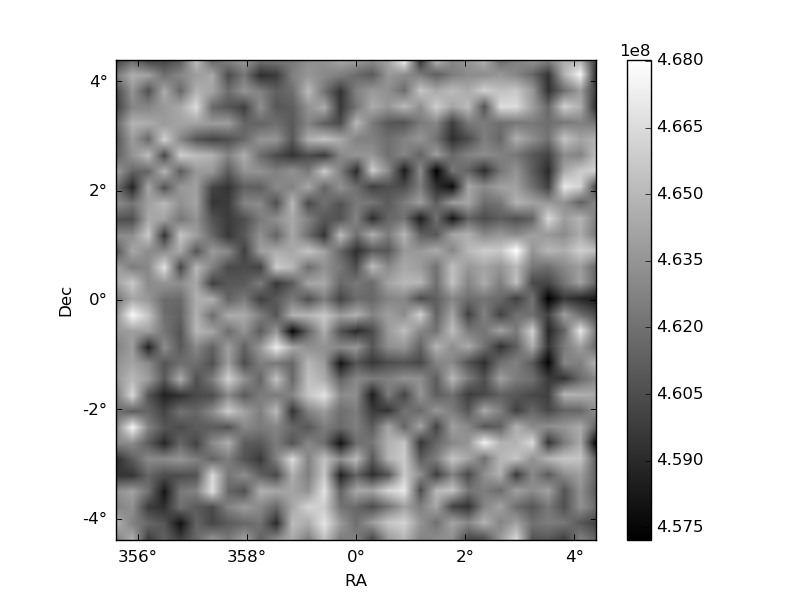
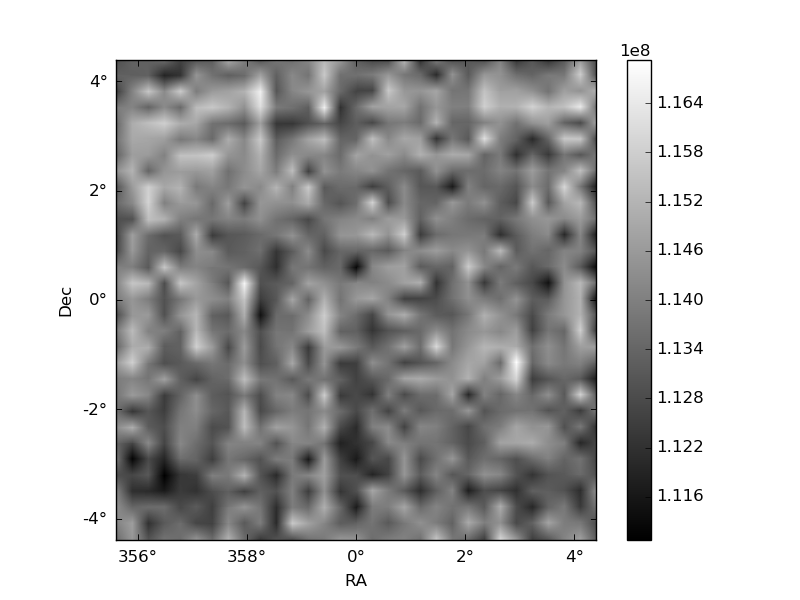
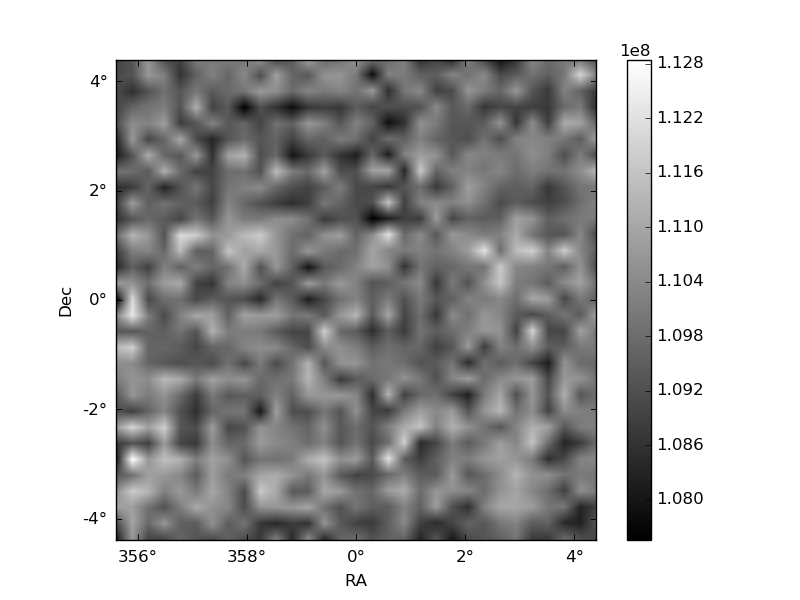
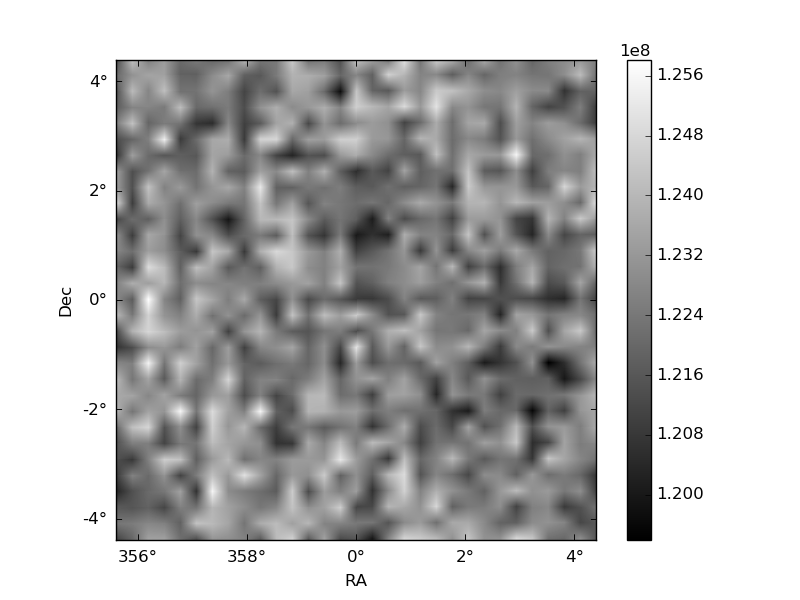
Histogram calculated using DETX and DETY for each event in the final _common_clean file
| Quadrant A | 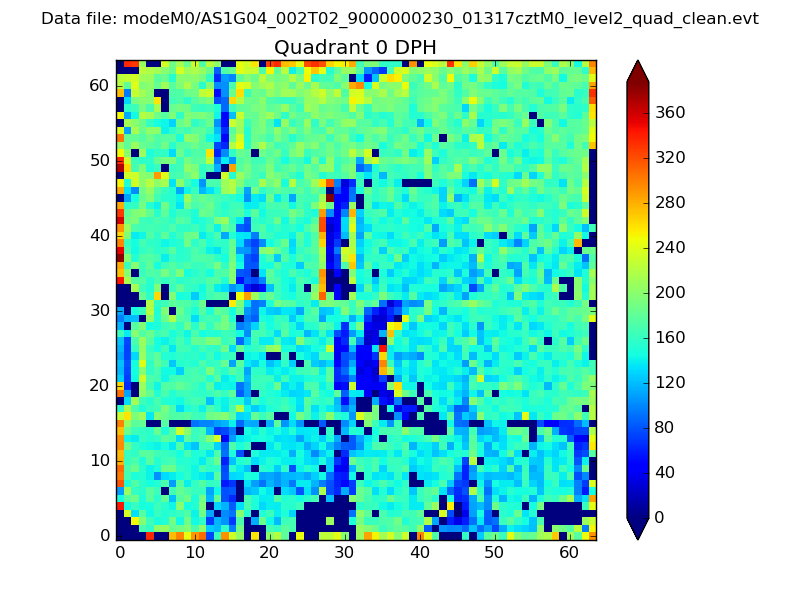 |
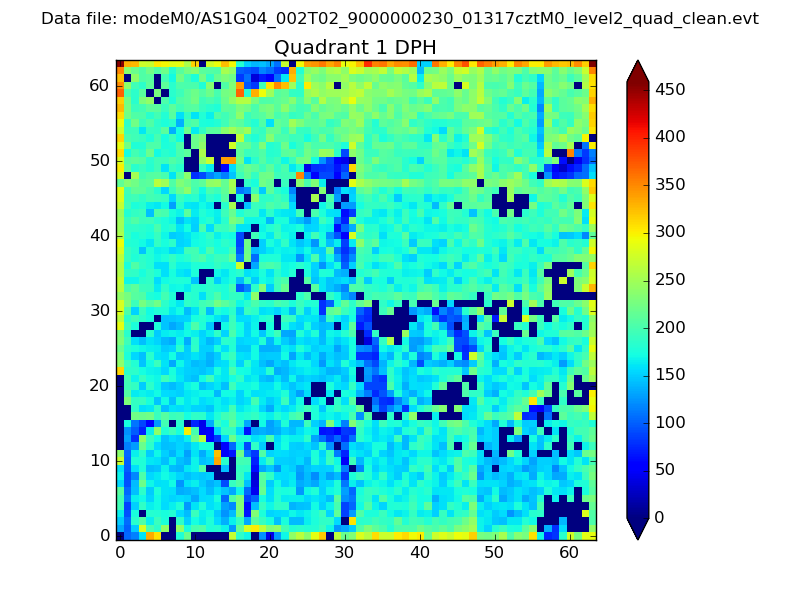 |
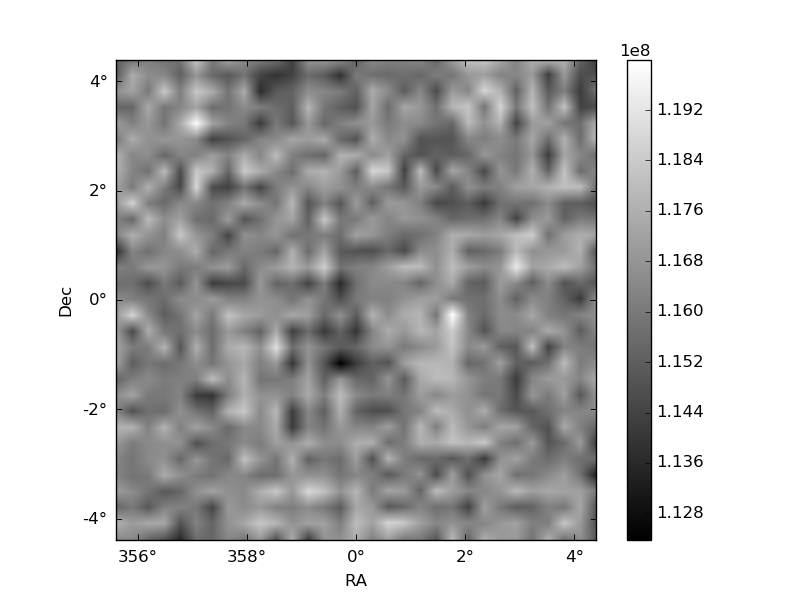
Quadrant B |
|---|---|---|---|
| Quadrant D | 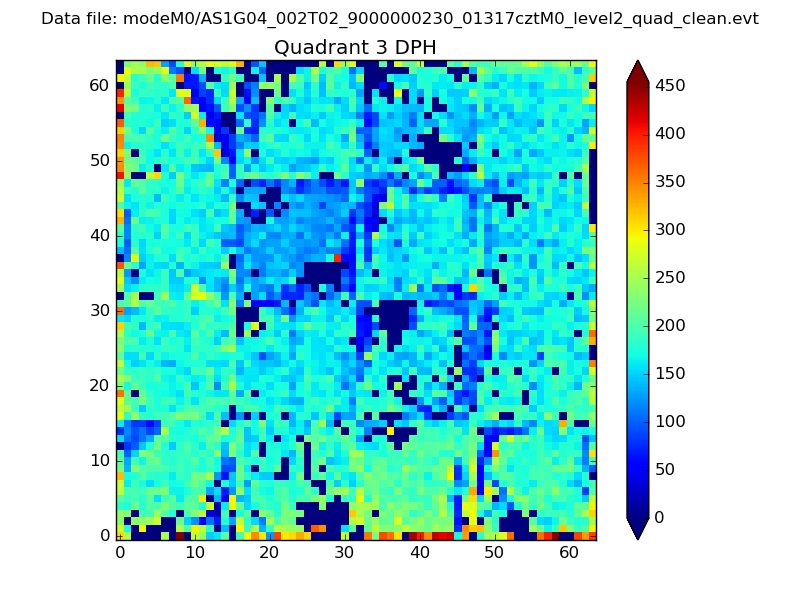 |
 |
Quadrant C |
| Plot type | Count rate plots | Images |
|---|---|---|
| Comparison with Poisson distribution Blue bars denote a histogram of data divided into 1 sec bins. Red curve is a Poisson curve with rate = median count rate of data. |
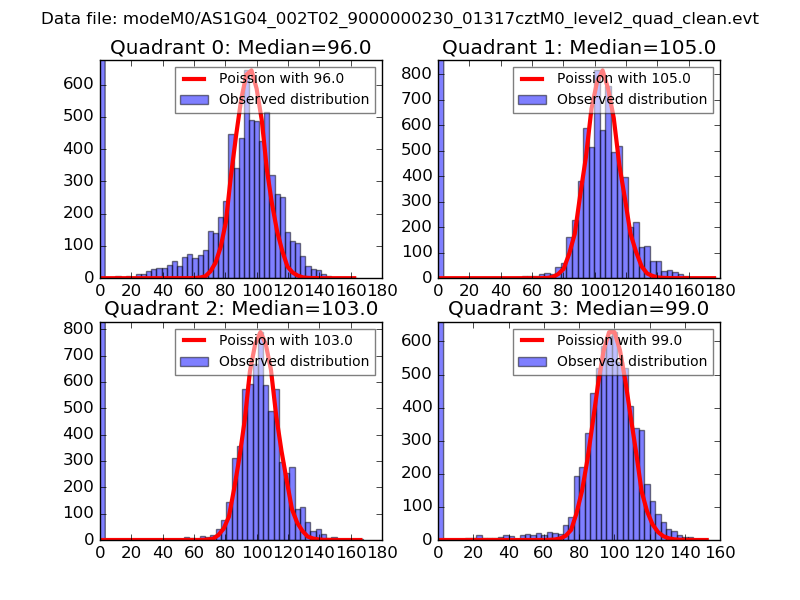 |
 |
| Quadrant-wise count rates Data is divided into 100 sec bins |
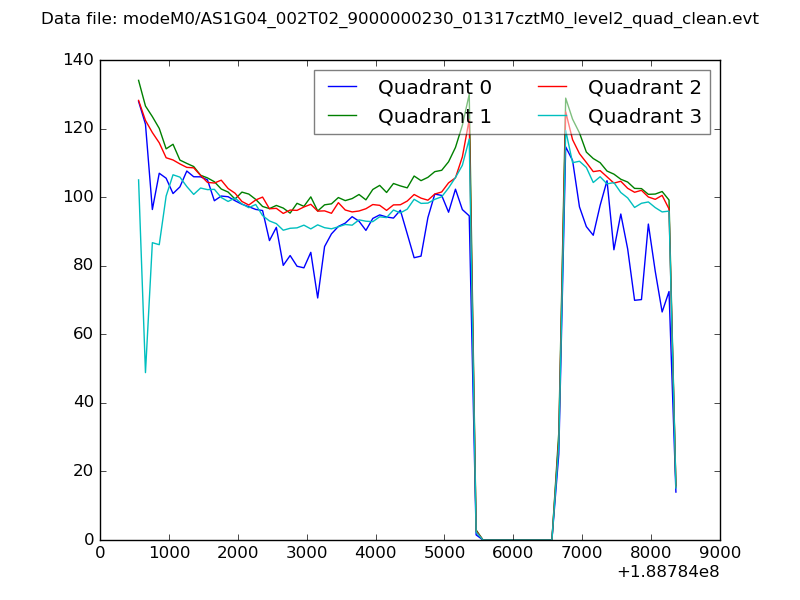 |
|
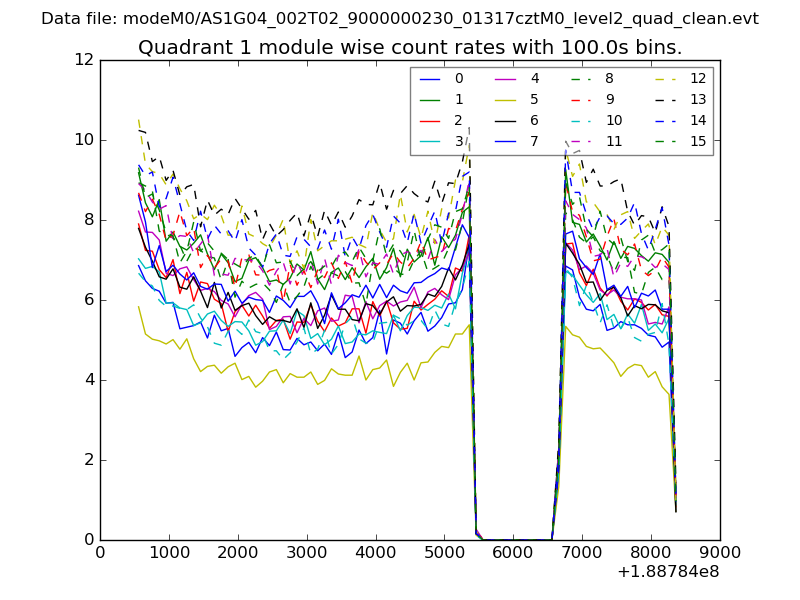
| Module-wise count rates for Quadrant A Data is divided into 100 sec bins |
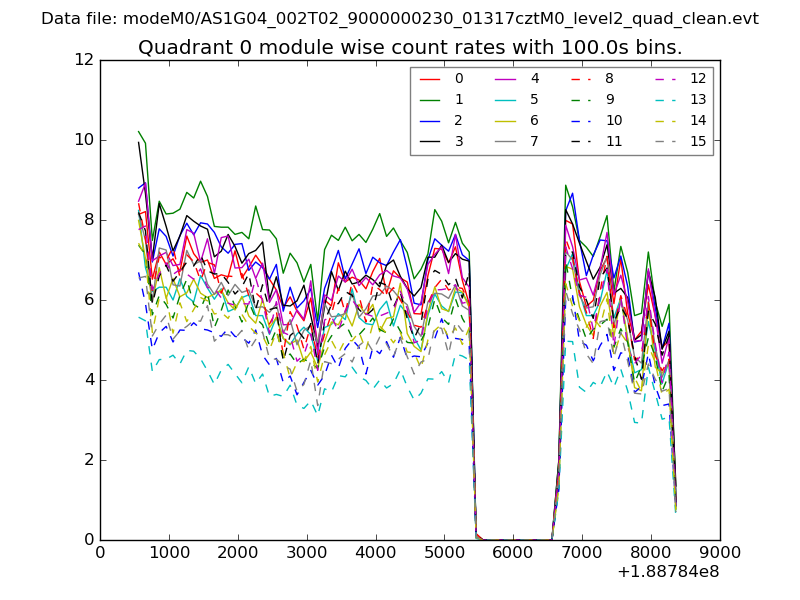 |
 |
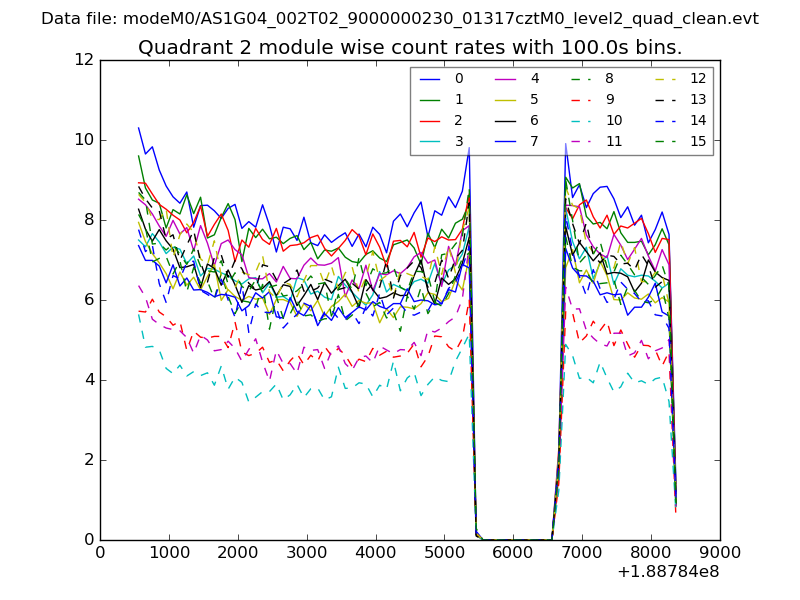
| Module-wise count rates for Quadrant B Data is divided into 100 sec bins |
 |
 |
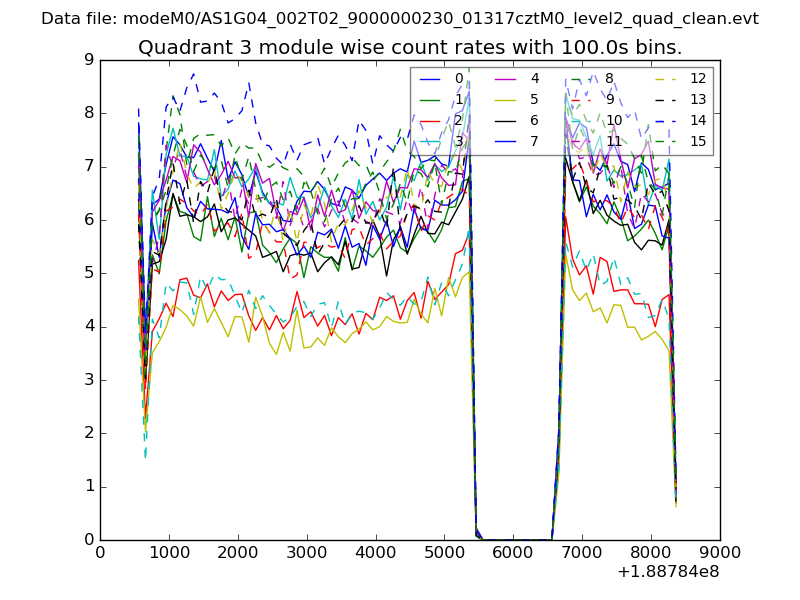
| Module-wise count rates for Quadrant C Data is divided into 100 sec bins |
 |
 |
| Module-wise count rates for Quadrant D Data is divided into 100 sec bins |
 |
 |
| Parameter | Plot |
|---|---|
| CZT HV Monitor | 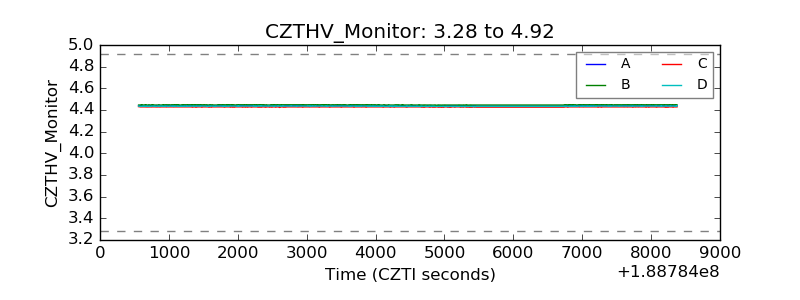 |
| D_VDD | 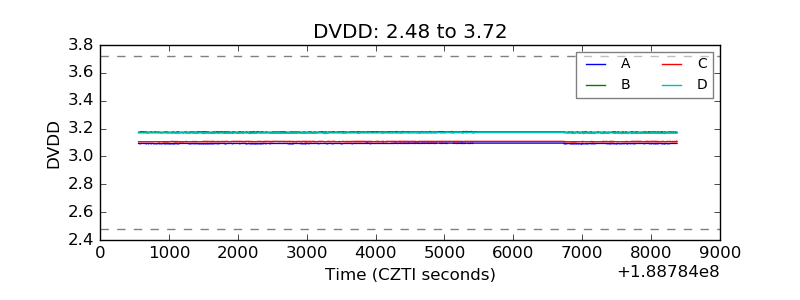 |
| Temperature 1 | 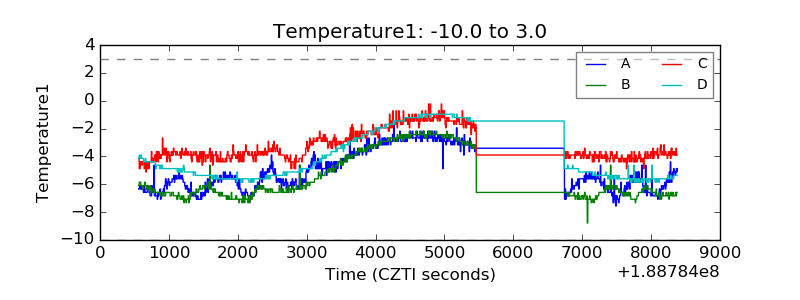 |
| Veto HV Monitor | 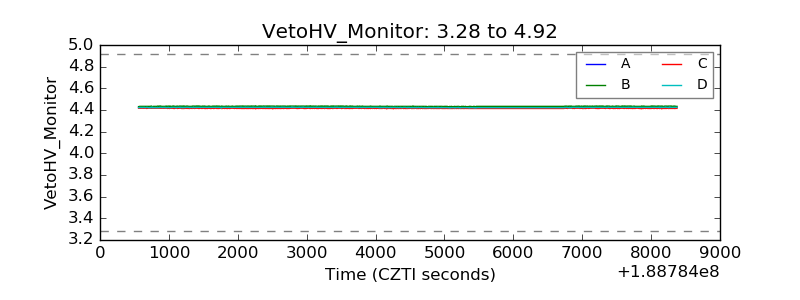 |
| Veto LLD | 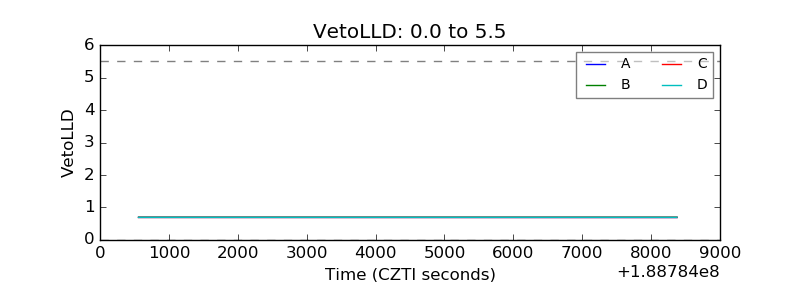 |
| Alpha Counter | 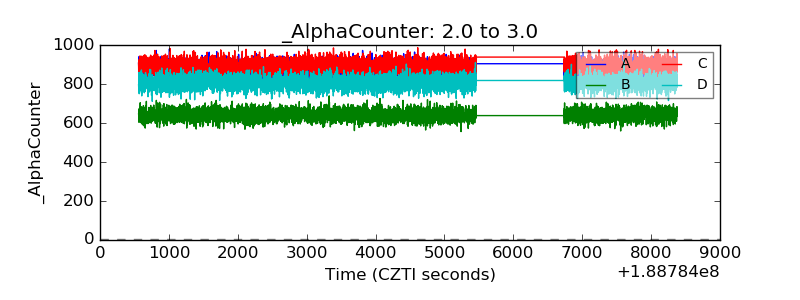 |
| _CPM_Rate | 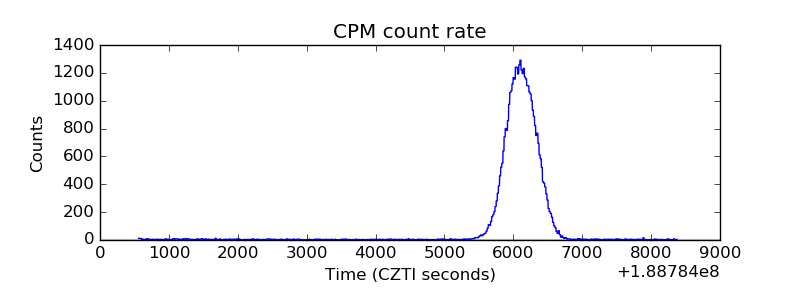 |
| CZT Counter | 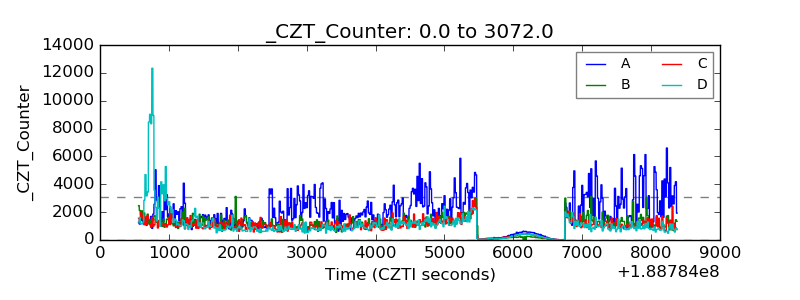 |
| +2.5 Volts monitor |  |
| +5 Volts monitor |  |
| _ROLL_ROT | 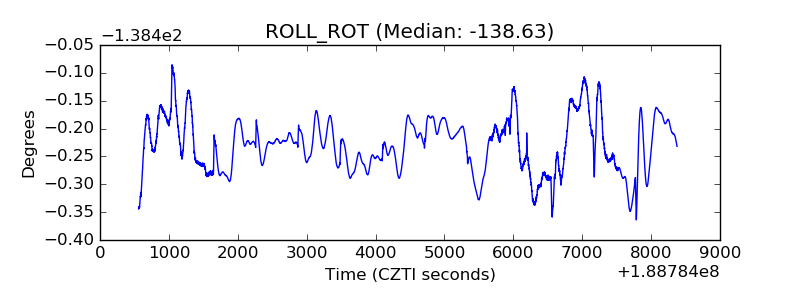 |
| _Roll_DEC | 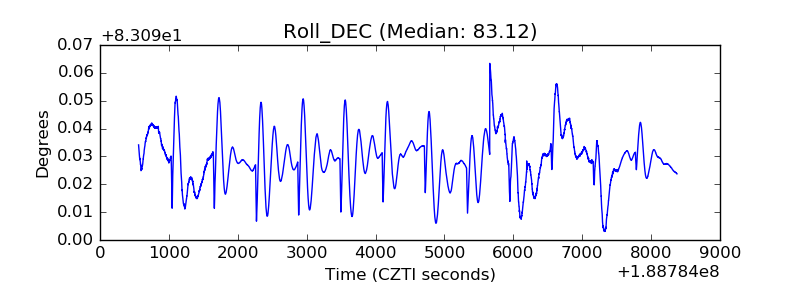 |
| _Roll_RA | 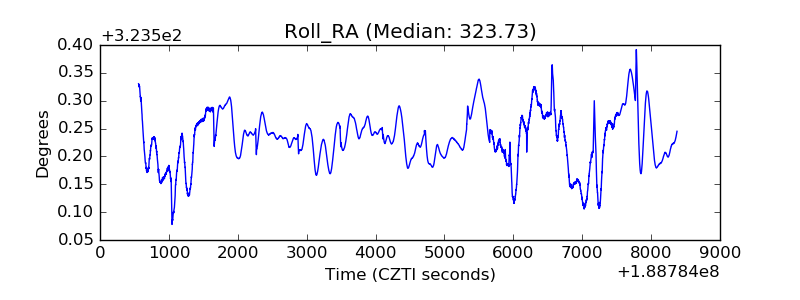 |
| Veto Counter | 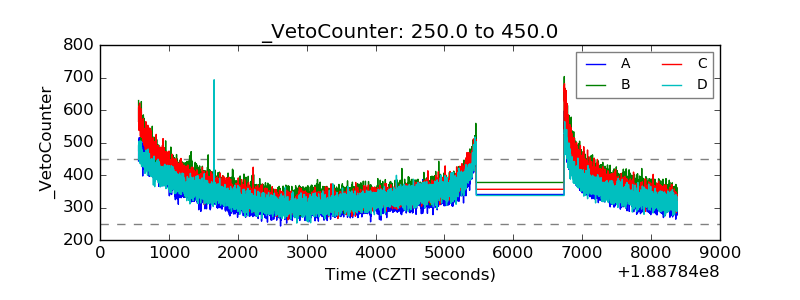 |