| Param | Original file | Final file |
|---|---|---|
| Filename | modeM0/AS1G04_002T02_9000000230_01319cztM0_level2.evt | modeM0/AS1G04_002T02_9000000230_01319cztM0_level2_quad_clean.evt |
| Size (bytes) | 1,118,174,400 | 99,685,440 |
| Size | 1.0 GB | 95.1 MB |
| Events in quadrant A | 9,801,349 | 631,580 |
| Events in quadrant B | 8,943,535 | 655,468 |
| Events in quadrant C | 7,753,818 | 640,742 |
| Events in quadrant D | 6,926,410 | 628,888 |
| Mode M9 | |||
|---|---|---|---|
| Quadrant | BADHDUFLAG | Total packets | Discarded packets |
| A | 0 | 9 | 0 |
| B | 0 | 9 | 0 |
| C | 0 | 9 | 0 |
| D | 0 | 9 | 0 |
| Mode M0 | |||
|---|---|---|---|
| Quadrant | BADHDUFLAG | Total packets | Discarded packets |
| A | 0 | 33864 | 3 |
| B | 0 | 31238 | 2 |
| C | 0 | 27755 | 2 |
| D | 0 | 25322 | 2 |
| Mode SS | |||
|---|---|---|---|
| Quadrant | BADHDUFLAG | Total packets | Discarded packets |
| A | 0 | 134 | 0 |
| B | 0 | 134 | 0 |
| C | 0 | 134 | 0 |
| D | 0 | 134 | 0 |
| Quadrant | Total seconds | Saturated seconds | Saturation percentage |
|---|---|---|---|
| A | 6624 | 395 | 5.963164% |
| B | 6624 | 68 | 1.026570% |
| C | 6624 | 26 | 0.392512% |
| D | 6624 | 23 | 0.347222% |
Noise dominated data is calculated using 1-second bins in cleaned event files. If a bin has >2000 counts, and if more than 50% of those come from <1% of pixels, then it is considered to be noise-dominated and hence unusable.
| Quadrant | # 1 sec bins | Bins with >0 counts | Bins with >2000 counts | High rate bins dominated by noise | Noise dominated (total time) | Noise dominated (detector-on time) | Marked lightcurve |
|---|---|---|---|---|---|---|---|
| A | 7574 | 6625 | 1191 | 1191 | 15.72% | 17.98% | 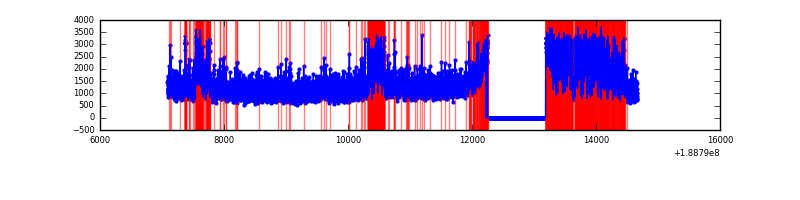 |
| B | 7574 | 6625 | 602 | 602 | 7.95% | 9.09% | 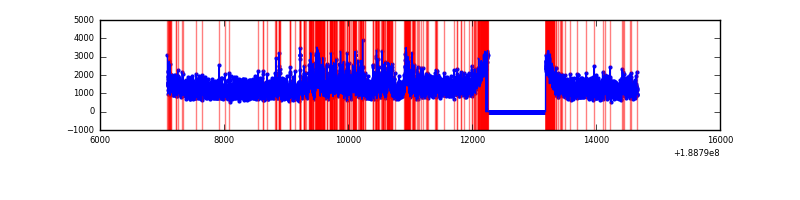 |
| C | 7574 | 6626 | 197 | 197 | 2.60% | 2.97% | 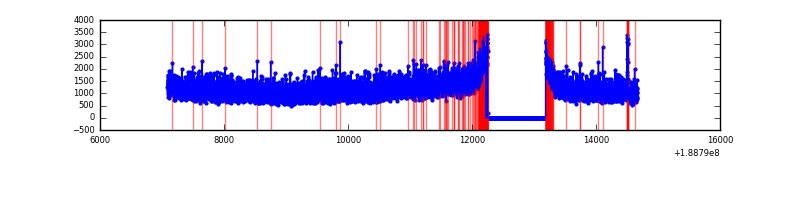 |
| D | 7574 | 6626 | 163 | 163 | 2.15% | 2.46% | 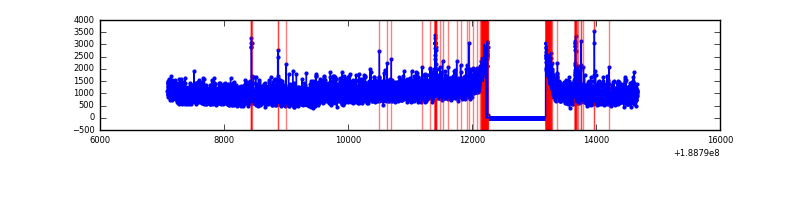 |
Top three noisy pixels from each quadrant. If the there are fewer than three noisy pixels in the level2.evt file, extra rows are filled as -1
| Pixel properties | Quadrant properties | ||||||
|---|---|---|---|---|---|---|---|
| Quadrant | DetID | PixID | Counts | Sigma | Mean | Median | Sigma |
| A | 4 | 32 | 1935320 | 4071.07 | 1971 | 1980 | 474.9 |
| A | 0 | 128 | 254874 | 532.52 | 1971 | 1980 | 474.9 |
| A | 12 | 243 | 28777 | 56.43 | 1971 | 1980 | 474.9 |
| B | 8 | 4 | 797731 | 1621.46 | 2095 | 2104 | 490.7 |
| B | 6 | 53 | 96887 | 193.16 | 2095 | 2104 | 490.7 |
| B | 15 | 22 | 36785 | 70.68 | 2095 | 2104 | 490.7 |
| C | 15 | 241 | 336607 | 648.51 | 1865 | 1927 | 516.1 |
| C | 3 | 9 | 41535 | 76.75 | 1865 | 1927 | 516.1 |
| C | 9 | 54 | 26032 | 46.71 | 1865 | 1927 | 516.1 |
| D | 10 | 84 | 100405 | 178.31 | 1794 | 1853 | 552.7 |
| D | 15 | 13 | 38487 | 66.28 | 1794 | 1853 | 552.7 |
| D | 1 | 83 | 22450 | 37.26 | 1794 | 1853 | 552.7 |
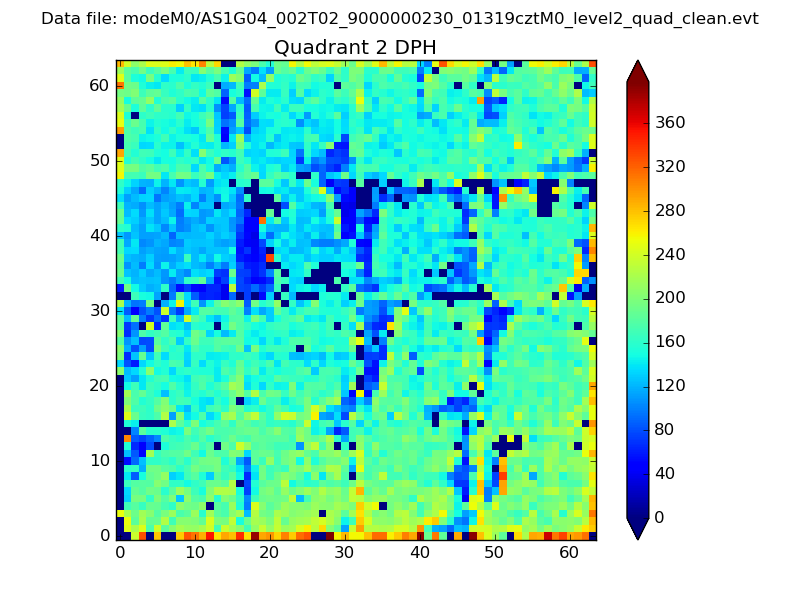
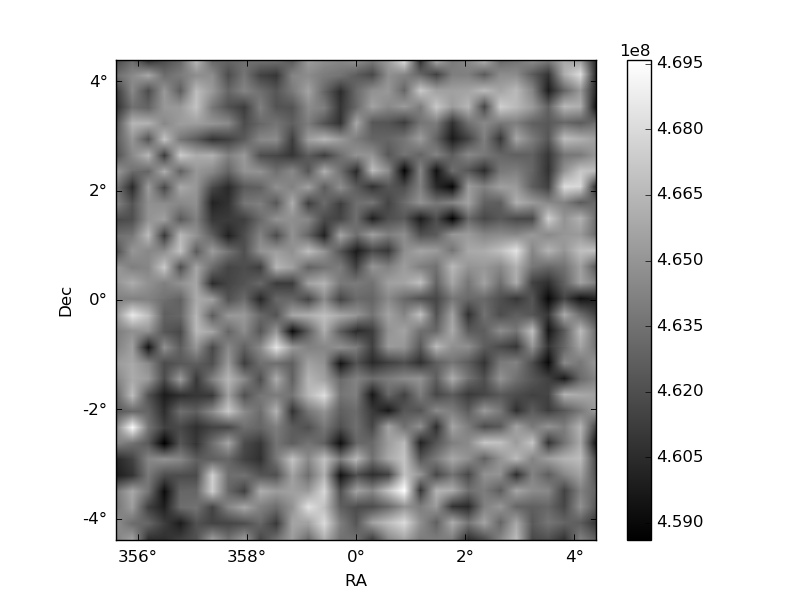
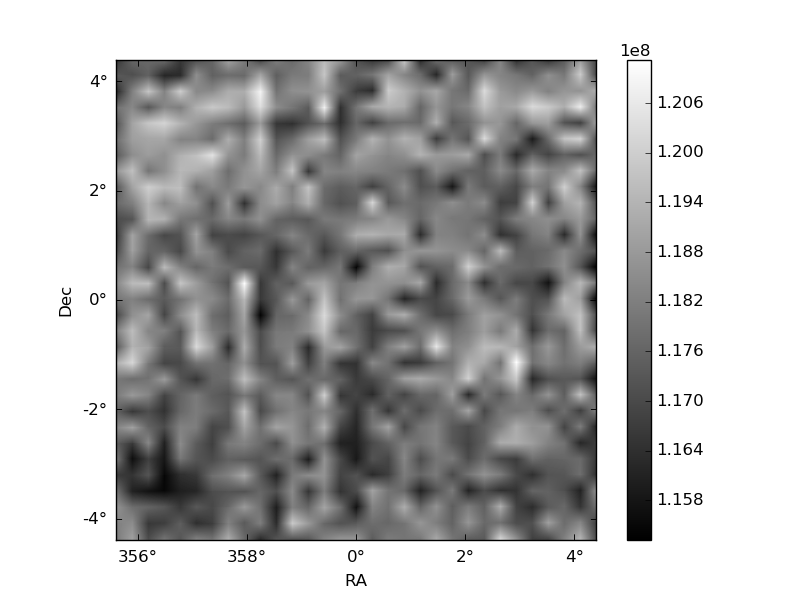
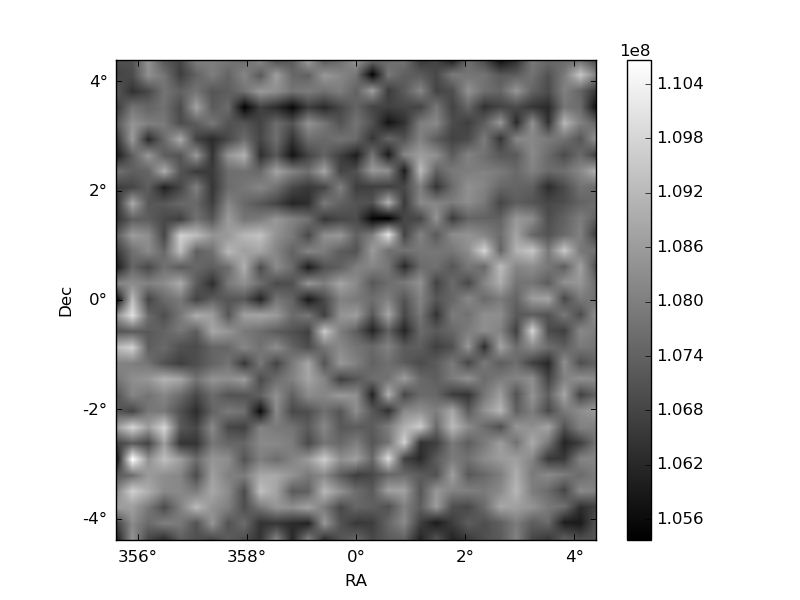
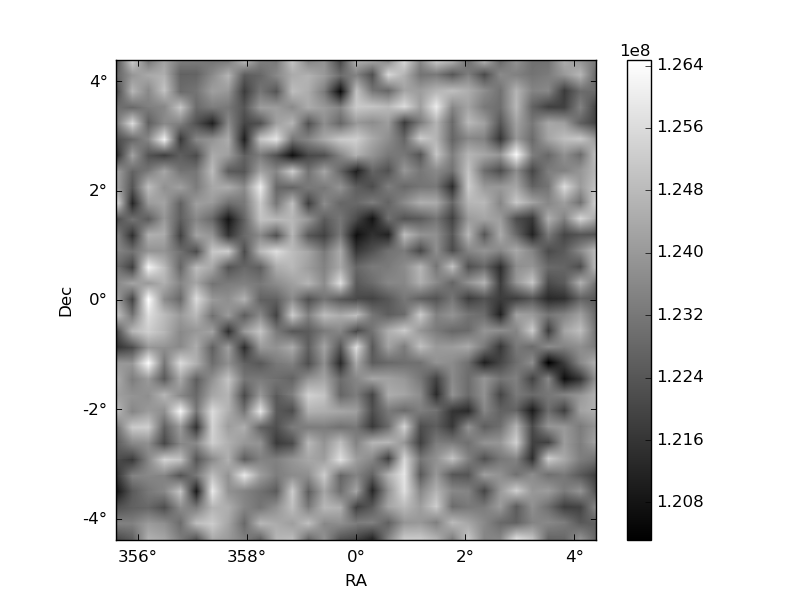
Histogram calculated using DETX and DETY for each event in the final _common_clean file
| Quadrant A | 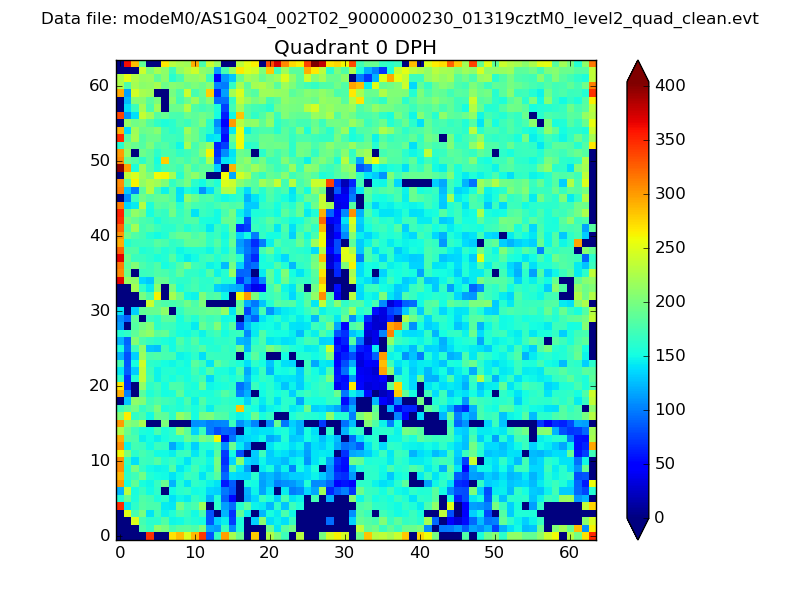 |
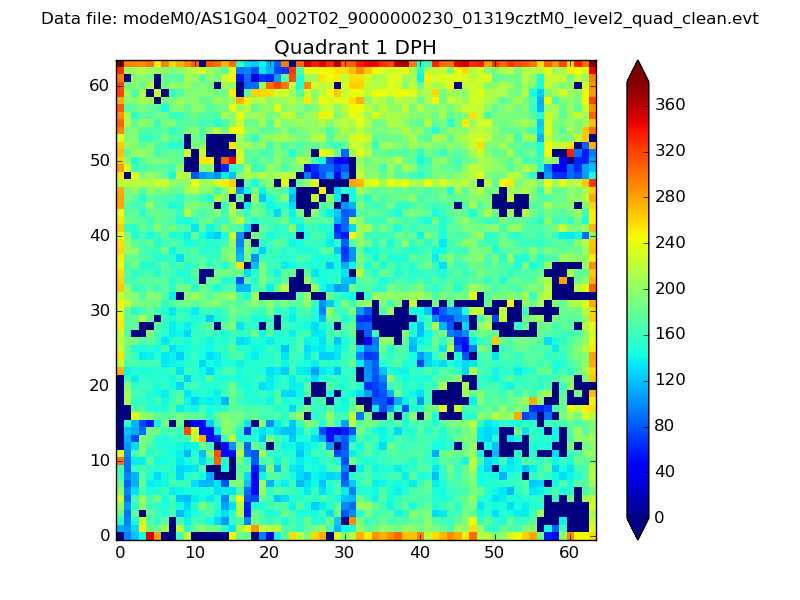 |
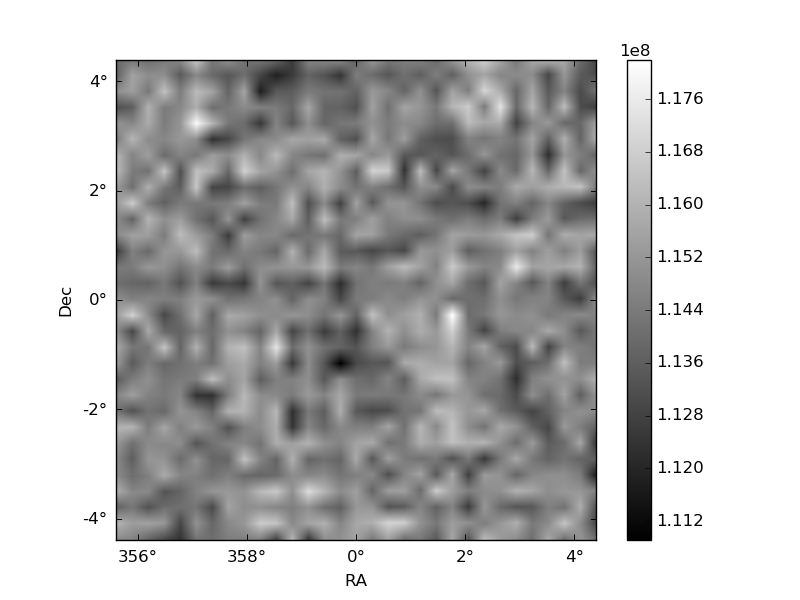
Quadrant B |
|---|---|---|---|
| Quadrant D | 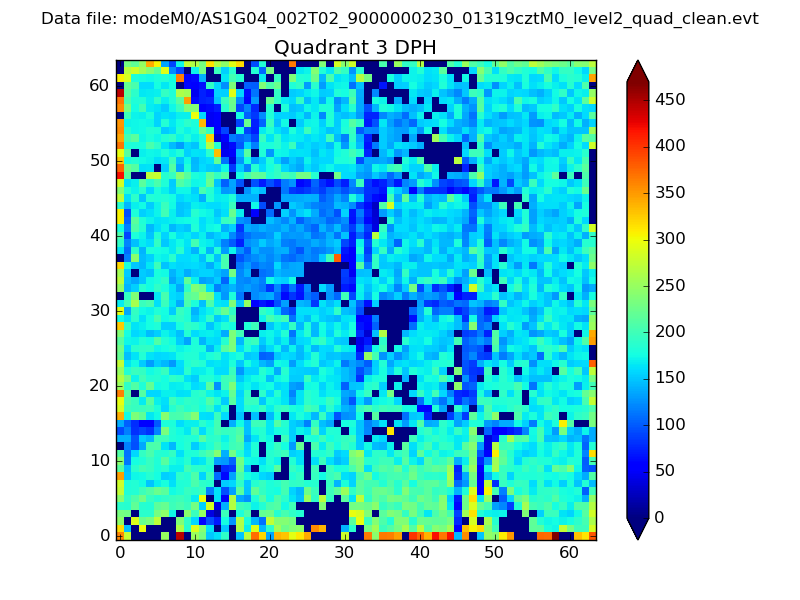 |
 |
Quadrant C |
| Plot type | Count rate plots | Images |
|---|---|---|
| Comparison with Poisson distribution Blue bars denote a histogram of data divided into 1 sec bins. Red curve is a Poisson curve with rate = median count rate of data. |
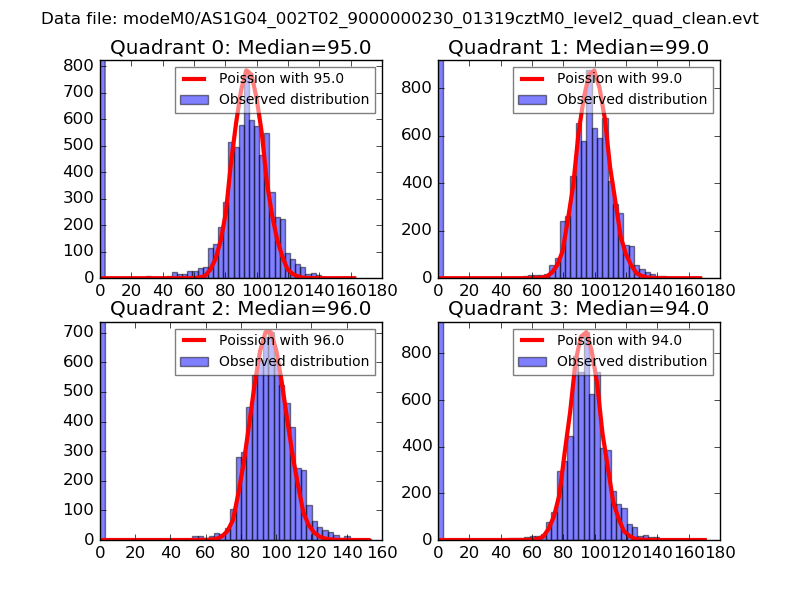 |
 |
| Quadrant-wise count rates Data is divided into 100 sec bins |
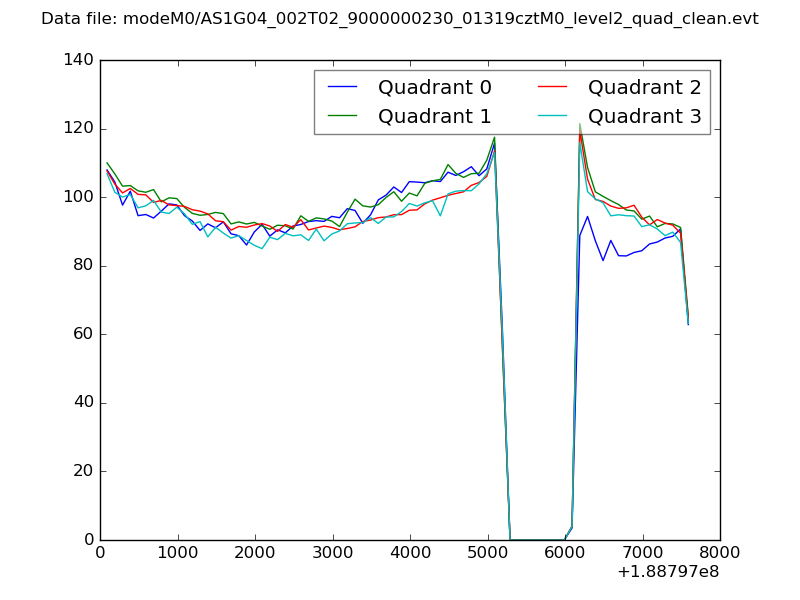 |
|
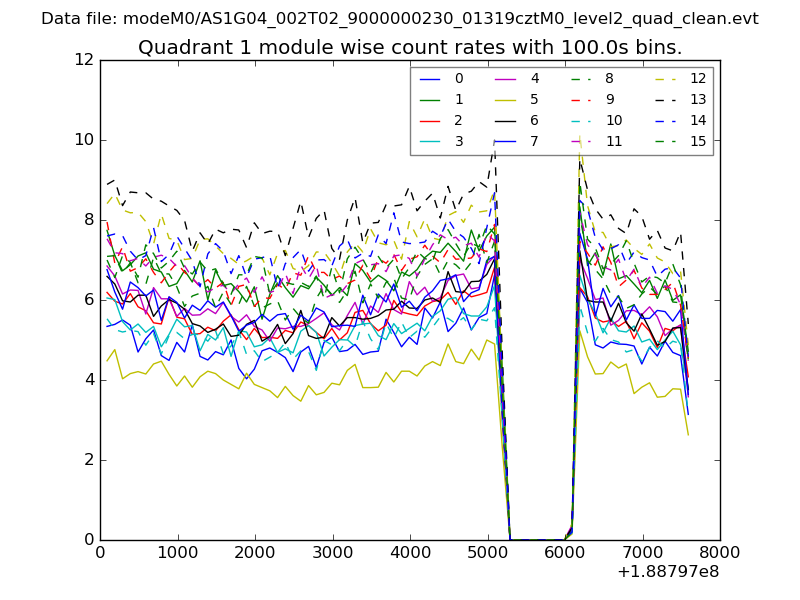
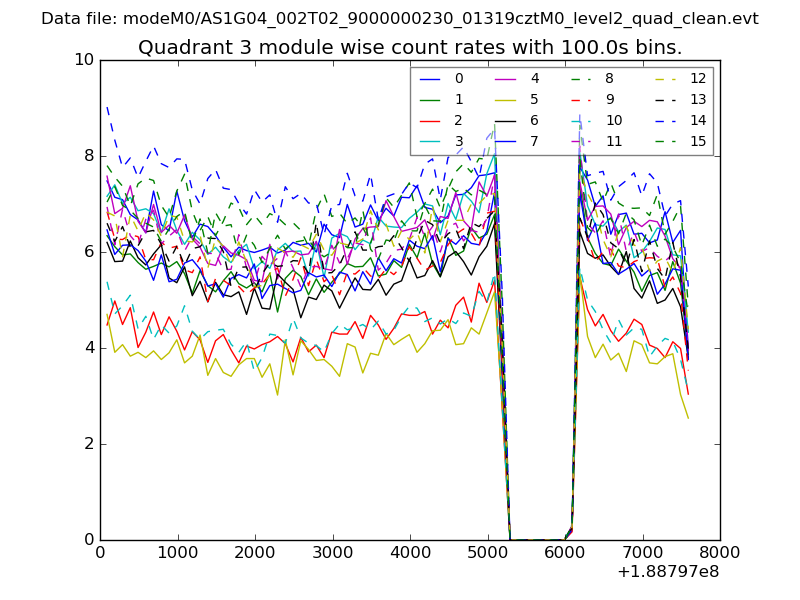
| Module-wise count rates for Quadrant A Data is divided into 100 sec bins |
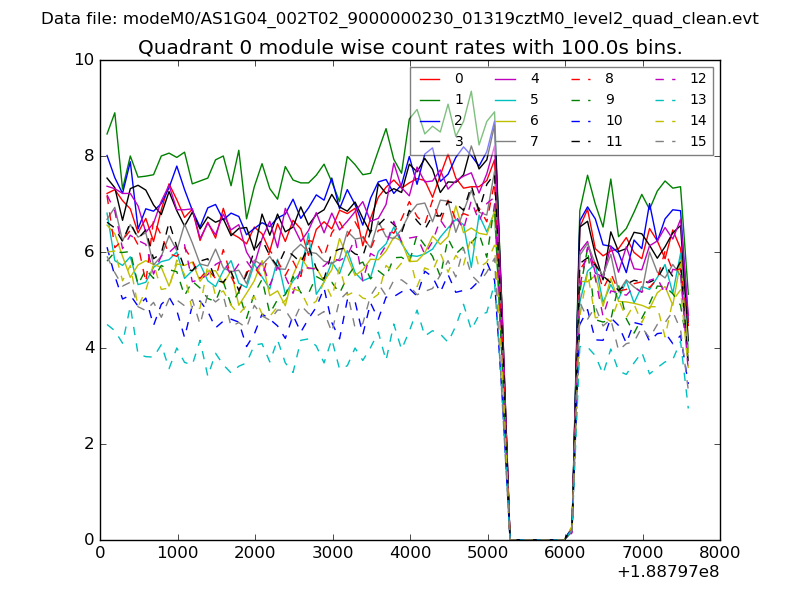 |
 |
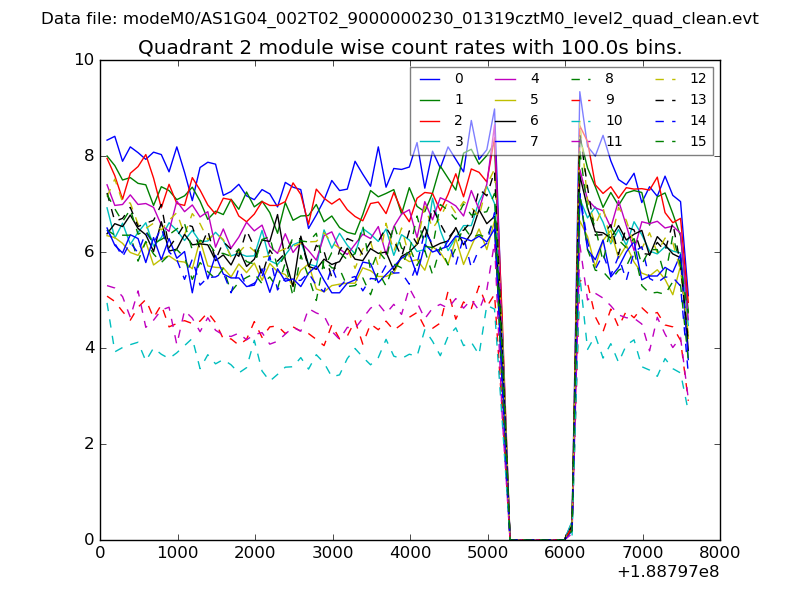
| Module-wise count rates for Quadrant B Data is divided into 100 sec bins |
 |
 |
| Module-wise count rates for Quadrant C Data is divided into 100 sec bins |
 |
 |
| Module-wise count rates for Quadrant D Data is divided into 100 sec bins |
 |
 |
| Parameter | Plot |
|---|---|
| CZT HV Monitor |  |
| D_VDD | 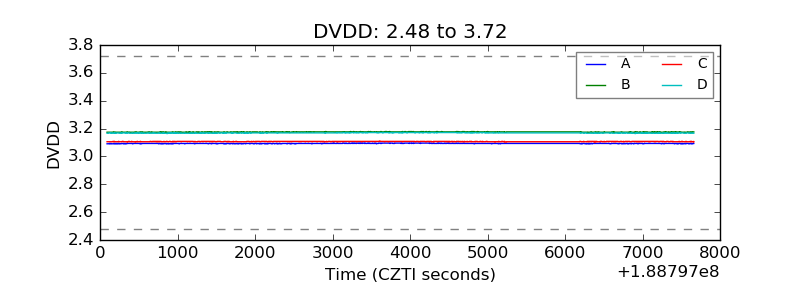 |
| Temperature 1 | 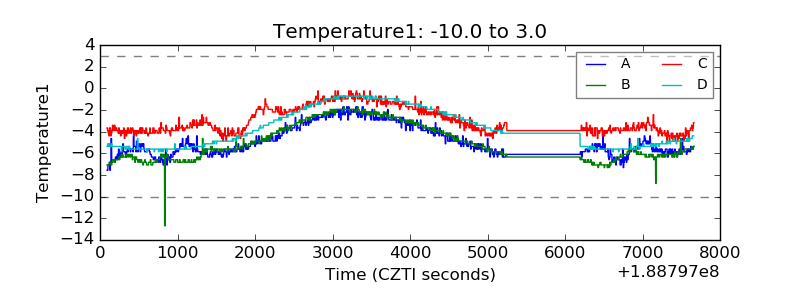 |
| Veto HV Monitor | 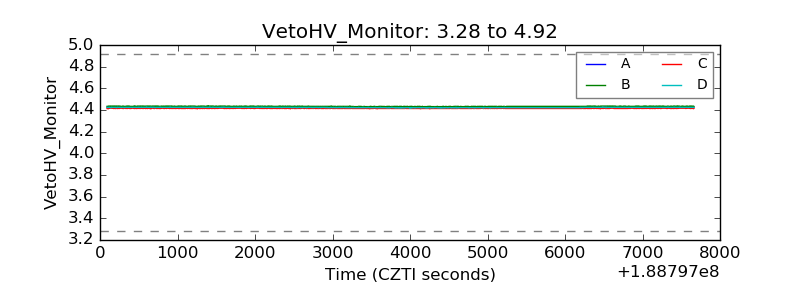 |
| Veto LLD | 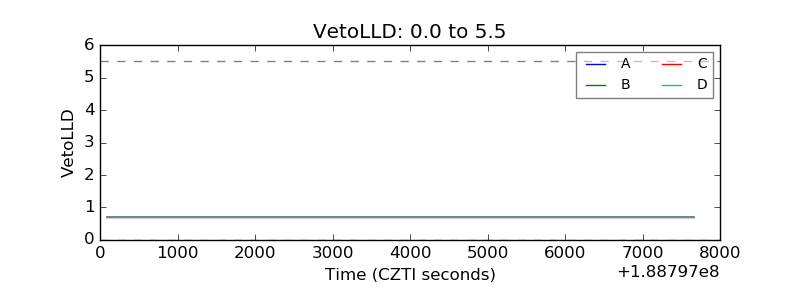 |
| Alpha Counter | 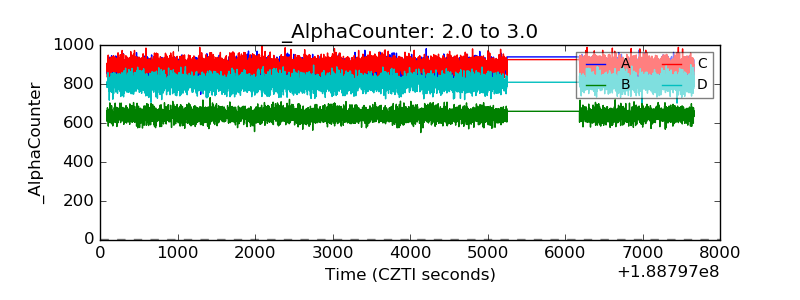 |
| _CPM_Rate | 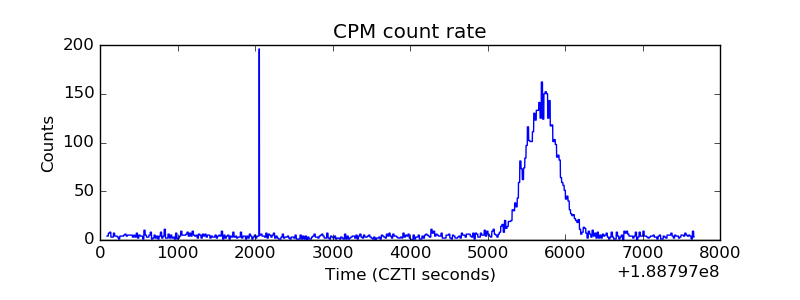 |
| CZT Counter | 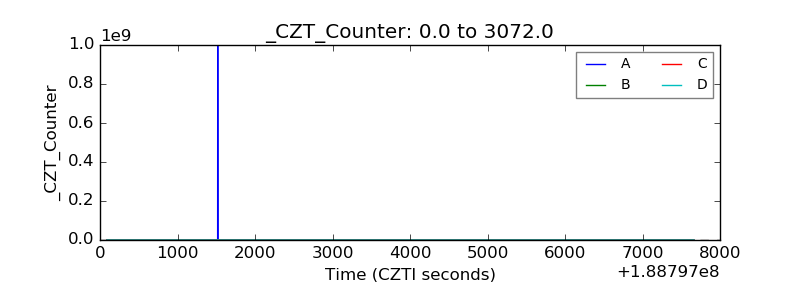 |
| +2.5 Volts monitor |  |
| +5 Volts monitor | 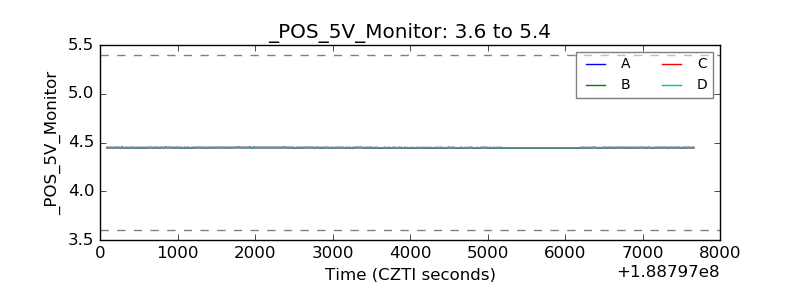 |
| _ROLL_ROT | 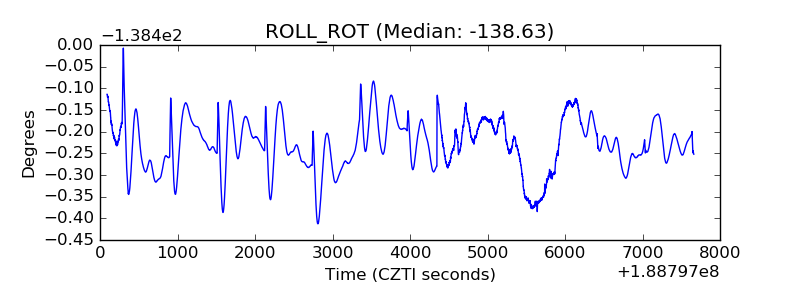 |
| _Roll_DEC | 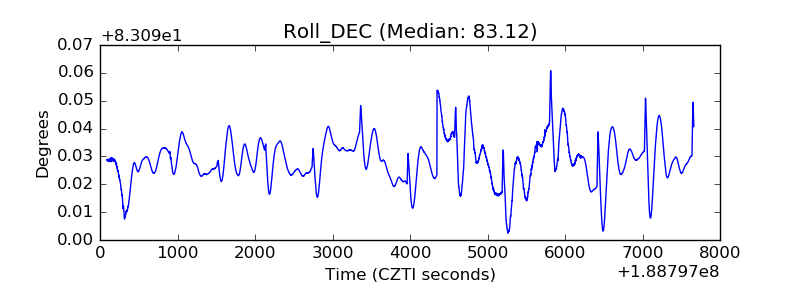 |
| _Roll_RA | 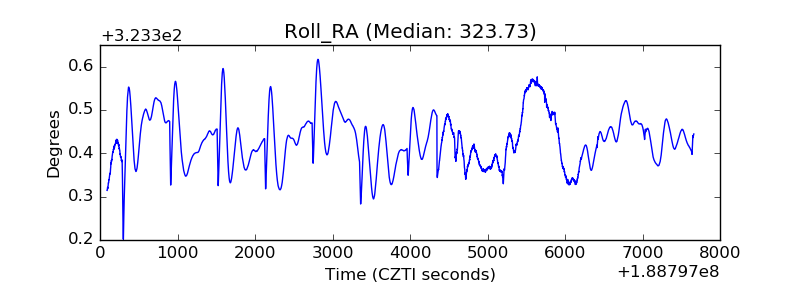 |
| Veto Counter | 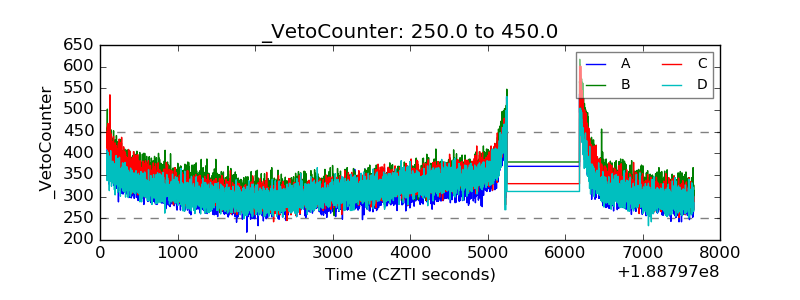 |