| Param | Original file | Final file |
|---|---|---|
| Filename | modeM0/AS1G04_002T02_9000000230_01320cztM0_level2.evt | modeM0/AS1G04_002T02_9000000230_01320cztM0_level2_quad_clean.evt |
| Size (bytes) | 777,692,160 | 62,694,720 |
| Size | 741.7 MB | 59.8 MB |
| Events in quadrant A | 7,669,450 | 389,949 |
| Events in quadrant B | 5,723,515 | 412,433 |
| Events in quadrant C | 5,086,281 | 397,877 |
| Events in quadrant D | 4,785,467 | 392,711 |
| Mode M0 | |||
|---|---|---|---|
| Quadrant | BADHDUFLAG | Total packets | Discarded packets |
| A | 0 | 25865 | 0 |
| B | 0 | 20030 | 0 |
| C | 0 | 18198 | 0 |
| D | 0 | 17352 | 0 |
| Mode SS | |||
|---|---|---|---|
| Quadrant | BADHDUFLAG | Total packets | Discarded packets |
| A | 0 | 88 | 0 |
| B | 0 | 88 | 0 |
| C | 0 | 88 | 0 |
| D | 0 | 88 | 0 |
| Quadrant | Total seconds | Saturated seconds | Saturation percentage |
|---|---|---|---|
| A | 4332 | 418 | 9.649123% |
| B | 4332 | 50 | 1.154201% |
| C | 4332 | 51 | 1.177285% |
| D | 4332 | 60 | 1.385042% |
Noise dominated data is calculated using 1-second bins in cleaned event files. If a bin has >2000 counts, and if more than 50% of those come from <1% of pixels, then it is considered to be noise-dominated and hence unusable.
| Quadrant | # 1 sec bins | Bins with >0 counts | Bins with >2000 counts | High rate bins dominated by noise | Noise dominated (total time) | Noise dominated (detector-on time) | Marked lightcurve |
|---|---|---|---|---|---|---|---|
| A | 4332 | 4332 | 1429 | 1429 | 32.99% | 32.99% | 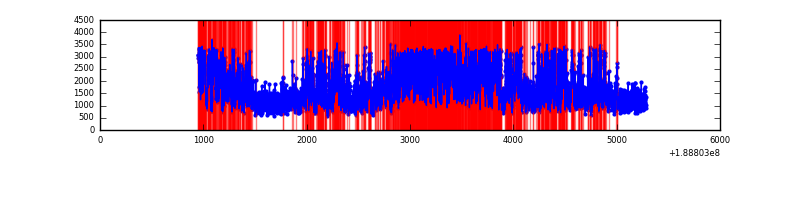 |
| B | 4332 | 4332 | 329 | 329 | 7.59% | 7.59% | 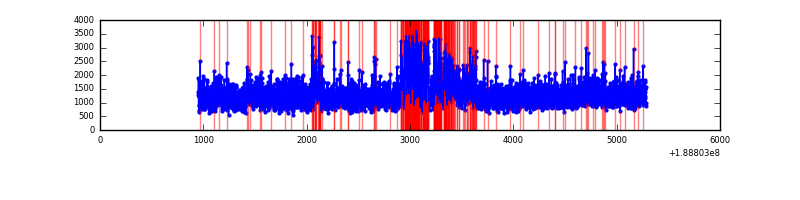 |
| C | 4332 | 4332 | 156 | 156 | 3.60% | 3.60% | 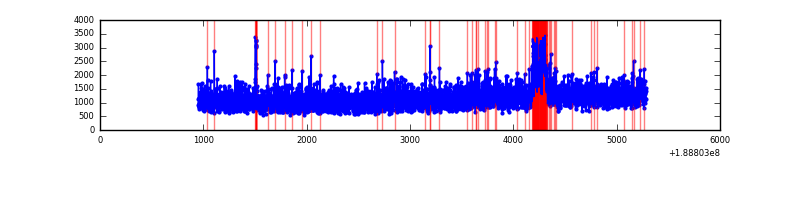 |
| D | 4332 | 4332 | 159 | 159 | 3.67% | 3.67% | 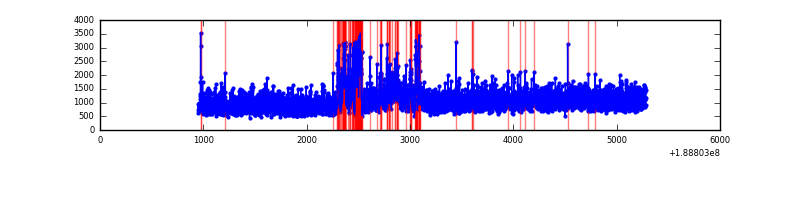 |
Top three noisy pixels from each quadrant. If the there are fewer than three noisy pixels in the level2.evt file, extra rows are filled as -1
| Pixel properties | Quadrant properties | ||||||
|---|---|---|---|---|---|---|---|
| Quadrant | DetID | PixID | Counts | Sigma | Mean | Median | Sigma |
| A | 4 | 32 | 2839335 | 9721.12 | 1219 | 1226 | 292.0 |
| A | 0 | 128 | 123623 | 419.24 | 1219 | 1226 | 292.0 |
| A | 13 | 169 | 9169 | 27.21 | 1219 | 1226 | 292.0 |
| B | 8 | 4 | 573465 | 1888.77 | 1284 | 1289 | 302.9 |
| B | 0 | 220 | 98354 | 320.41 | 1284 | 1289 | 302.9 |
| B | 12 | 52 | 76749 | 249.1 | 1284 | 1289 | 302.9 |
| C | 15 | 241 | 219913 | 683.13 | 1159 | 1197 | 320.2 |
| C | 9 | 52 | 218958 | 680.14 | 1159 | 1197 | 320.2 |
| C | 8 | 208 | 33751 | 101.68 | 1159 | 1197 | 320.2 |
| D | 10 | 84 | 421530 | 1196.2 | 1140 | 1177 | 351.4 |
| D | 1 | 83 | 54586 | 151.98 | 1140 | 1177 | 351.4 |
| D | 13 | 73 | 21247 | 57.11 | 1140 | 1177 | 351.4 |
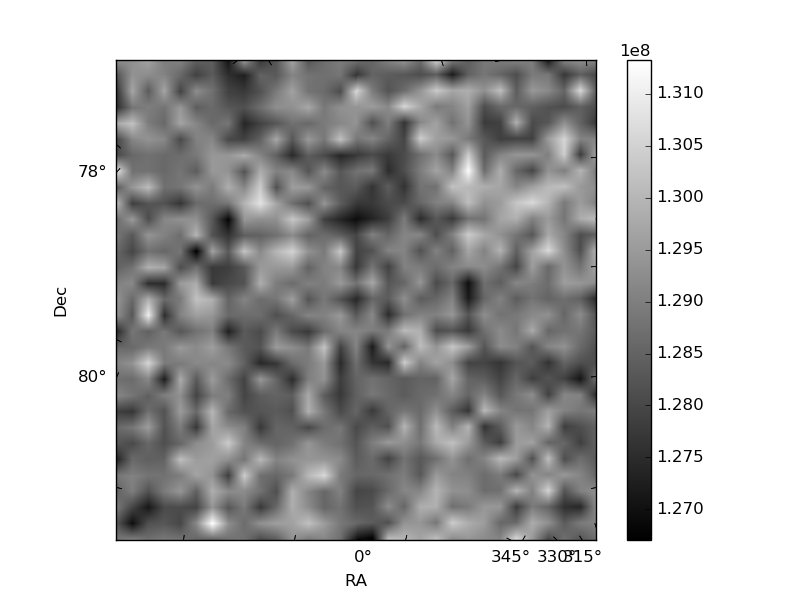
Histogram calculated using DETX and DETY for each event in the final _common_clean file
| Quadrant A | 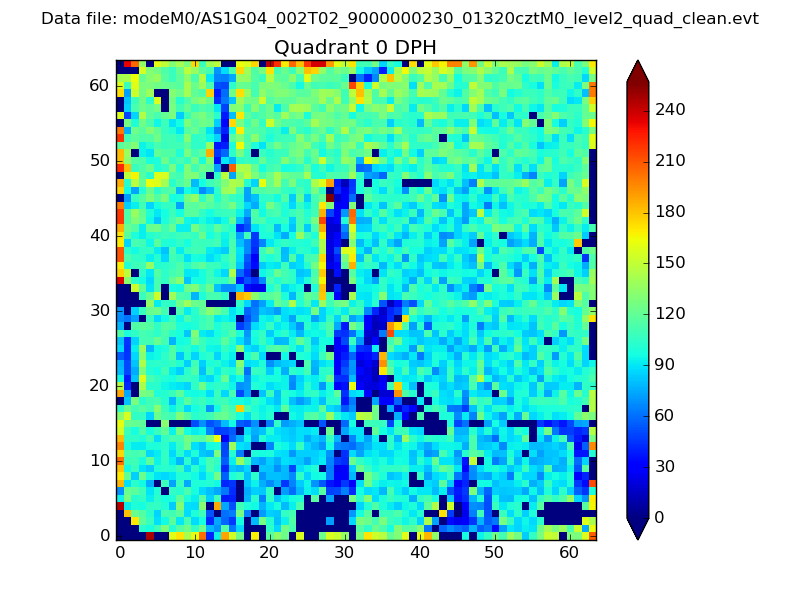 |
 |
Quadrant B |
|---|---|---|---|
| Quadrant D |  |
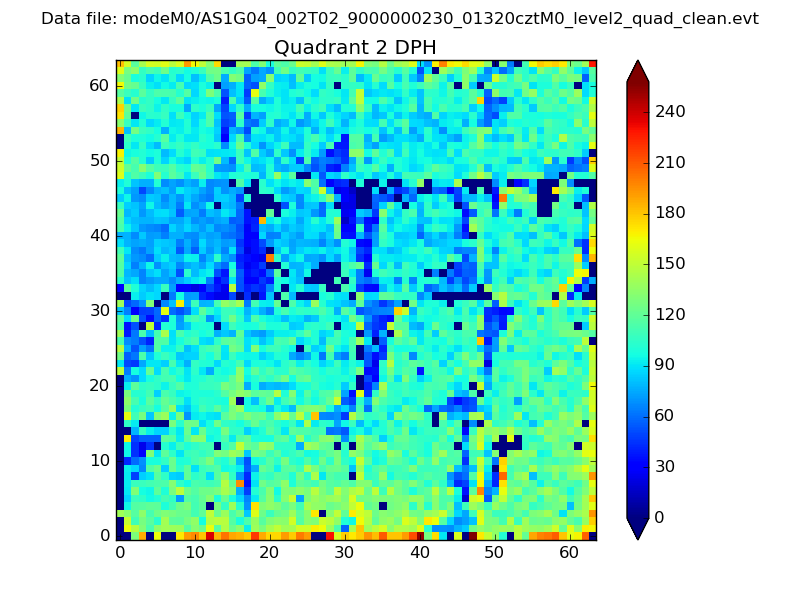 |
Quadrant C |
| Plot type | Count rate plots | Images |
|---|---|---|
| Comparison with Poisson distribution Blue bars denote a histogram of data divided into 1 sec bins. Red curve is a Poisson curve with rate = median count rate of data. |
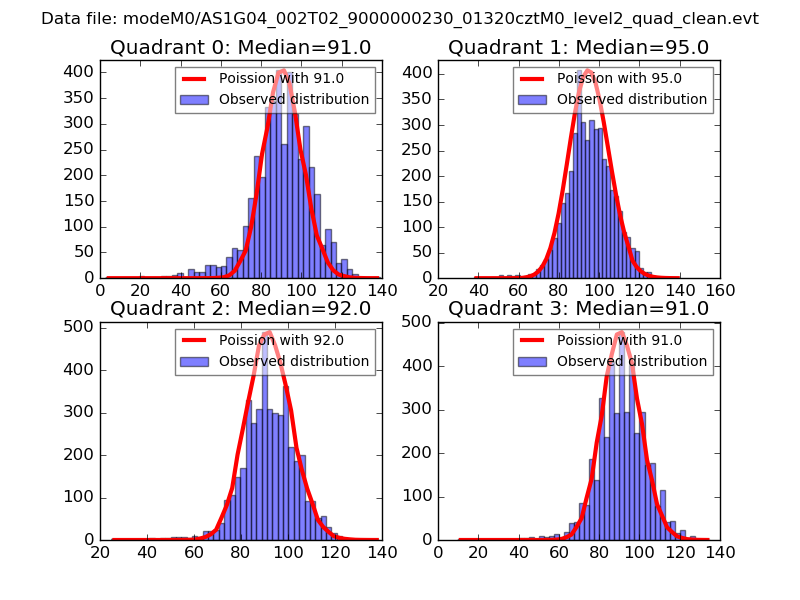 |
 |
| Quadrant-wise count rates Data is divided into 100 sec bins |
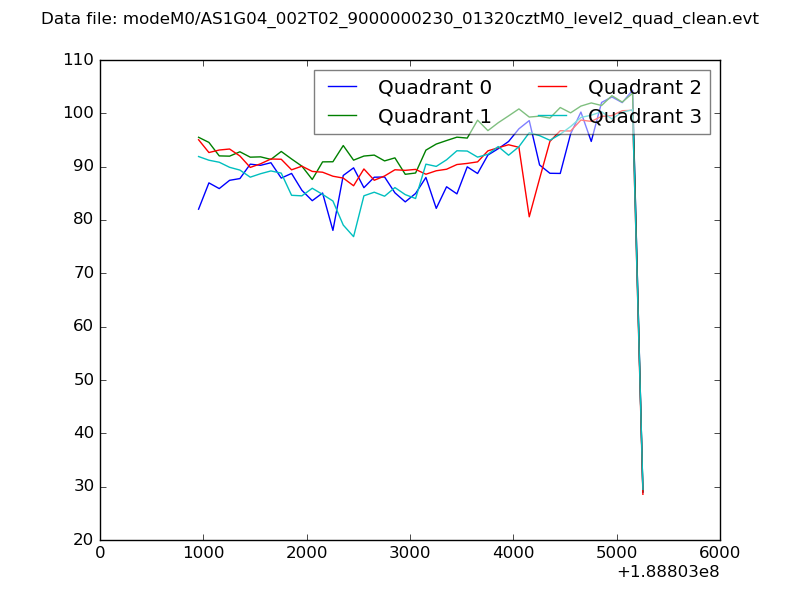 |
|
| Module-wise count rates for Quadrant A Data is divided into 100 sec bins |
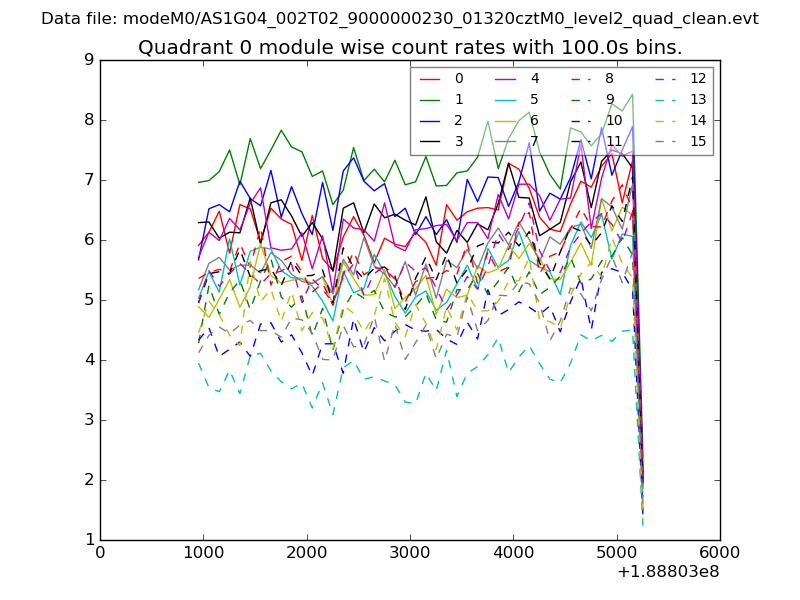 |
 |
| Module-wise count rates for Quadrant B Data is divided into 100 sec bins |
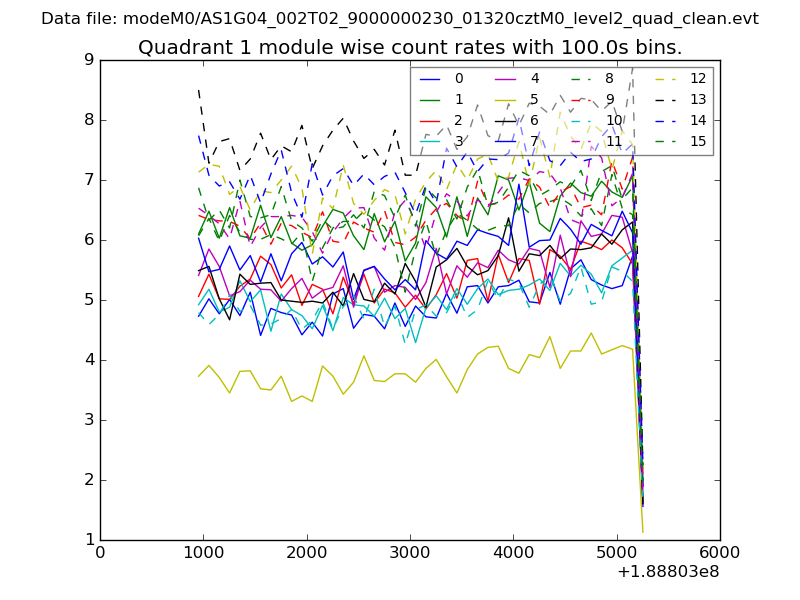 |
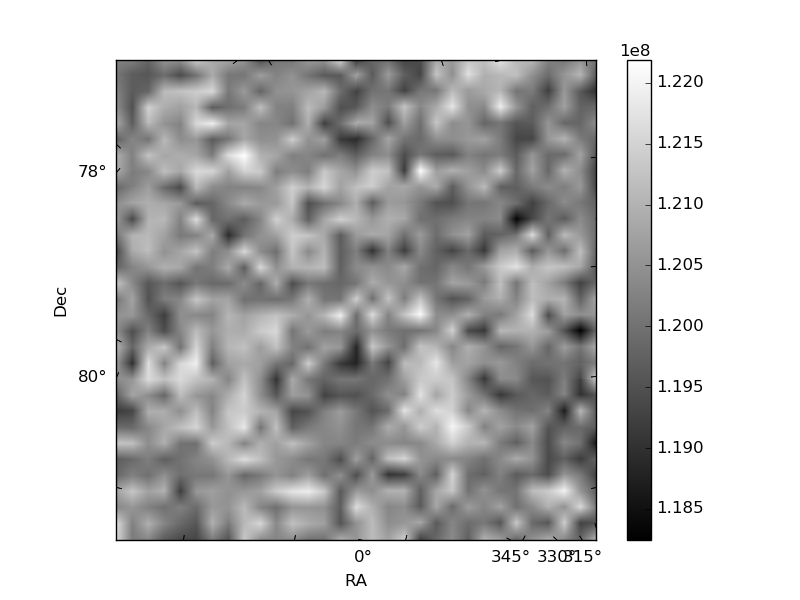 |
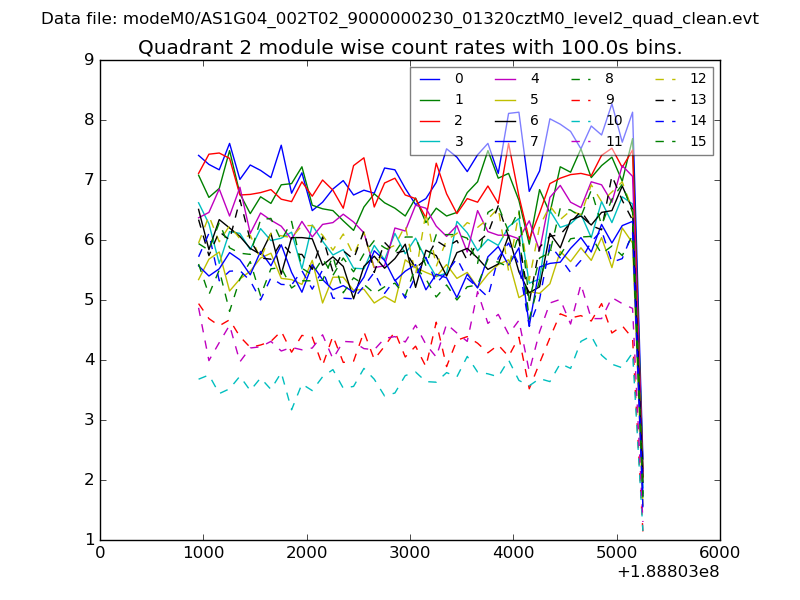
| Module-wise count rates for Quadrant C Data is divided into 100 sec bins |
 |
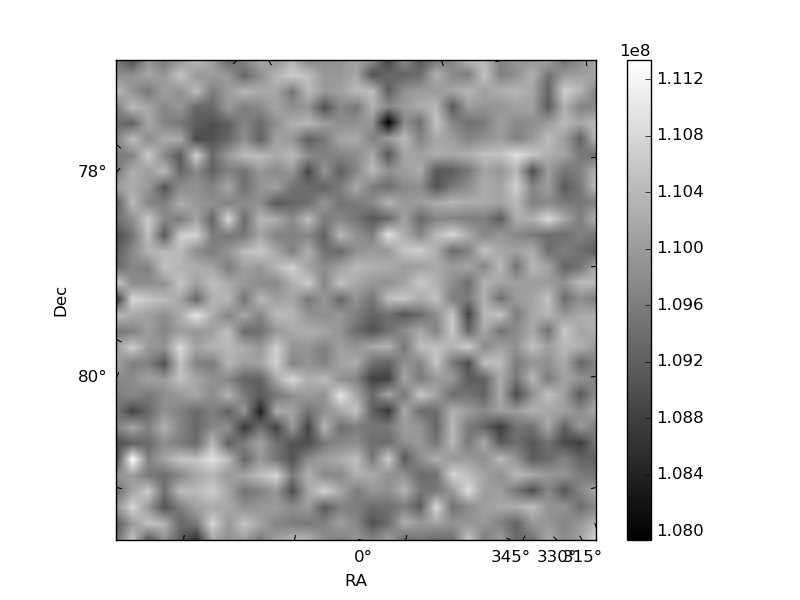 |
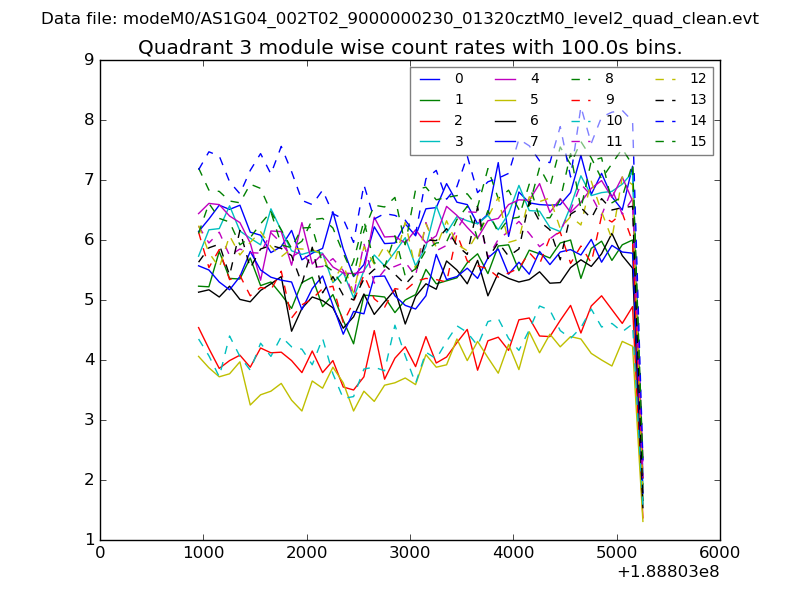
| Module-wise count rates for Quadrant D Data is divided into 100 sec bins |
 |
 |
| Parameter | Plot |
|---|---|
| CZT HV Monitor | 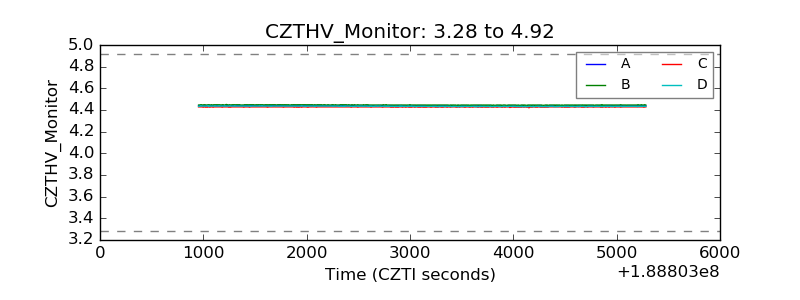 |
| D_VDD | 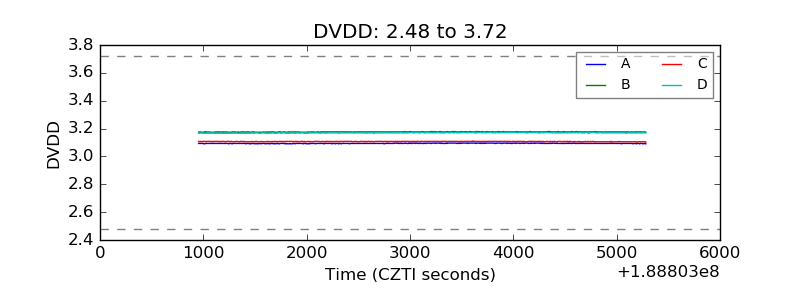 |
| Temperature 1 | 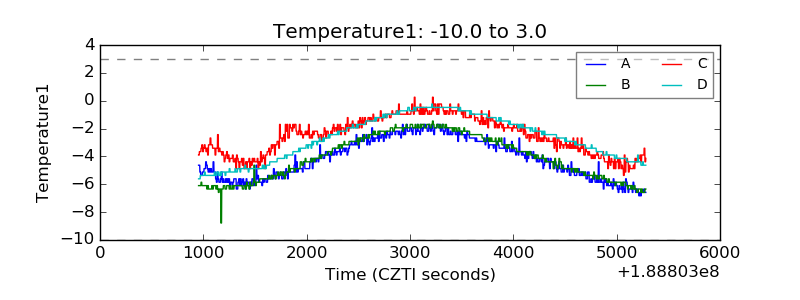 |
| Veto HV Monitor | 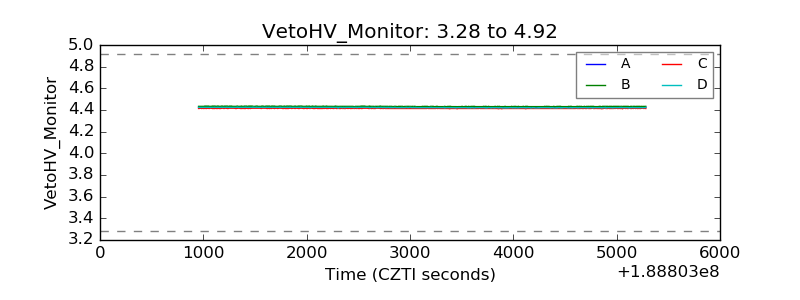 |
| Veto LLD | 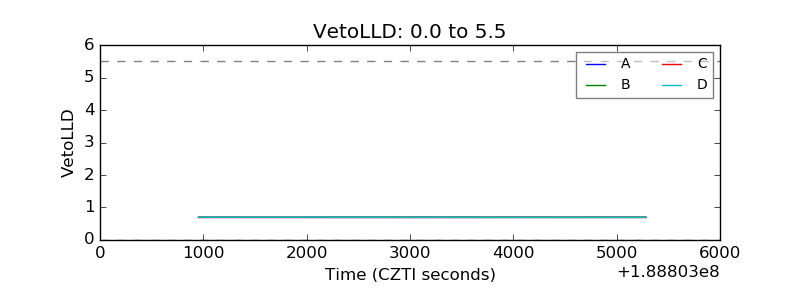 |
| Alpha Counter | 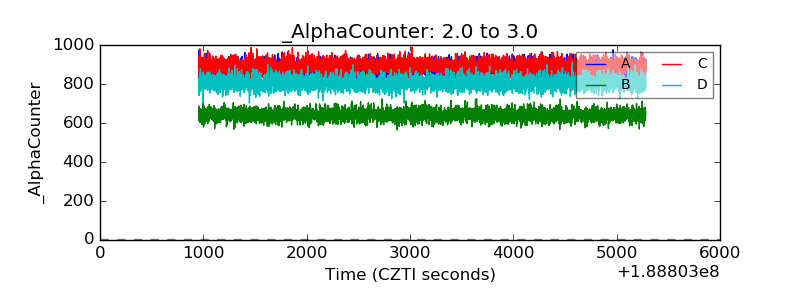 |
| _CPM_Rate | 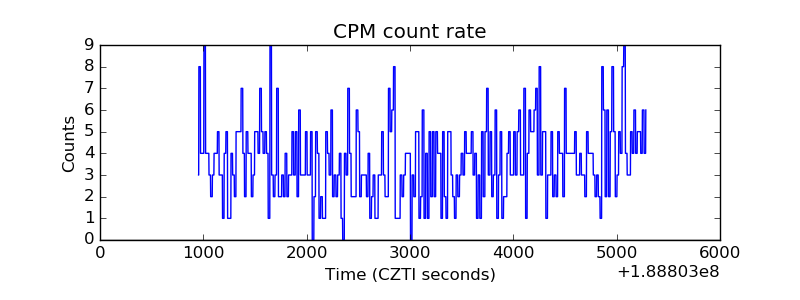 |
| CZT Counter | 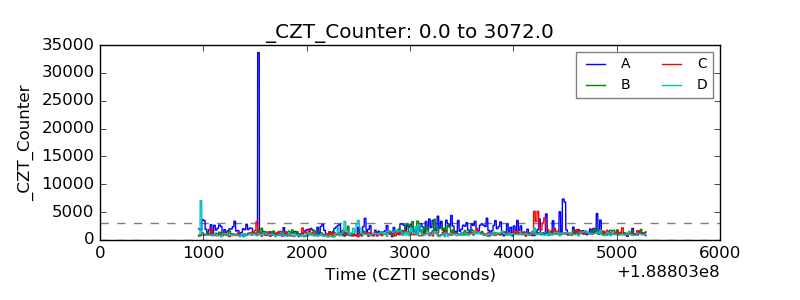 |
| +2.5 Volts monitor |  |
| +5 Volts monitor |  |
| _ROLL_ROT | 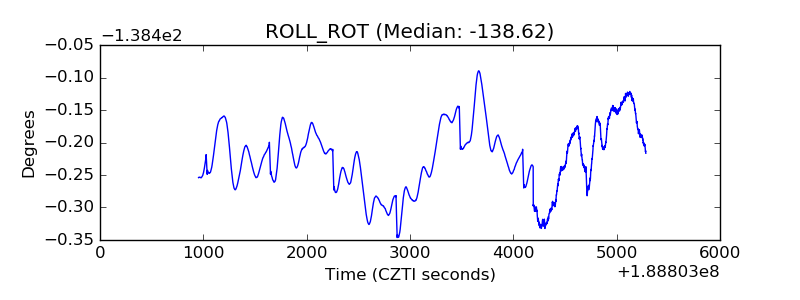 |
| _Roll_DEC | 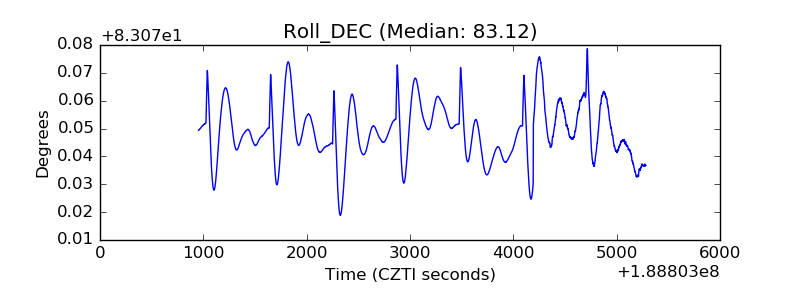 |
| _Roll_RA | 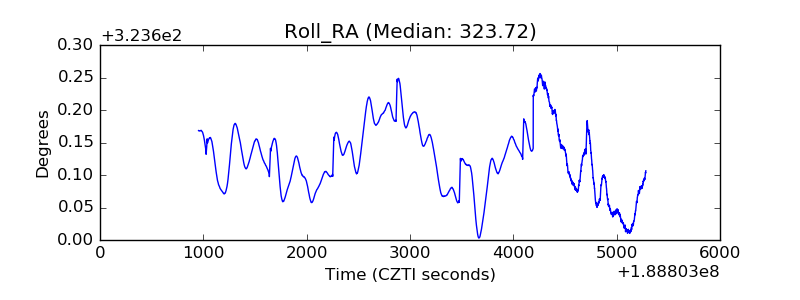 |
| Veto Counter | 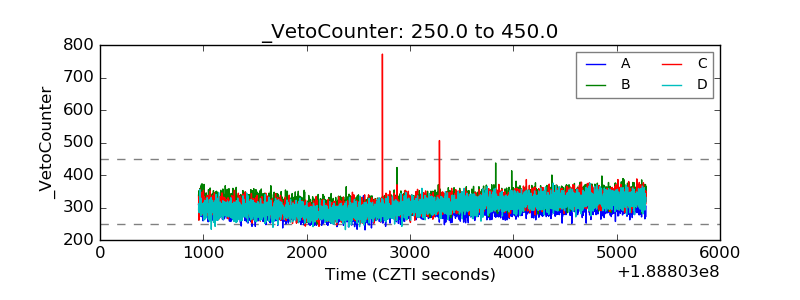 |