| Param | Original file | Final file |
|---|---|---|
| Filename | modeM0/AS1G04_002T02_9000000230_01322cztM0_level2.evt | modeM0/AS1G04_002T02_9000000230_01322cztM0_level2_quad_clean.evt |
| Size (bytes) | 1,178,683,200 | 105,131,520 |
| Size | 1.1 GB | 100.3 MB |
| Events in quadrant A | 9,003,839 | 683,987 |
| Events in quadrant B | 9,591,837 | 685,281 |
| Events in quadrant C | 8,532,205 | 666,447 |
| Events in quadrant D | 8,099,532 | 654,339 |
| Mode M0 | |||
|---|---|---|---|
| Quadrant | BADHDUFLAG | Total packets | Discarded packets |
| A | 0 | 31810 | 1 |
| B | 0 | 33483 | 0 |
| C | 0 | 30381 | 0 |
| D | 0 | 29140 | 0 |
| Mode SS | |||
|---|---|---|---|
| Quadrant | BADHDUFLAG | Total packets | Discarded packets |
| A | 0 | 142 | 0 |
| B | 0 | 142 | 0 |
| C | 0 | 142 | 0 |
| D | 0 | 142 | 0 |
| Quadrant | Total seconds | Saturated seconds | Saturation percentage |
|---|---|---|---|
| A | 7092 | 20 | 0.282008% |
| B | 7092 | 50 | 0.705020% |
| C | 7092 | 5 | 0.070502% |
| D | 7092 | 28 | 0.394811% |
Noise dominated data is calculated using 1-second bins in cleaned event files. If a bin has >2000 counts, and if more than 50% of those come from <1% of pixels, then it is considered to be noise-dominated and hence unusable.
| Quadrant | # 1 sec bins | Bins with >0 counts | Bins with >2000 counts | High rate bins dominated by noise | Noise dominated (total time) | Noise dominated (detector-on time) | Marked lightcurve |
|---|---|---|---|---|---|---|---|
| A | 7092 | 7092 | 442 | 442 | 6.23% | 6.23% | 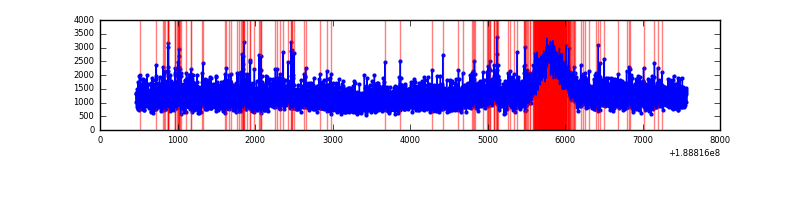 |
| B | 7092 | 7092 | 613 | 613 | 8.64% | 8.64% | 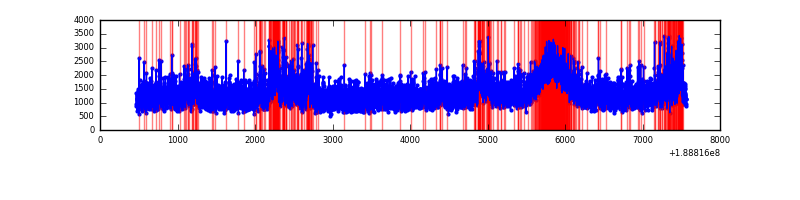 |
| C | 7092 | 7092 | 287 | 287 | 4.05% | 4.05% | 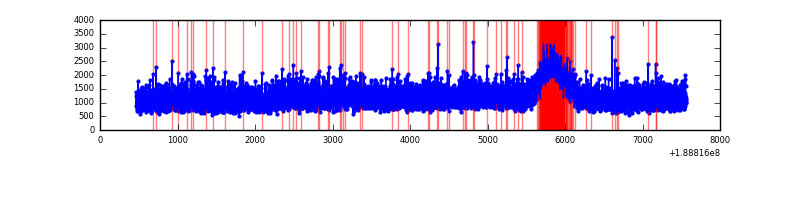 |
| D | 7092 | 7092 | 333 | 333 | 4.70% | 4.70% | 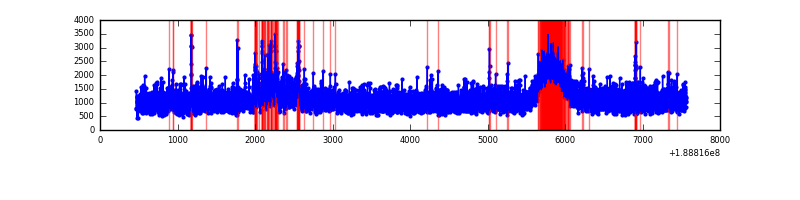 |
Top three noisy pixels from each quadrant. If the there are fewer than three noisy pixels in the level2.evt file, extra rows are filled as -1
| Pixel properties | Quadrant properties | ||||||
|---|---|---|---|---|---|---|---|
| Quadrant | DetID | PixID | Counts | Sigma | Mean | Median | Sigma |
| A | 4 | 32 | 242720 | 444.9 | 2242 | 2258 | 540.5 |
| A | 8 | 14 | 48958 | 86.4 | 2242 | 2258 | 540.5 |
| A | 15 | 127 | 34509 | 59.67 | 2242 | 2258 | 540.5 |
| B | 8 | 4 | 489468 | 893.98 | 2294 | 2307 | 544.9 |
| B | 12 | 52 | 162179 | 293.38 | 2294 | 2307 | 544.9 |
| B | 15 | 22 | 128770 | 232.07 | 2294 | 2307 | 544.9 |
| C | 15 | 241 | 355665 | 607.37 | 2067 | 2136 | 582.1 |
| C | 3 | 79 | 39354 | 63.94 | 2067 | 2136 | 582.1 |
| C | 8 | 208 | 39242 | 63.75 | 2067 | 2136 | 582.1 |
| D | 10 | 84 | 293030 | 459.51 | 2031 | 2106 | 633.1 |
| D | 10 | 125 | 78527 | 120.71 | 2031 | 2106 | 633.1 |
| D | 13 | 169 | 76878 | 118.1 | 2031 | 2106 | 633.1 |
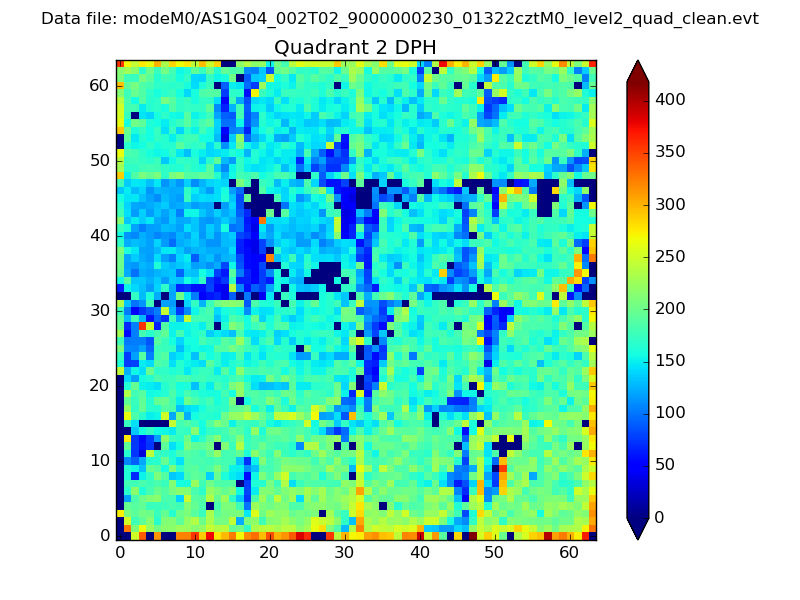
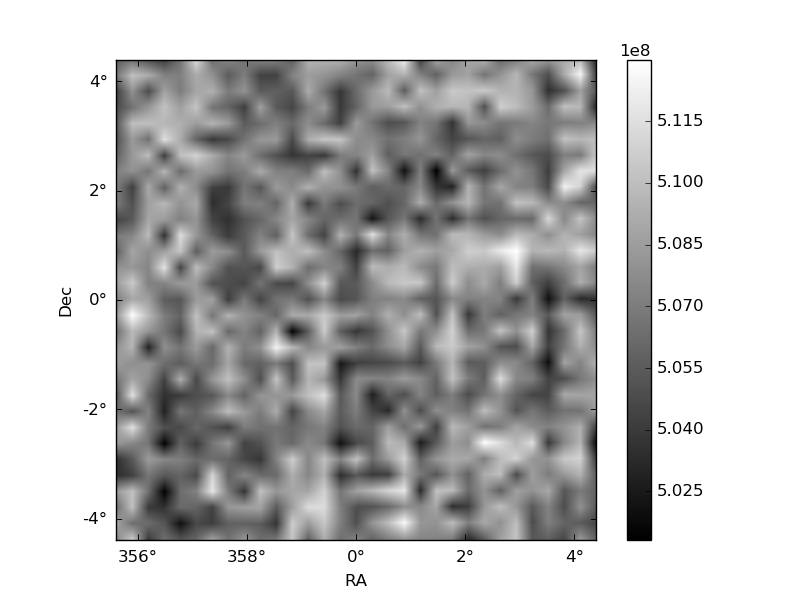
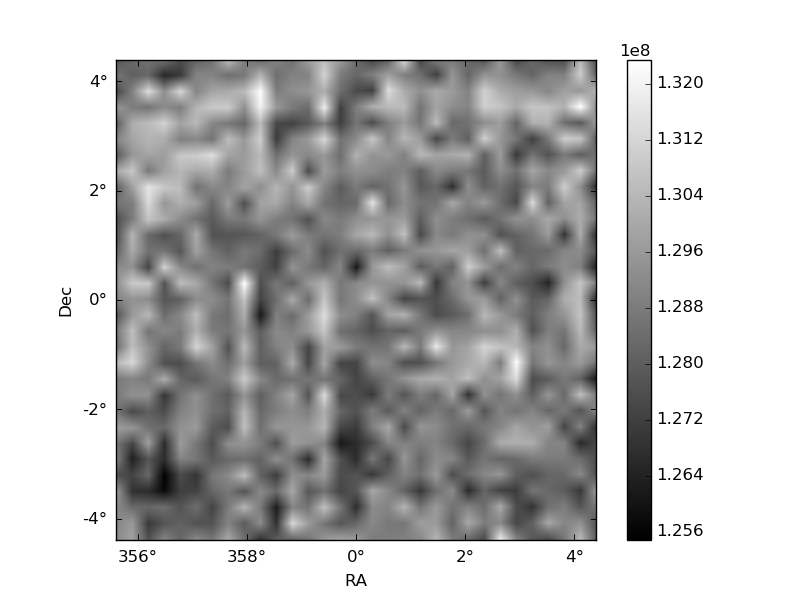
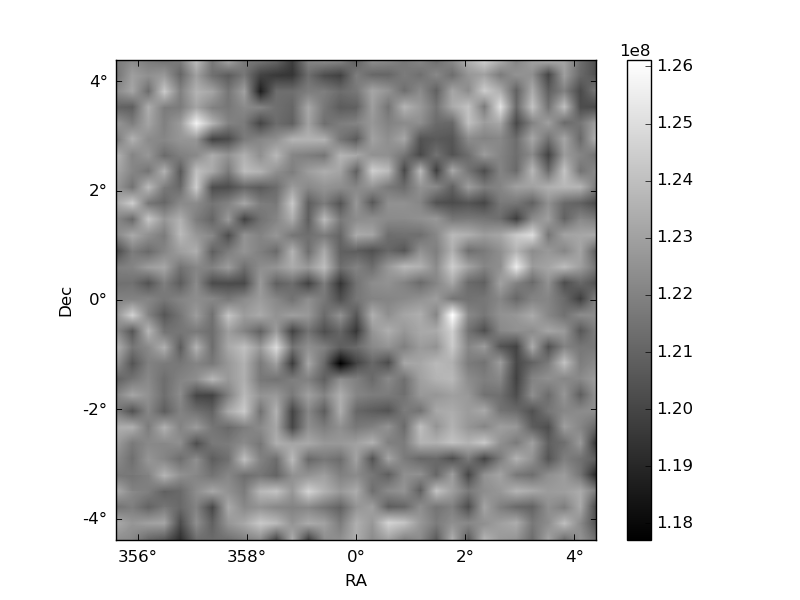
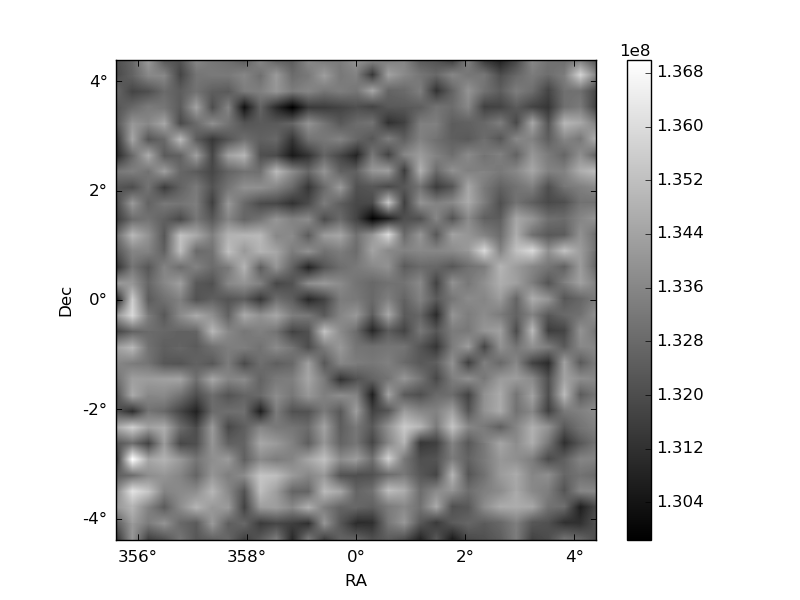
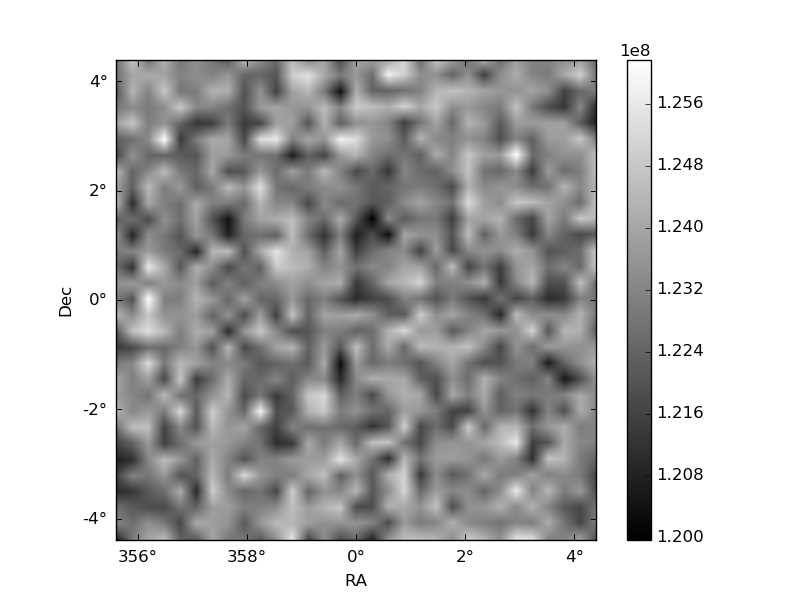
Histogram calculated using DETX and DETY for each event in the final _common_clean file
| Quadrant A | 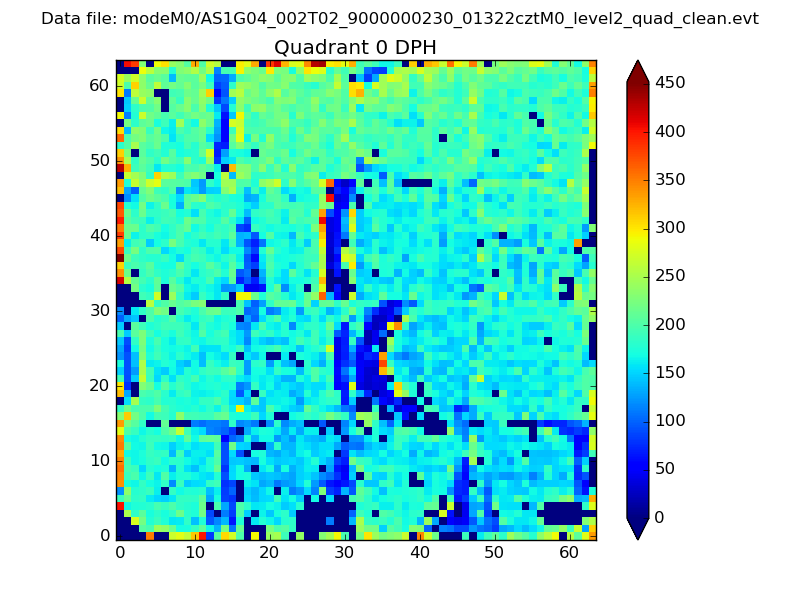 |
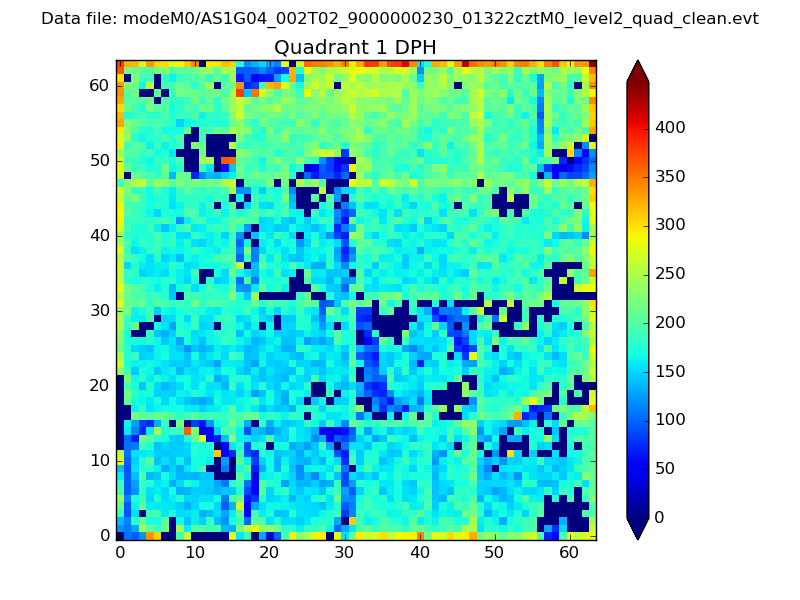 |
Quadrant B |
|---|---|---|---|
| Quadrant D | 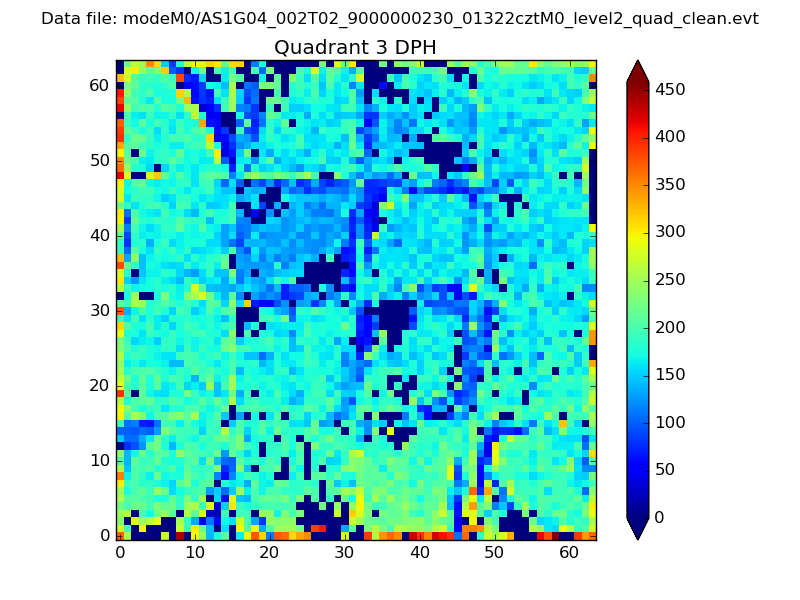 |
 |
Quadrant C |
| Plot type | Count rate plots | Images |
|---|---|---|
| Comparison with Poisson distribution Blue bars denote a histogram of data divided into 1 sec bins. Red curve is a Poisson curve with rate = median count rate of data. |
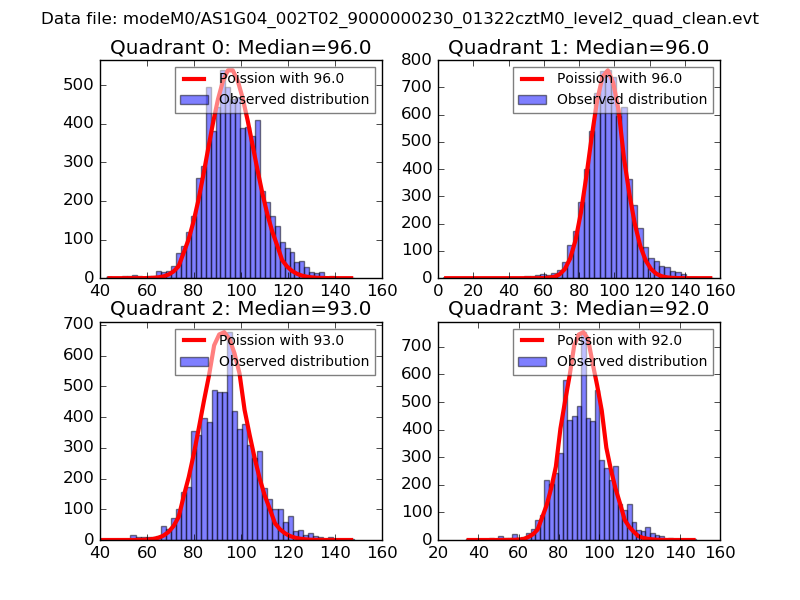 |
 |
| Quadrant-wise count rates Data is divided into 100 sec bins |
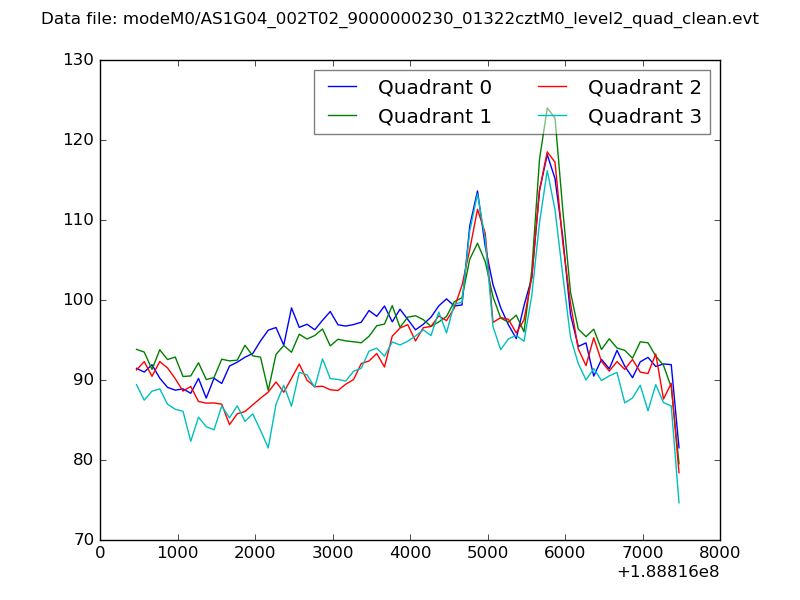 |
|
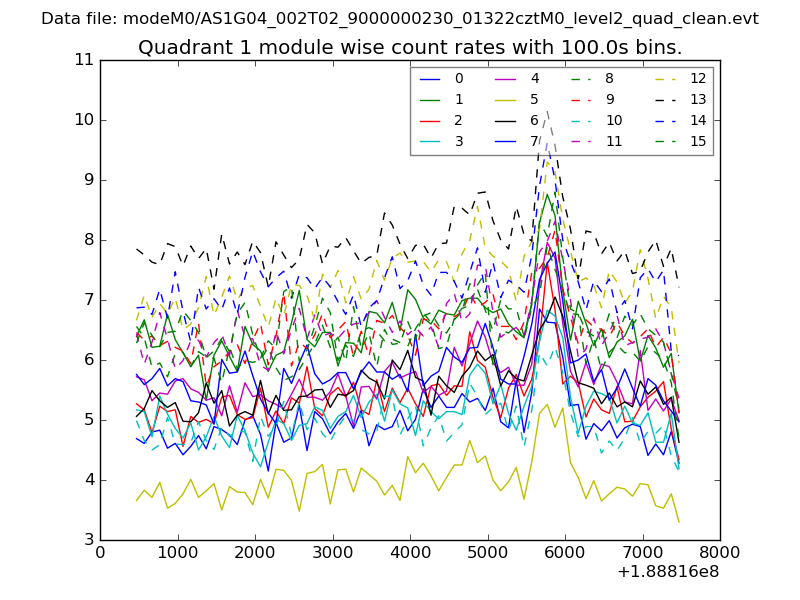
| Module-wise count rates for Quadrant A Data is divided into 100 sec bins |
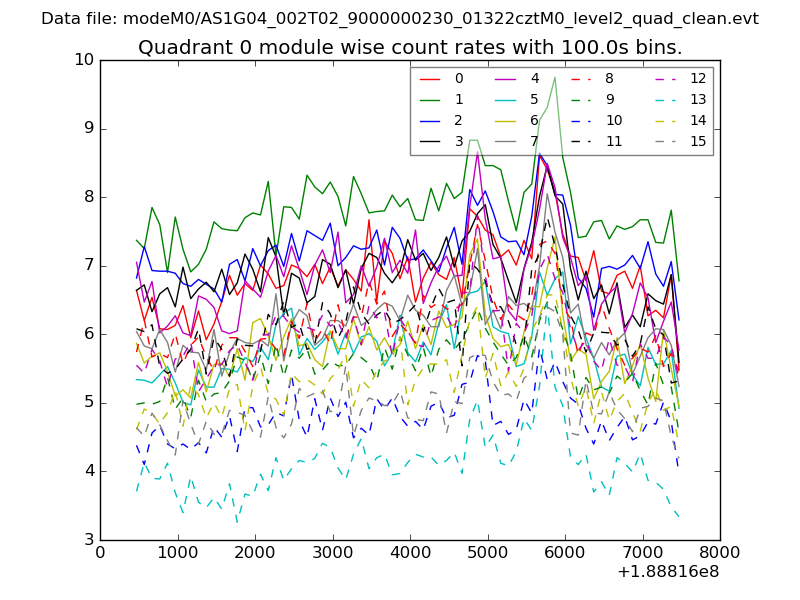 |
 |
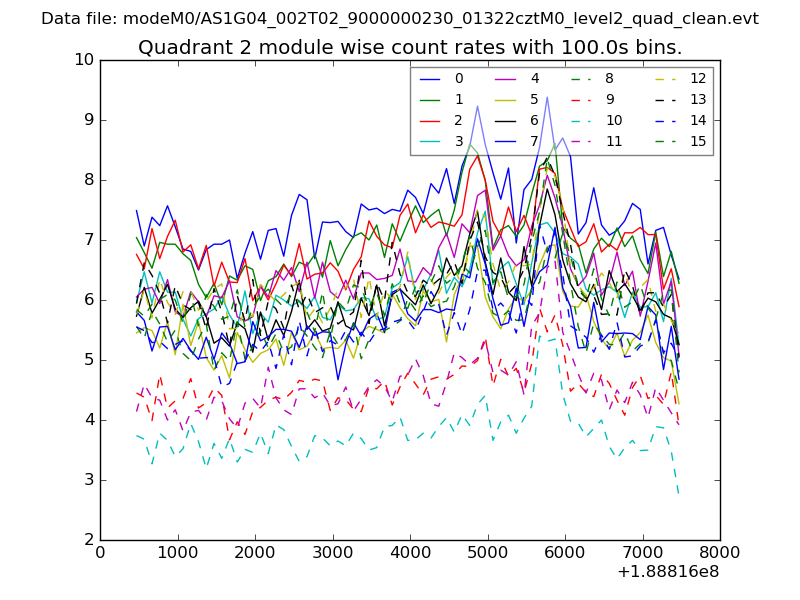
| Module-wise count rates for Quadrant B Data is divided into 100 sec bins |
 |
 |
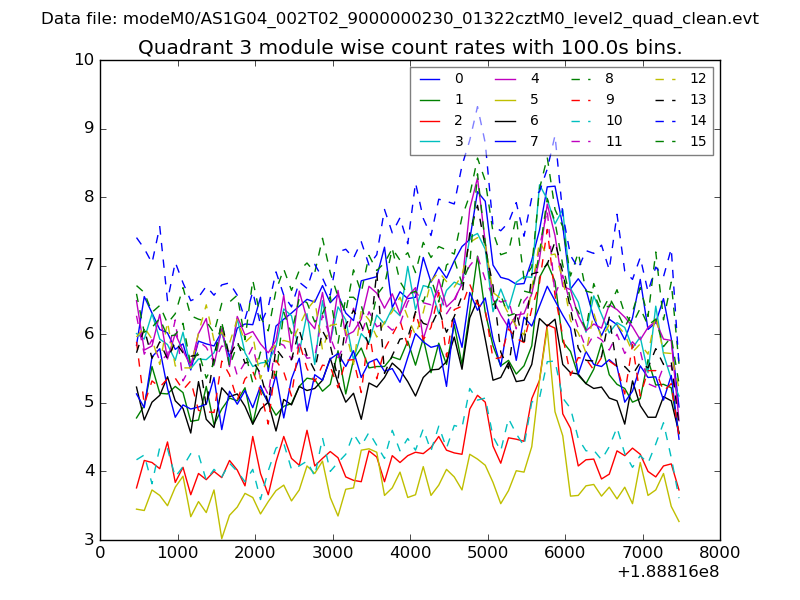
| Module-wise count rates for Quadrant C Data is divided into 100 sec bins |
 |
 |
| Module-wise count rates for Quadrant D Data is divided into 100 sec bins |
 |
 |
| Parameter | Plot |
|---|---|
| CZT HV Monitor | 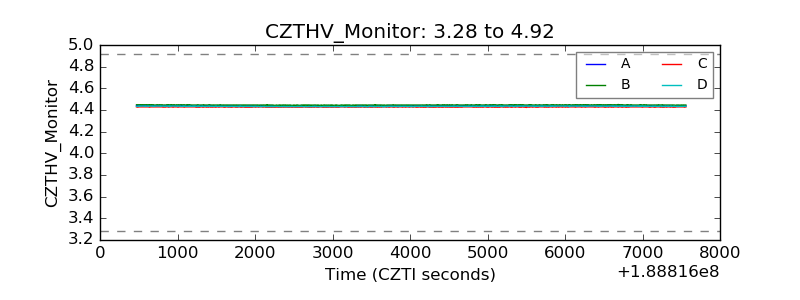 |
| D_VDD | 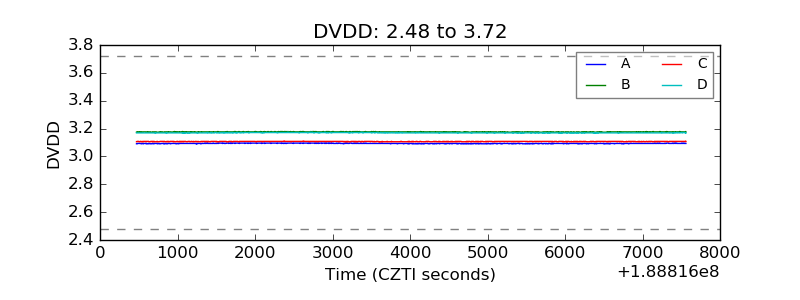 |
| Temperature 1 | 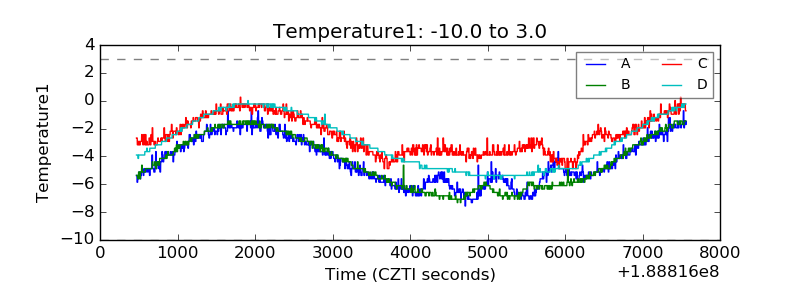 |
| Veto HV Monitor | 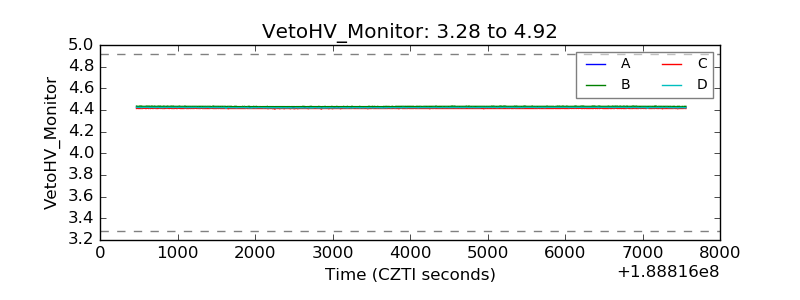 |
| Veto LLD | 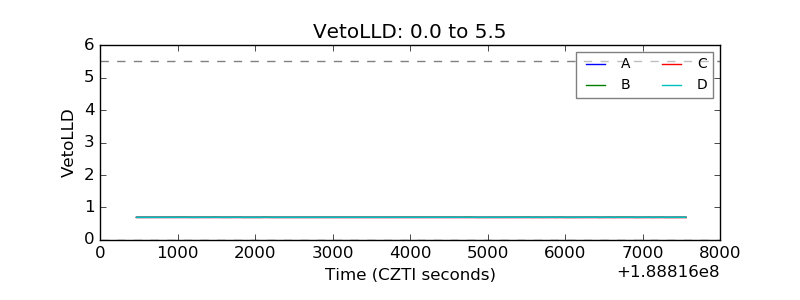 |
| Alpha Counter | 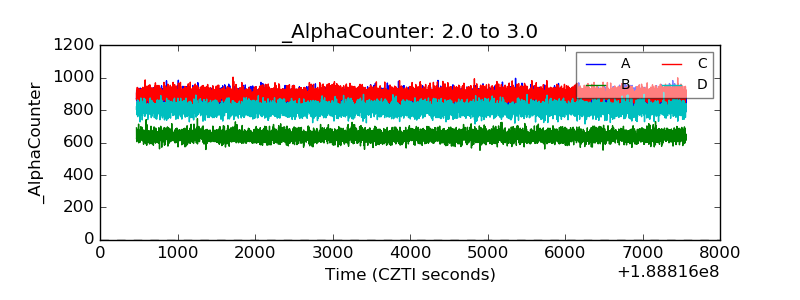 |
| _CPM_Rate | 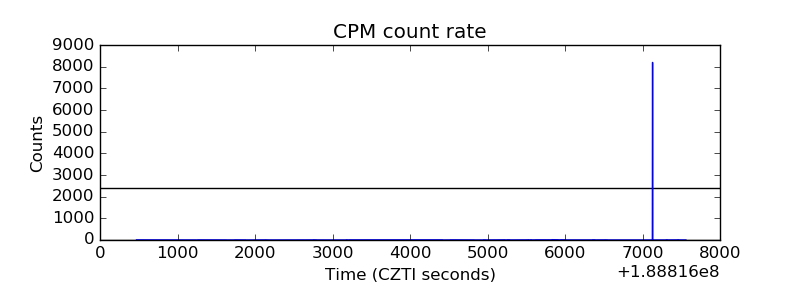 |
| CZT Counter | 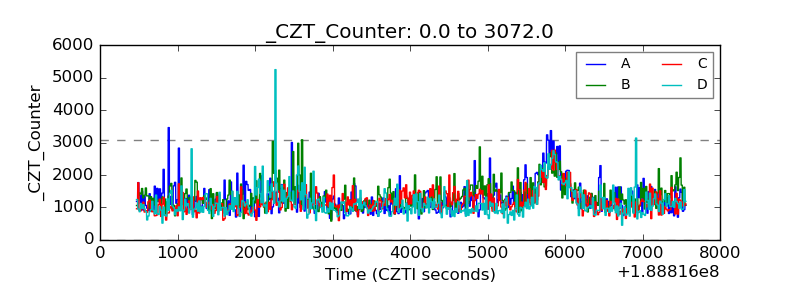 |
| +2.5 Volts monitor | 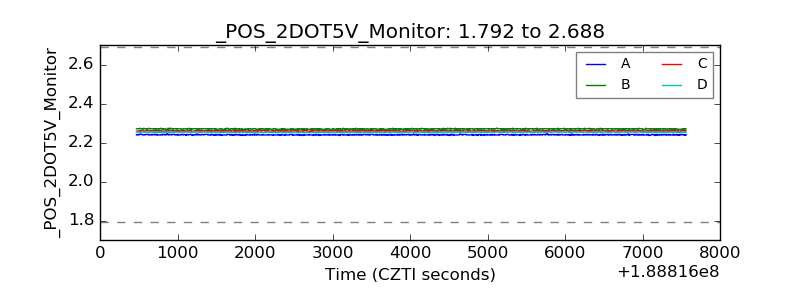 |
| +5 Volts monitor | 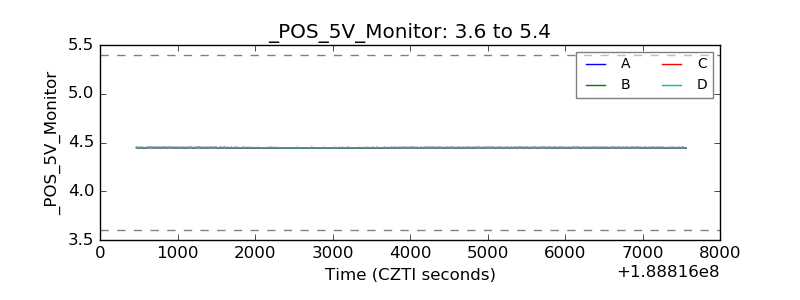 |
| _ROLL_ROT | 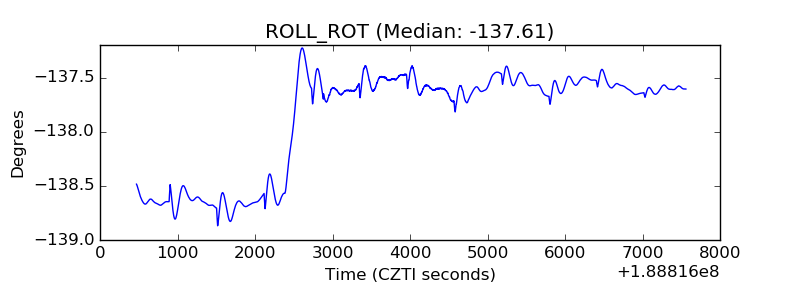 |
| _Roll_DEC | 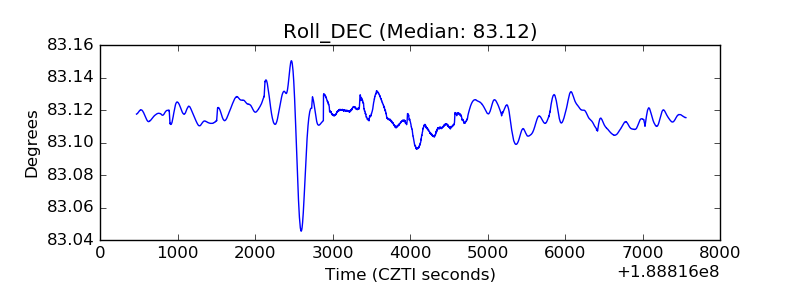 |
| _Roll_RA | 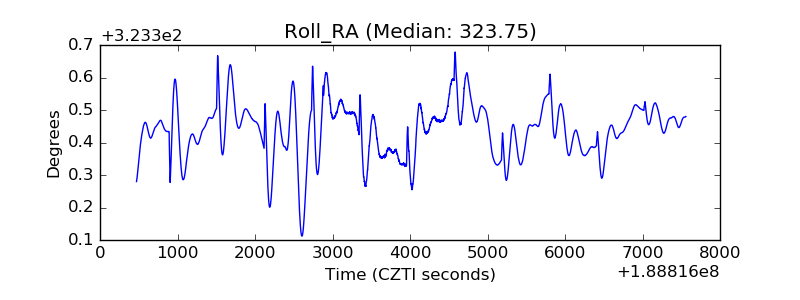 |
| Veto Counter | 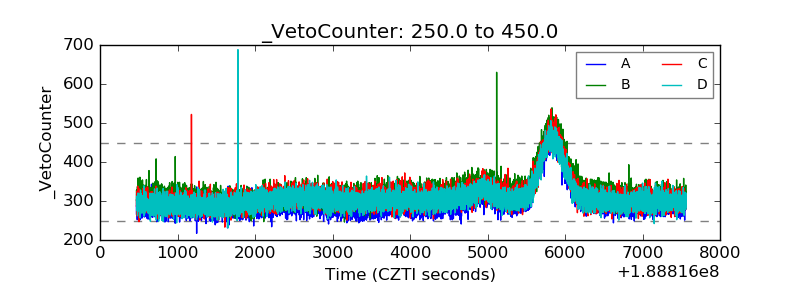 |