| Param | Original file | Final file |
|---|---|---|
| Filename | modeM0/AS1G04_002T02_9000000230_01323cztM0_level2.evt | modeM0/AS1G04_002T02_9000000230_01323cztM0_level2_quad_clean.evt |
| Size (bytes) | 1,181,914,560 | 102,015,360 |
| Size | 1.1 GB | 97.3 MB |
| Events in quadrant A | 8,921,131 | 665,338 |
| Events in quadrant B | 9,738,236 | 661,340 |
| Events in quadrant C | 8,496,227 | 645,789 |
| Events in quadrant D | 8,182,326 | 635,985 |
| Mode M9 | |||
|---|---|---|---|
| Quadrant | BADHDUFLAG | Total packets | Discarded packets |
| A | 0 | 2 | 0 |
| B | 0 | 2 | 0 |
| C | 0 | 2 | 0 |
| D | 0 | 2 | 0 |
| Mode M0 | |||
|---|---|---|---|
| Quadrant | BADHDUFLAG | Total packets | Discarded packets |
| A | 0 | 31423 | 2 |
| B | 0 | 33794 | 1 |
| C | 0 | 30194 | 1 |
| D | 0 | 29202 | 1 |
| Mode SS | |||
|---|---|---|---|
| Quadrant | BADHDUFLAG | Total packets | Discarded packets |
| A | 0 | 140 | 0 |
| B | 0 | 140 | 0 |
| C | 0 | 140 | 0 |
| D | 0 | 140 | 0 |
| Quadrant | Total seconds | Saturated seconds | Saturation percentage |
|---|---|---|---|
| A | 6902 | 159 | 2.303680% |
| B | 6902 | 115 | 1.666184% |
| C | 6902 | 74 | 1.072153% |
| D | 6902 | 117 | 1.695161% |
Noise dominated data is calculated using 1-second bins in cleaned event files. If a bin has >2000 counts, and if more than 50% of those come from <1% of pixels, then it is considered to be noise-dominated and hence unusable.
| Quadrant | # 1 sec bins | Bins with >0 counts | Bins with >2000 counts | High rate bins dominated by noise | Noise dominated (total time) | Noise dominated (detector-on time) | Marked lightcurve |
|---|---|---|---|---|---|---|---|
| A | 7102 | 6902 | 448 | 448 | 6.31% | 6.49% | 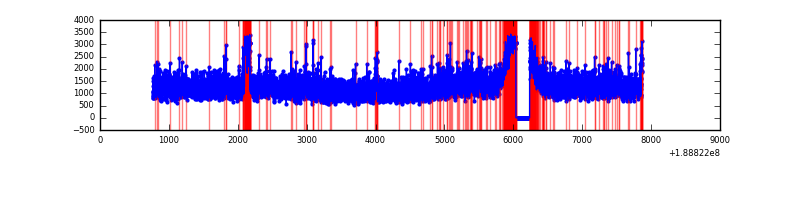 |
| B | 7102 | 6902 | 743 | 743 | 10.46% | 10.76% | 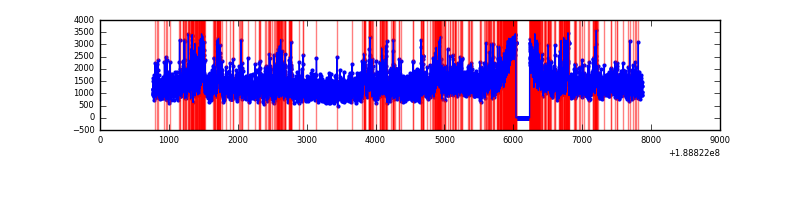 |
| C | 7102 | 6902 | 314 | 314 | 4.42% | 4.55% |  |
| D | 7102 | 6902 | 345 | 345 | 4.86% | 5.00% | 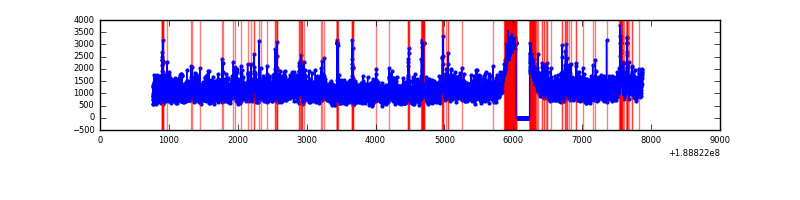 |
Top three noisy pixels from each quadrant. If the there are fewer than three noisy pixels in the level2.evt file, extra rows are filled as -1
| Pixel properties | Quadrant properties | ||||||
|---|---|---|---|---|---|---|---|
| Quadrant | DetID | PixID | Counts | Sigma | Mean | Median | Sigma |
| A | 4 | 32 | 330728 | 624.88 | 2177 | 2196 | 525.7 |
| A | 15 | 127 | 77283 | 142.82 | 2177 | 2196 | 525.7 |
| A | 8 | 14 | 59857 | 109.67 | 2177 | 2196 | 525.7 |
| B | 8 | 4 | 776230 | 1466.52 | 2231 | 2242 | 527.8 |
| B | 12 | 52 | 172157 | 321.95 | 2231 | 2242 | 527.8 |
| B | 5 | 249 | 106032 | 196.66 | 2231 | 2242 | 527.8 |
| C | 15 | 241 | 340456 | 593.73 | 2035 | 2105 | 569.9 |
| C | 8 | 208 | 120693 | 208.09 | 2035 | 2105 | 569.9 |
| C | 3 | 79 | 35645 | 58.85 | 2035 | 2105 | 569.9 |
| D | 13 | 169 | 143629 | 224.77 | 2005 | 2079 | 629.7 |
| D | 10 | 125 | 130261 | 203.55 | 2005 | 2079 | 629.7 |
| D | 13 | 73 | 94164 | 146.23 | 2005 | 2079 | 629.7 |
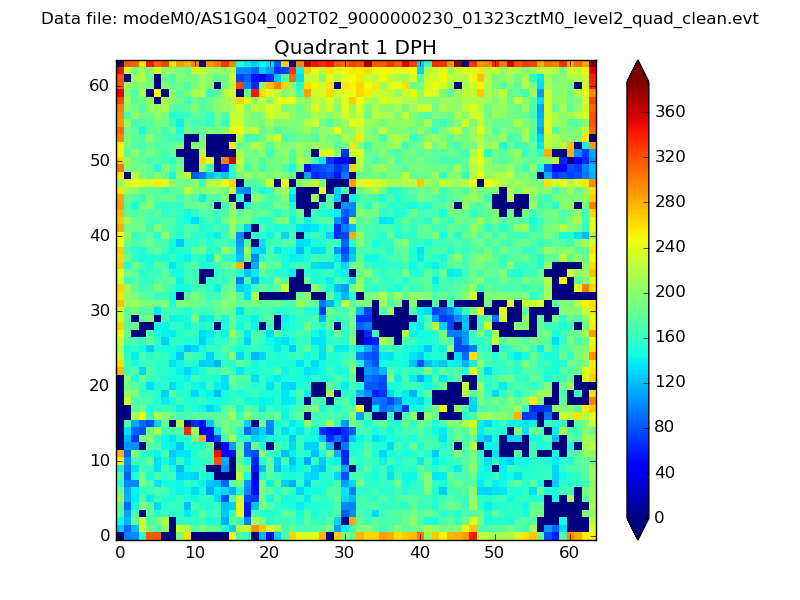
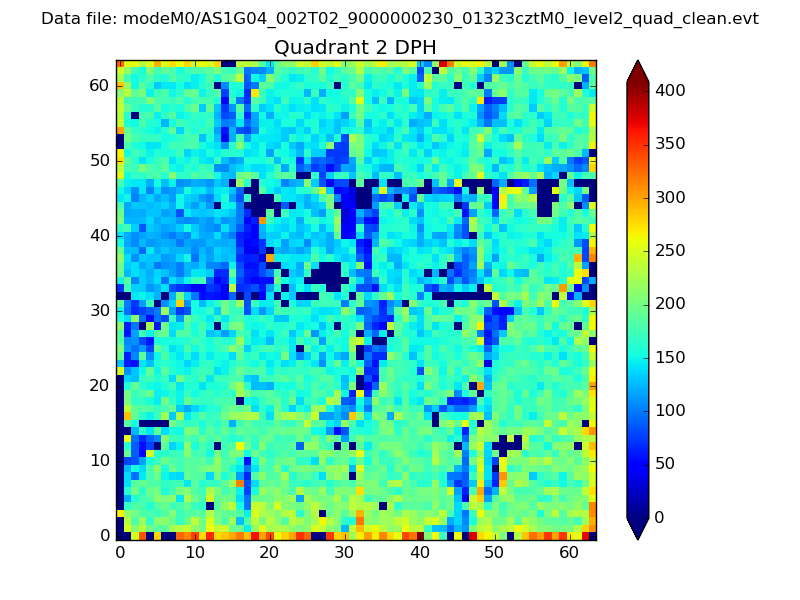
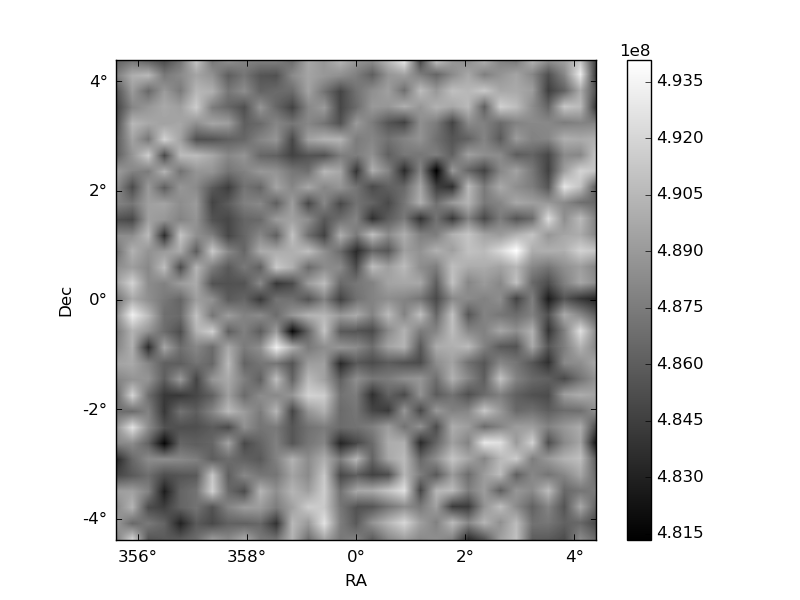
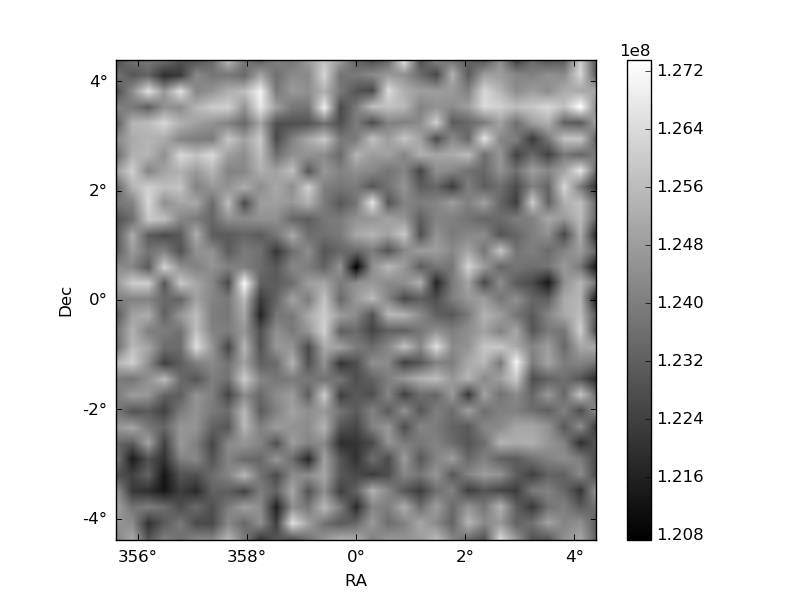
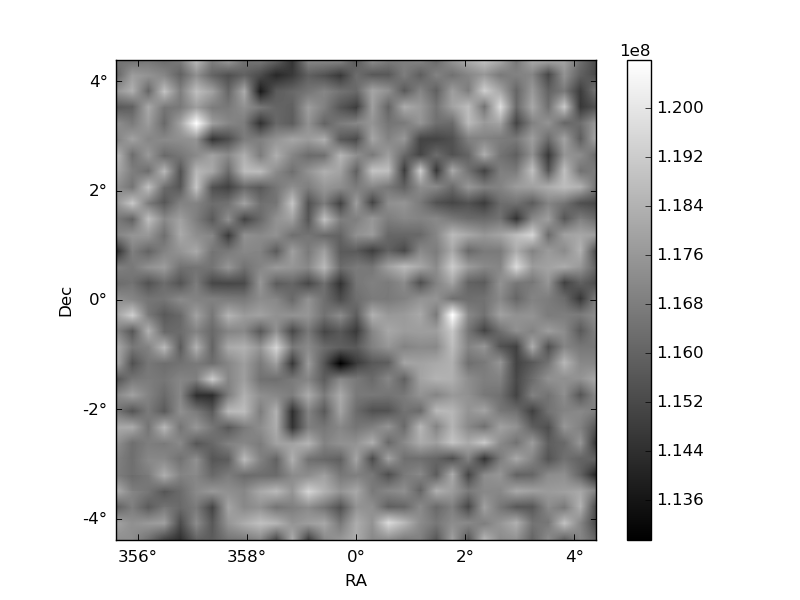
Histogram calculated using DETX and DETY for each event in the final _common_clean file
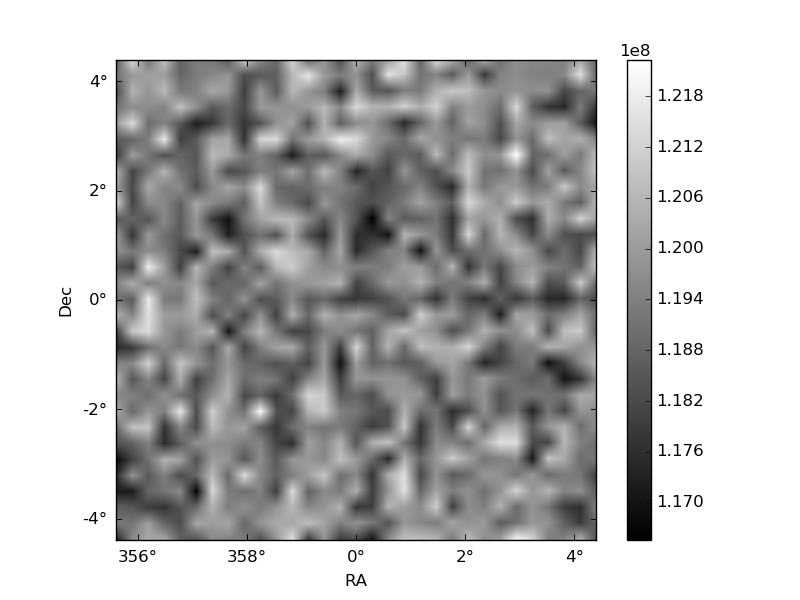
| Quadrant A | 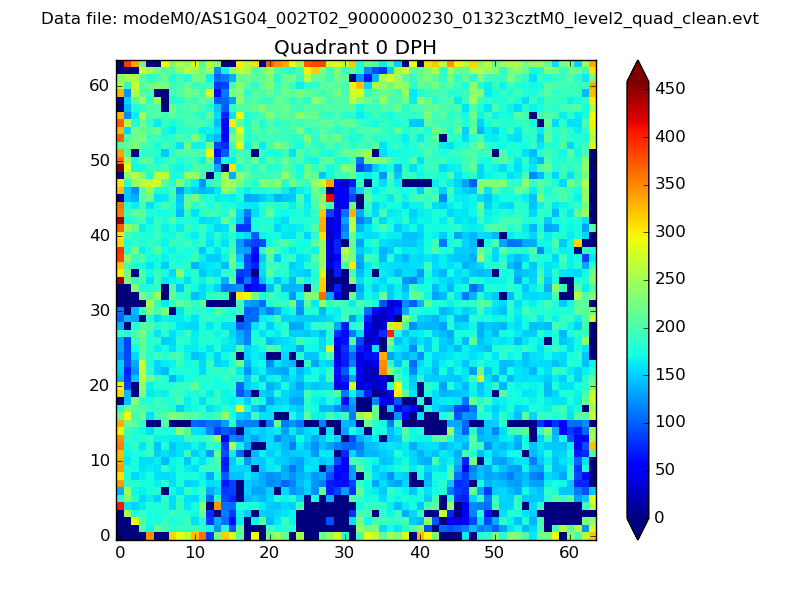 |
 |
Quadrant B |
|---|---|---|---|
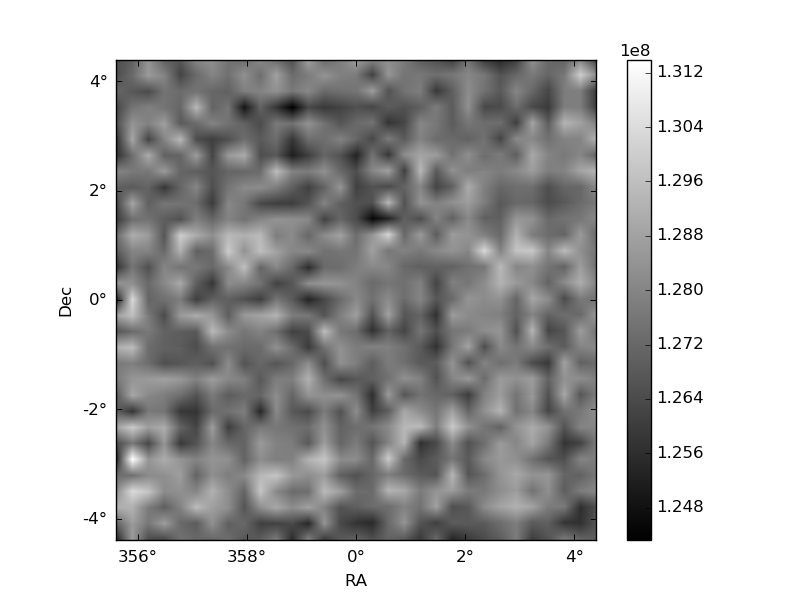
| Quadrant D | 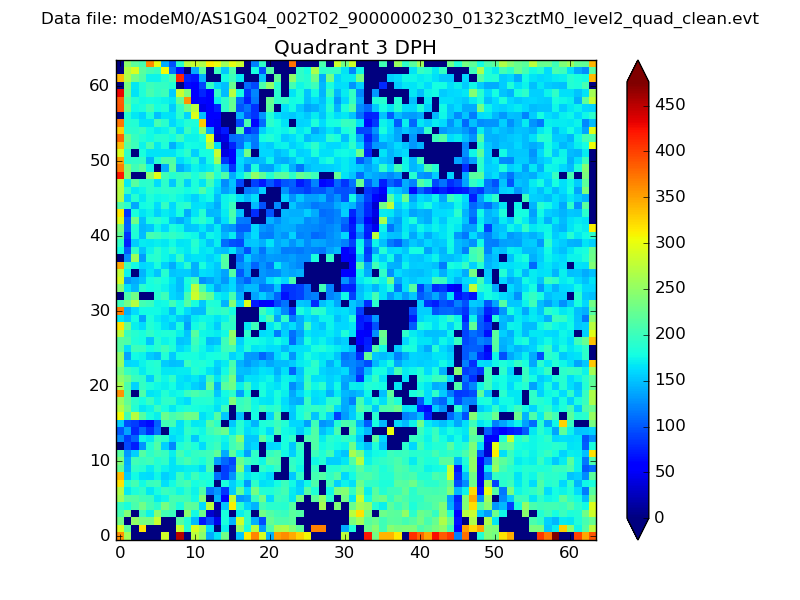 |
 |
Quadrant C |
| Plot type | Count rate plots | Images |
|---|---|---|
| Comparison with Poisson distribution Blue bars denote a histogram of data divided into 1 sec bins. Red curve is a Poisson curve with rate = median count rate of data. |
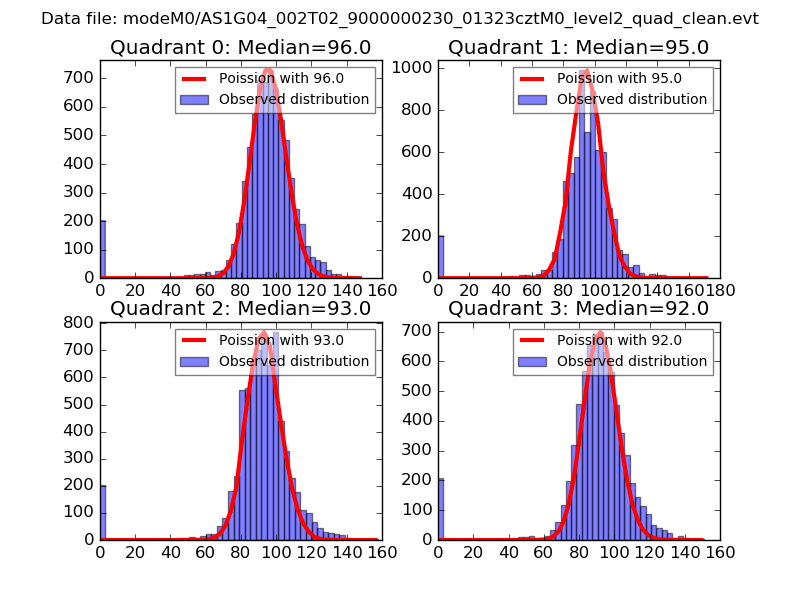 |
 |
| Quadrant-wise count rates Data is divided into 100 sec bins |
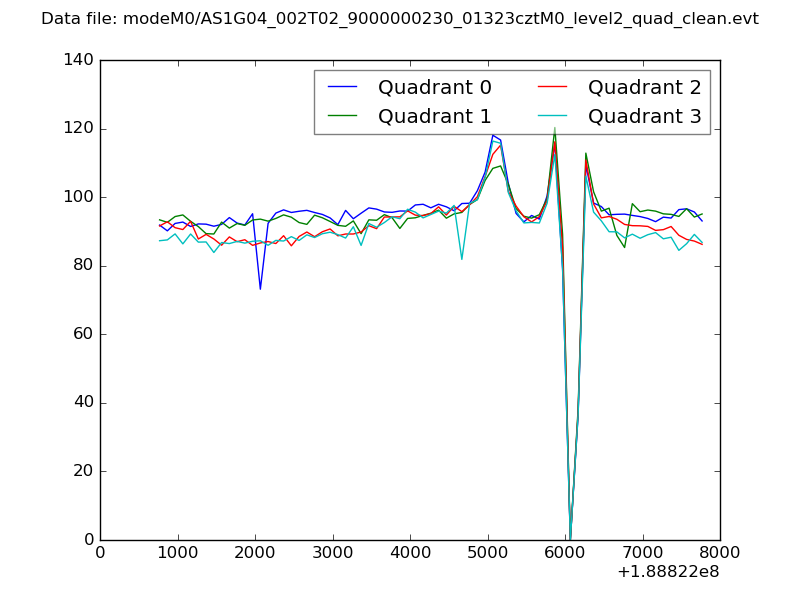 |
|
| Module-wise count rates for Quadrant A Data is divided into 100 sec bins |
 |
 |
| Module-wise count rates for Quadrant B Data is divided into 100 sec bins |
 |
 |
| Module-wise count rates for Quadrant C Data is divided into 100 sec bins |
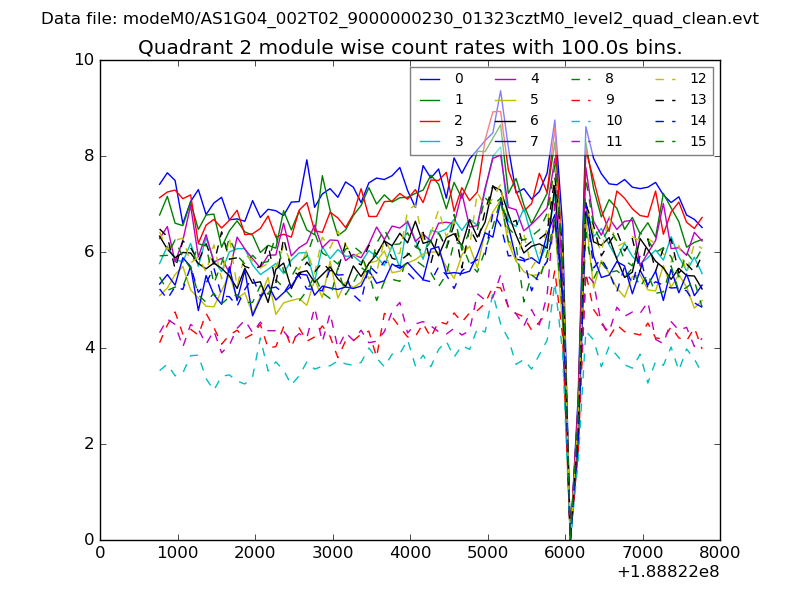 |
 |
| Module-wise count rates for Quadrant D Data is divided into 100 sec bins |
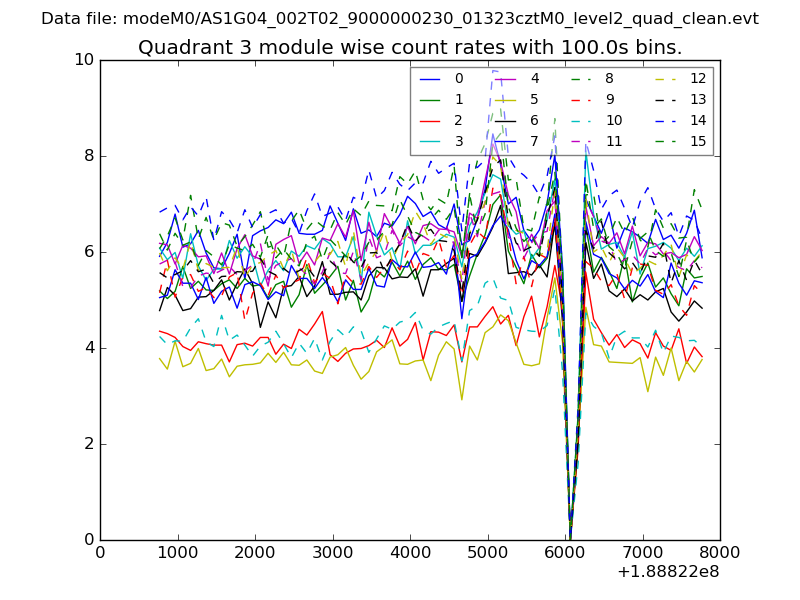 |
 |
| Parameter | Plot |
|---|---|
| CZT HV Monitor | 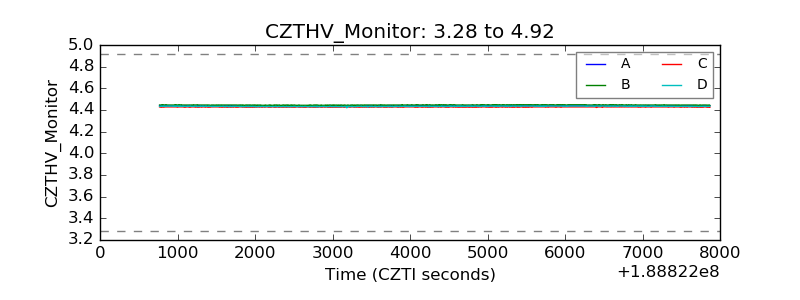 |
| D_VDD | 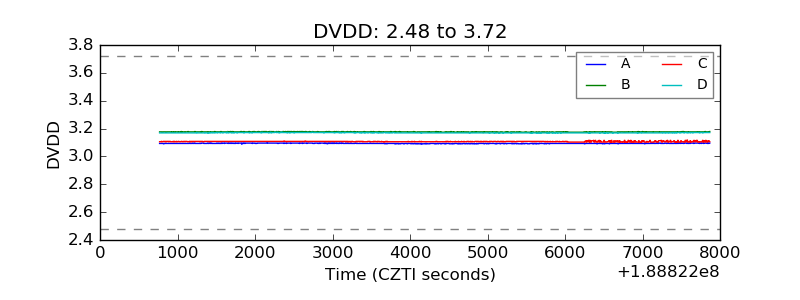 |
| Temperature 1 | 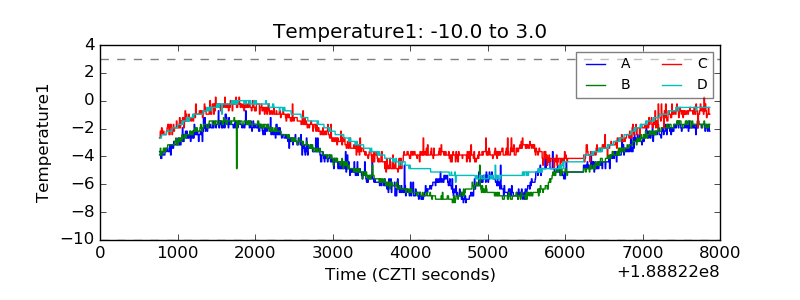 |
| Veto HV Monitor | 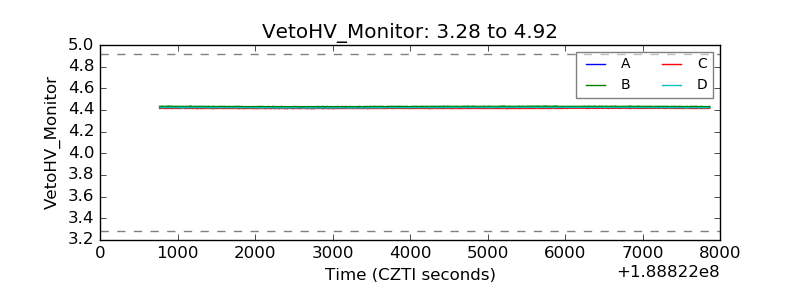 |
| Veto LLD | 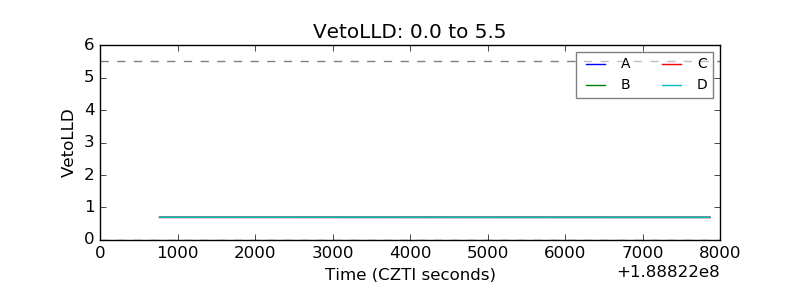 |
| Alpha Counter | 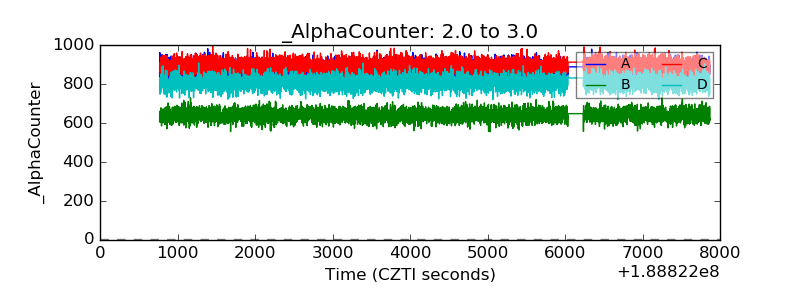 |
| _CPM_Rate | 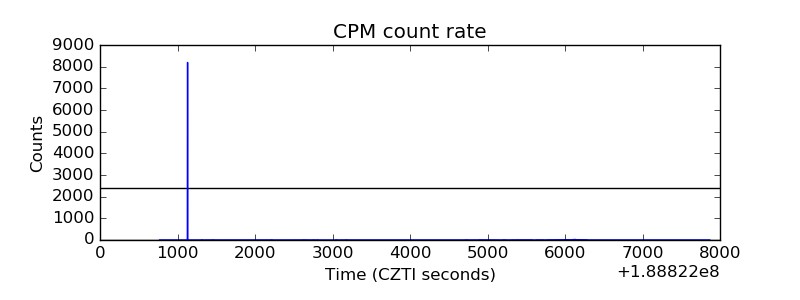 |
| CZT Counter | 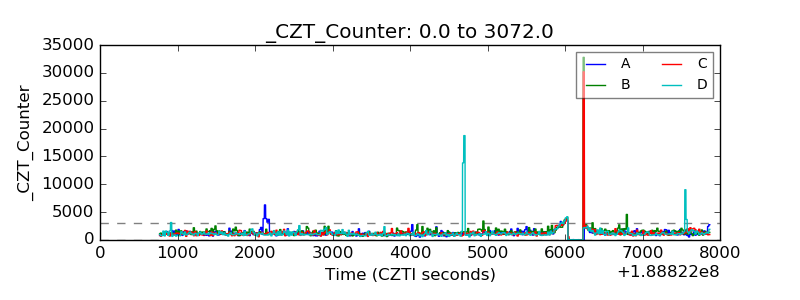 |
| +2.5 Volts monitor |  |
| +5 Volts monitor |  |
| _ROLL_ROT | 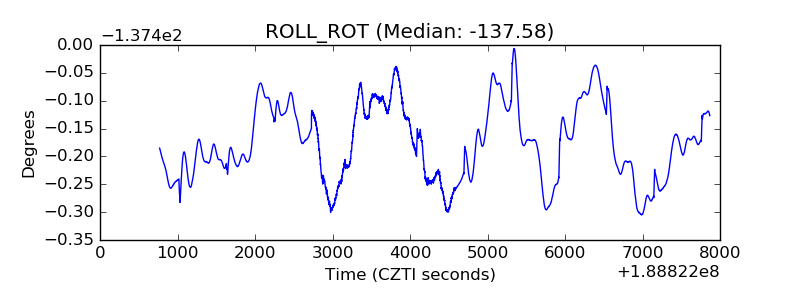 |
| _Roll_DEC | 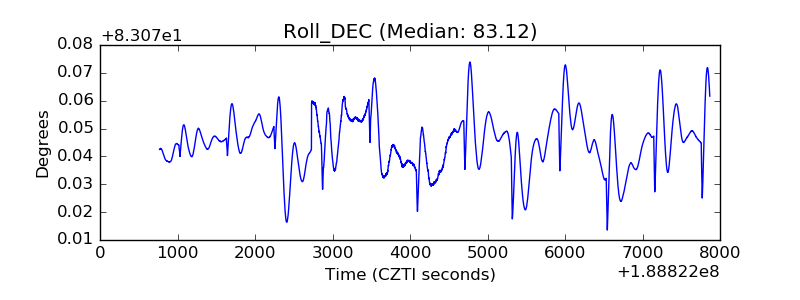 |
| _Roll_RA | 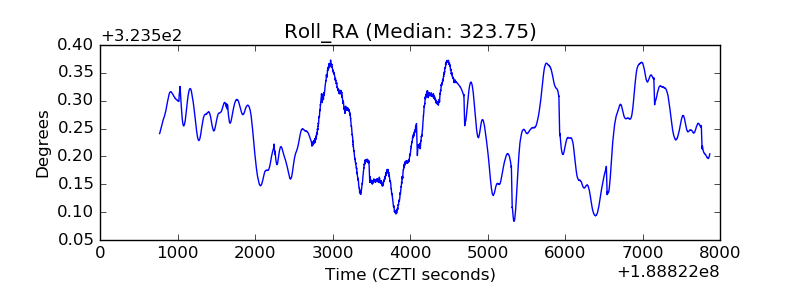 |
| Veto Counter | 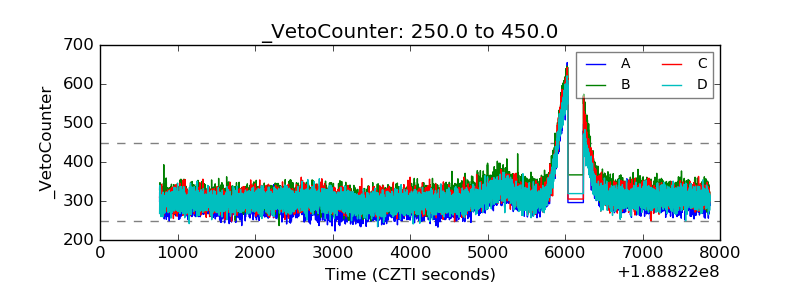 |