| Param | Original file | Final file |
|---|---|---|
| Filename | modeM0/AS1G04_002T02_9000000230_01324cztM0_level2.evt | modeM0/AS1G04_002T02_9000000230_01324cztM0_level2_quad_clean.evt |
| Size (bytes) | 1,100,165,760 | 96,672,960 |
| Size | 1.0 GB | 92.2 MB |
| Events in quadrant A | 8,087,921 | 635,986 |
| Events in quadrant B | 8,578,188 | 628,879 |
| Events in quadrant C | 8,250,636 | 607,131 |
| Events in quadrant D | 7,967,866 | 598,433 |
| Mode M9 | |||
|---|---|---|---|
| Quadrant | BADHDUFLAG | Total packets | Discarded packets |
| A | 0 | 5 | 0 |
| B | 0 | 5 | 0 |
| C | 0 | 5 | 0 |
| D | 0 | 5 | 0 |
| Mode M0 | |||
|---|---|---|---|
| Quadrant | BADHDUFLAG | Total packets | Discarded packets |
| A | 0 | 28652 | 2 |
| B | 0 | 30128 | 1 |
| C | 0 | 29159 | 1 |
| D | 0 | 28312 | 1 |
| Mode SS | |||
|---|---|---|---|
| Quadrant | BADHDUFLAG | Total packets | Discarded packets |
| A | 0 | 134 | 0 |
| B | 0 | 134 | 0 |
| C | 0 | 134 | 0 |
| D | 0 | 134 | 0 |
| Quadrant | Total seconds | Saturated seconds | Saturation percentage |
|---|---|---|---|
| A | 6553 | 24 | 0.366244% |
| B | 6553 | 41 | 0.625668% |
| C | 6553 | 37 | 0.564627% |
| D | 6553 | 123 | 1.877003% |
Noise dominated data is calculated using 1-second bins in cleaned event files. If a bin has >2000 counts, and if more than 50% of those come from <1% of pixels, then it is considered to be noise-dominated and hence unusable.
| Quadrant | # 1 sec bins | Bins with >0 counts | Bins with >2000 counts | High rate bins dominated by noise | Noise dominated (total time) | Noise dominated (detector-on time) | Marked lightcurve |
|---|---|---|---|---|---|---|---|
| A | 7063 | 6553 | 268 | 268 | 3.79% | 4.09% | 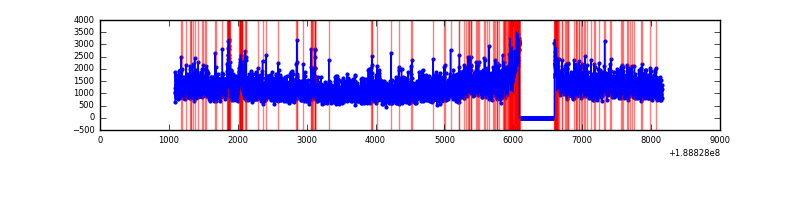 |
| B | 7063 | 6554 | 381 | 381 | 5.39% | 5.81% | 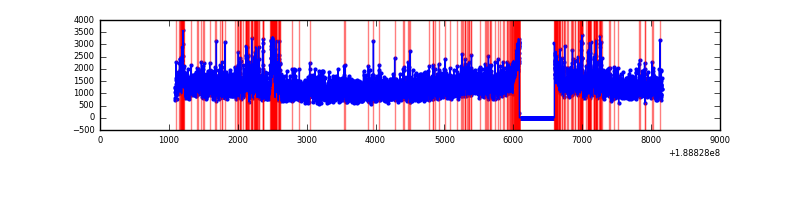 |
| C | 7063 | 6553 | 267 | 267 | 3.78% | 4.07% | 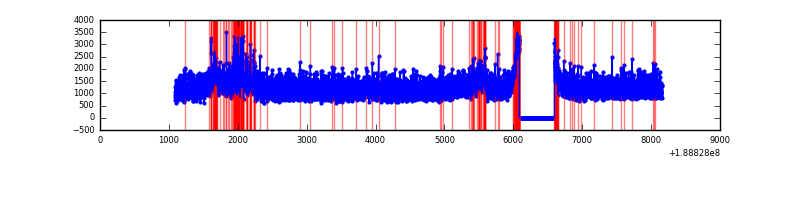 |
| D | 7063 | 6553 | 410 | 410 | 5.80% | 6.26% | 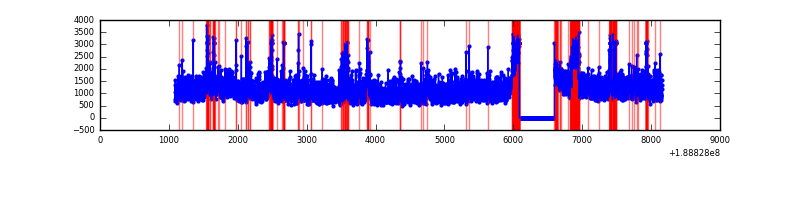 |
Top three noisy pixels from each quadrant. If the there are fewer than three noisy pixels in the level2.evt file, extra rows are filled as -1
| Pixel properties | Quadrant properties | ||||||
|---|---|---|---|---|---|---|---|
| Quadrant | DetID | PixID | Counts | Sigma | Mean | Median | Sigma |
| A | 4 | 32 | 243990 | 494.42 | 2020 | 2035 | 489.4 |
| A | 15 | 127 | 29543 | 56.21 | 2020 | 2035 | 489.4 |
| A | 8 | 14 | 24424 | 45.75 | 2020 | 2035 | 489.4 |
| B | 8 | 4 | 356947 | 714.73 | 2080 | 2090 | 496.5 |
| B | 6 | 53 | 95633 | 188.41 | 2080 | 2090 | 496.5 |
| B | 12 | 52 | 66322 | 129.37 | 2080 | 2090 | 496.5 |
| C | 8 | 208 | 395625 | 738.85 | 1900 | 1965 | 532.8 |
| C | 15 | 241 | 325648 | 607.51 | 1900 | 1965 | 532.8 |
| C | 3 | 9 | 50617 | 91.31 | 1900 | 1965 | 532.8 |
| D | 2 | 33 | 274321 | 473.84 | 1847 | 1919 | 574.9 |
| D | 1 | 83 | 194221 | 334.5 | 1847 | 1919 | 574.9 |
| D | 13 | 169 | 193678 | 333.56 | 1847 | 1919 | 574.9 |
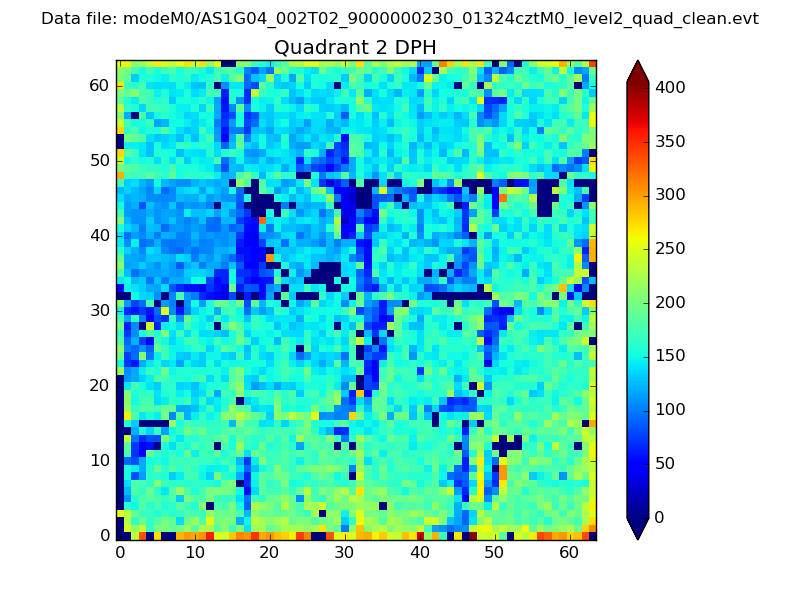
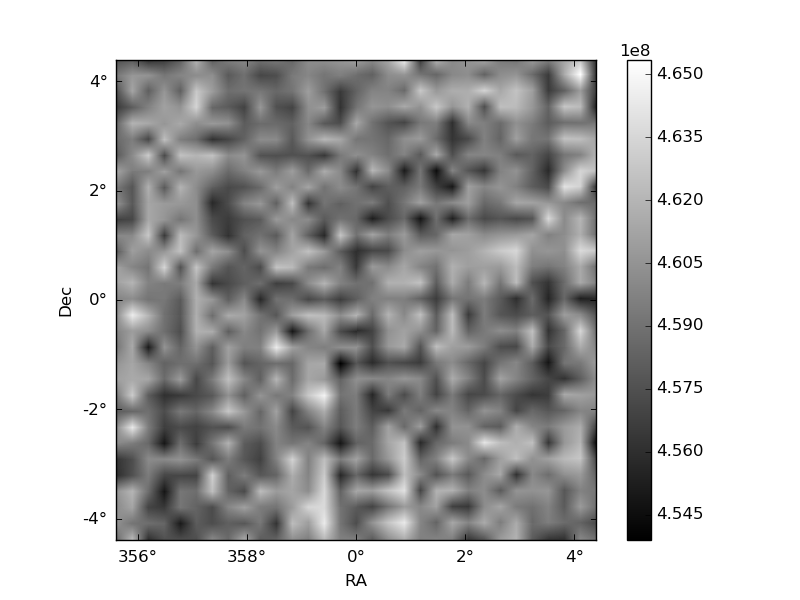
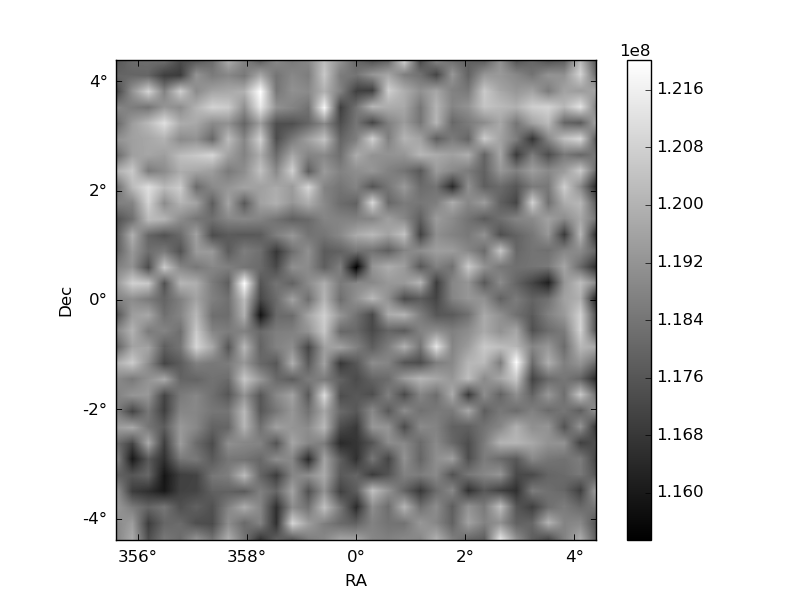
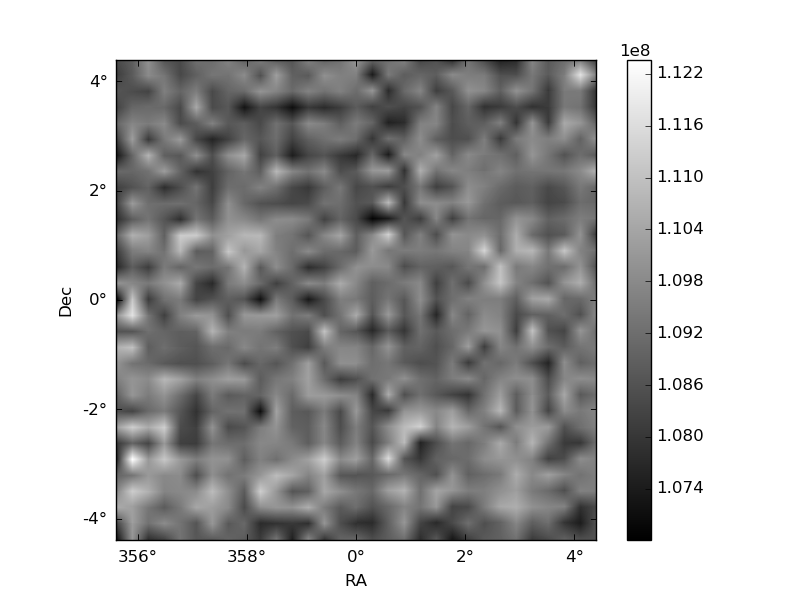
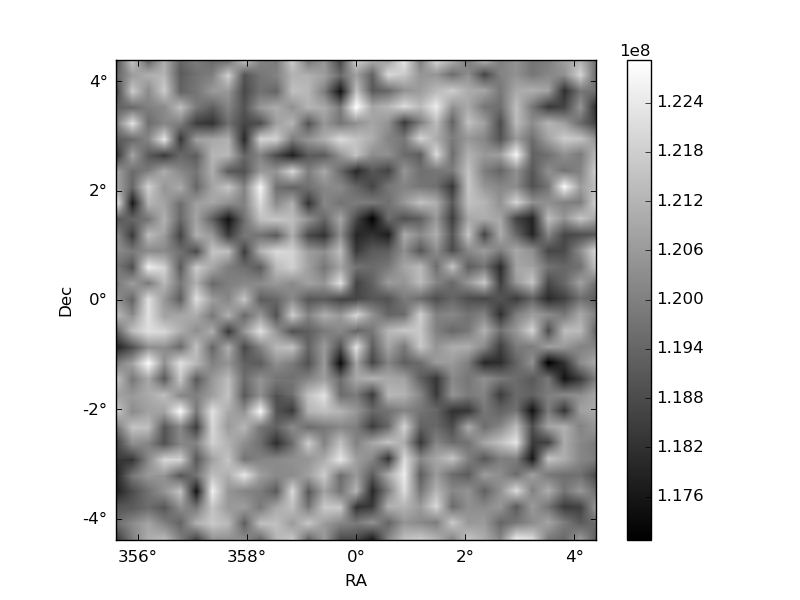
Histogram calculated using DETX and DETY for each event in the final _common_clean file
| Quadrant A | 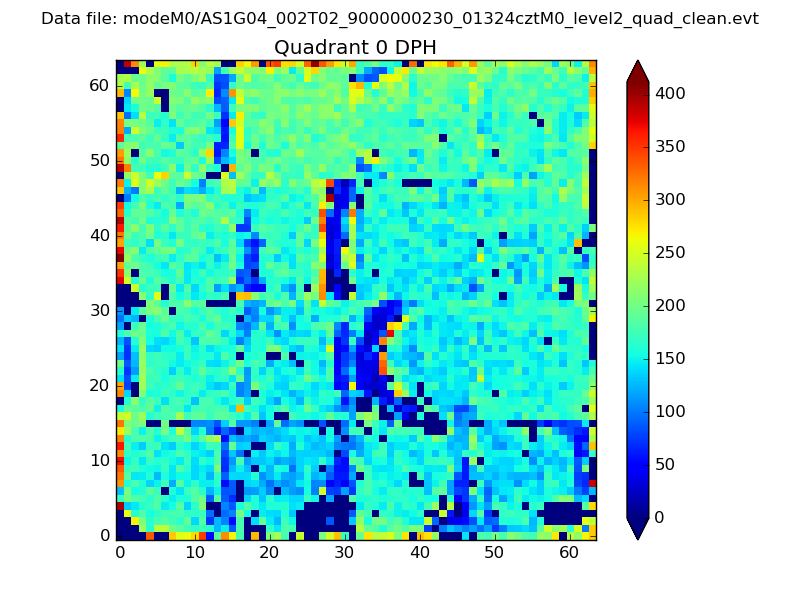 |
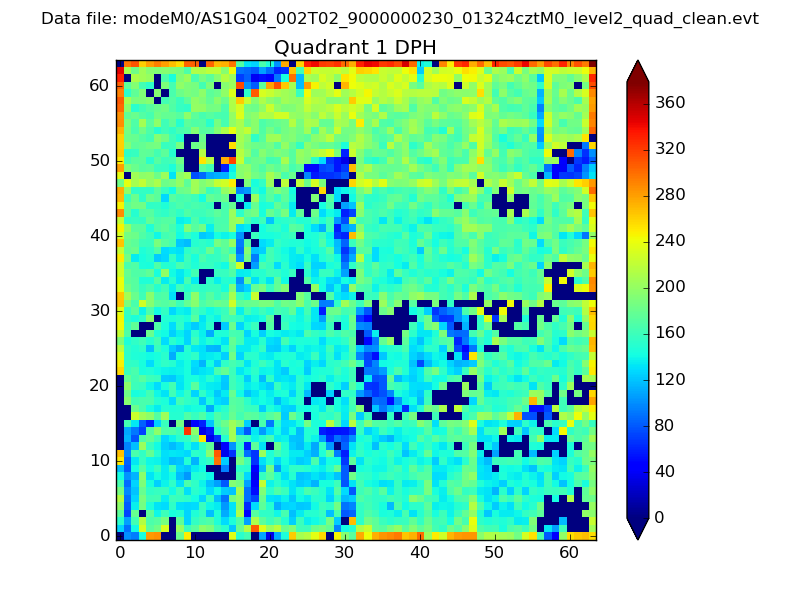 |
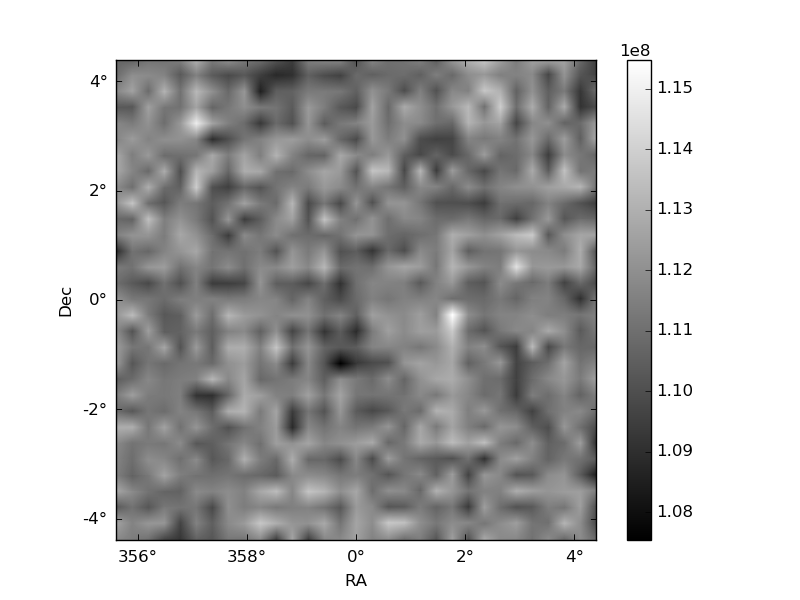
Quadrant B |
|---|---|---|---|
| Quadrant D | 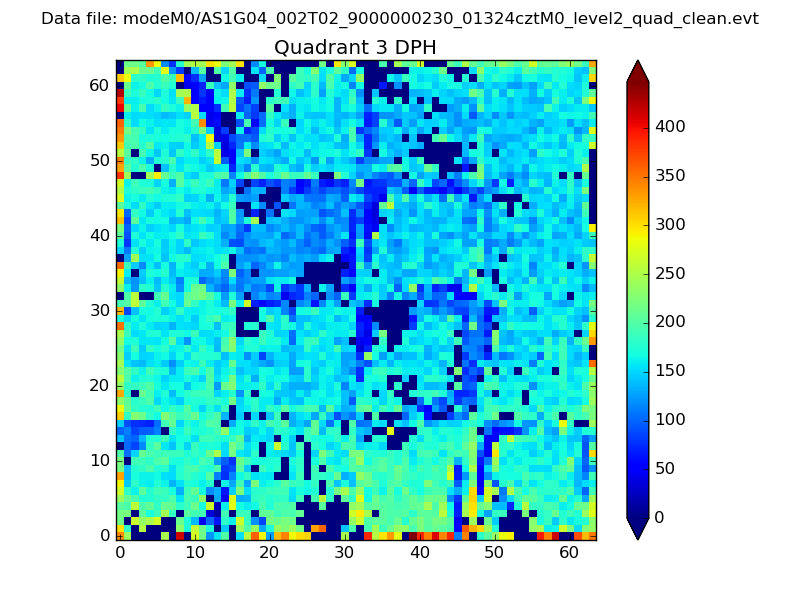 |
 |
Quadrant C |
| Plot type | Count rate plots | Images |
|---|---|---|
| Comparison with Poisson distribution Blue bars denote a histogram of data divided into 1 sec bins. Red curve is a Poisson curve with rate = median count rate of data. |
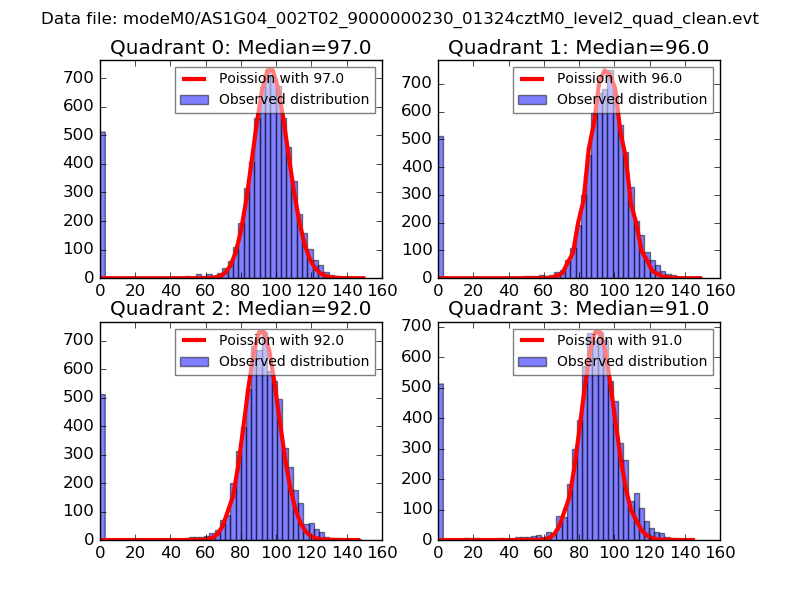 |
 |
| Quadrant-wise count rates Data is divided into 100 sec bins |
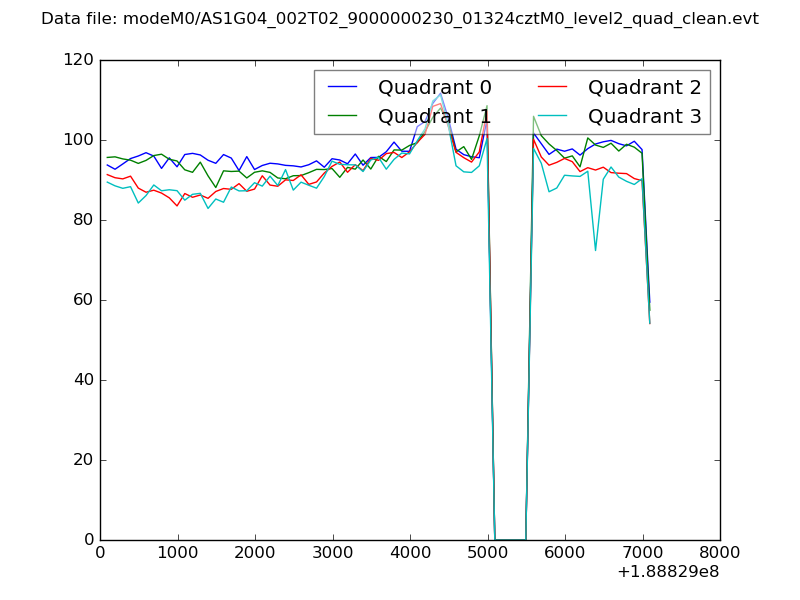 |
|
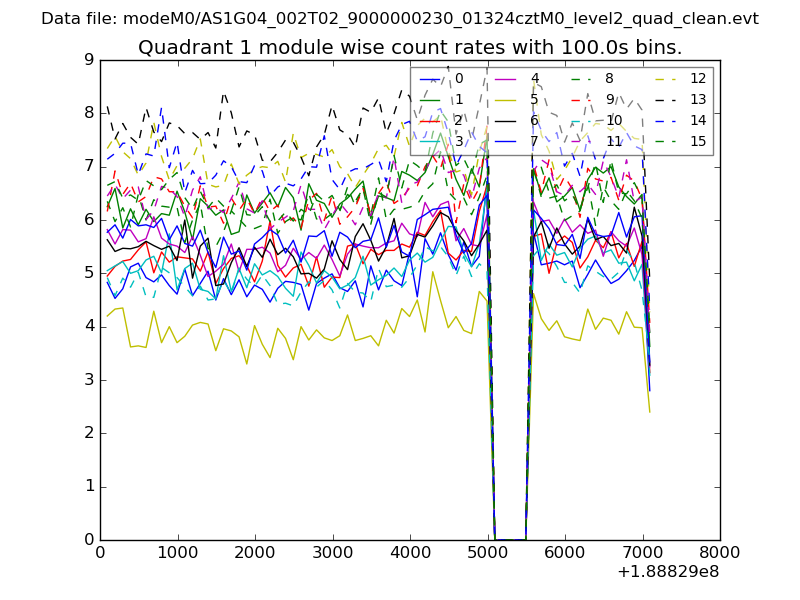
| Module-wise count rates for Quadrant A Data is divided into 100 sec bins |
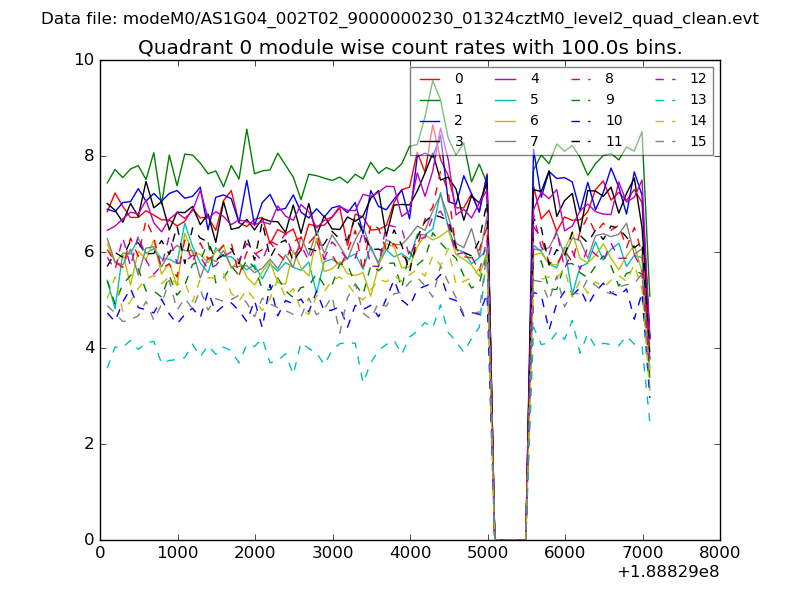 |
 |
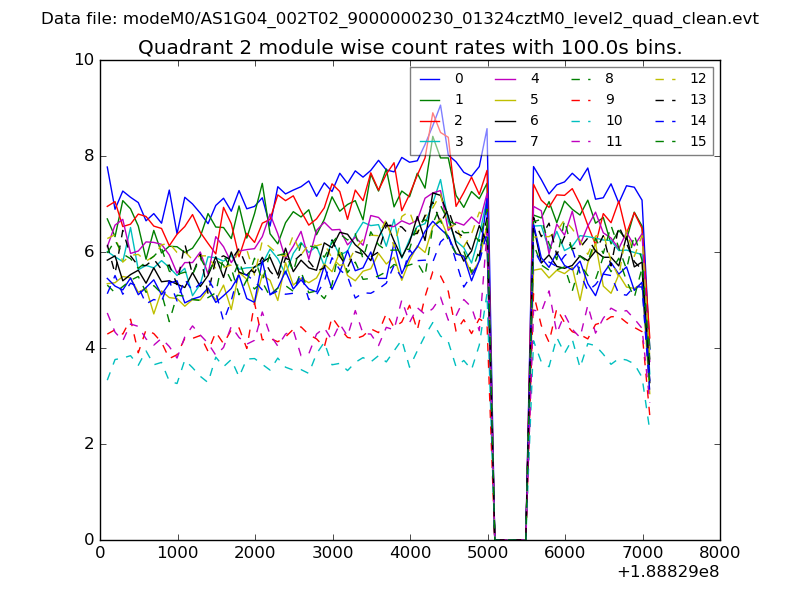
| Module-wise count rates for Quadrant B Data is divided into 100 sec bins |
 |
 |
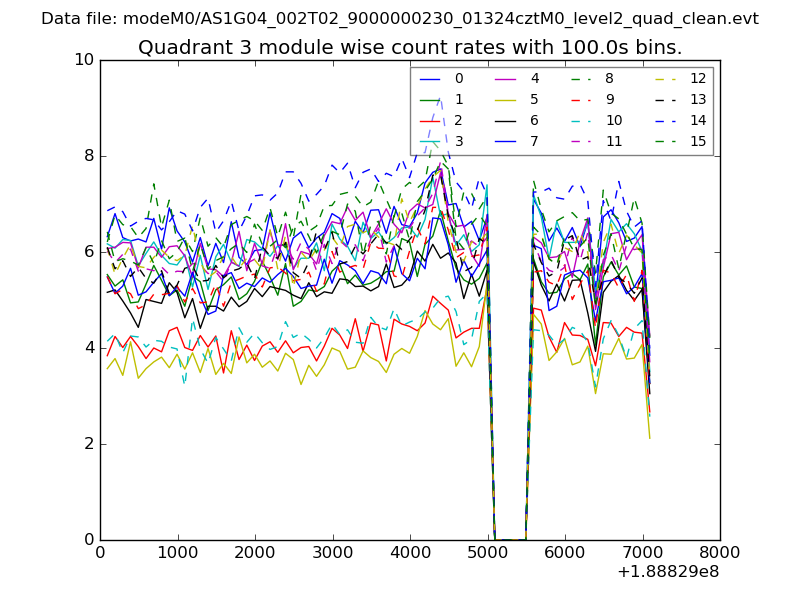
| Module-wise count rates for Quadrant C Data is divided into 100 sec bins |
 |
 |
| Module-wise count rates for Quadrant D Data is divided into 100 sec bins |
 |
 |
| Parameter | Plot |
|---|---|
| CZT HV Monitor | 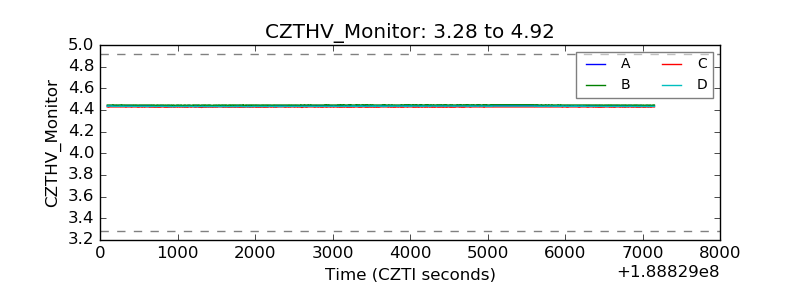 |
| D_VDD | 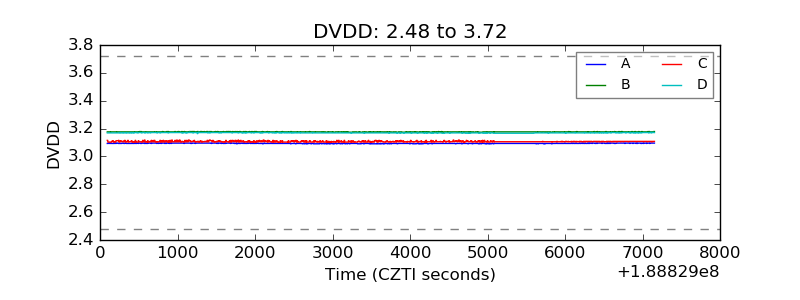 |
| Temperature 1 | 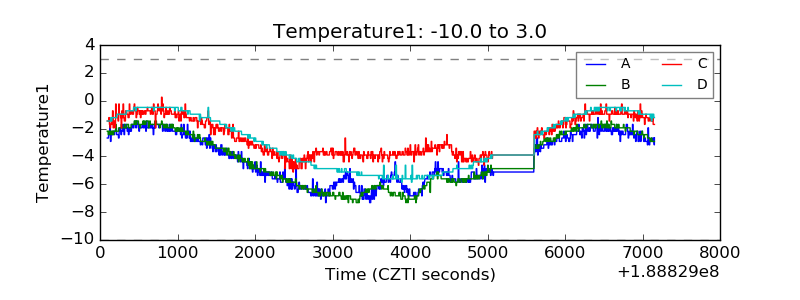 |
| Veto HV Monitor | 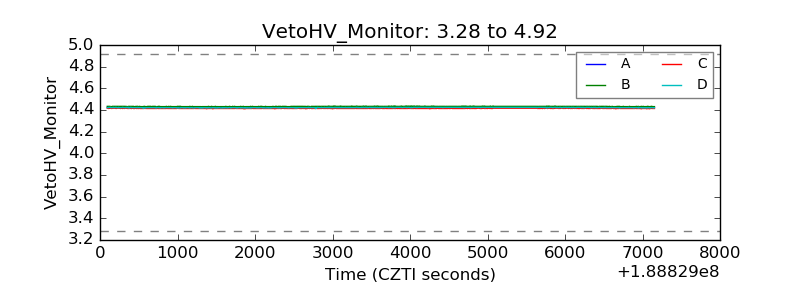 |
| Veto LLD | 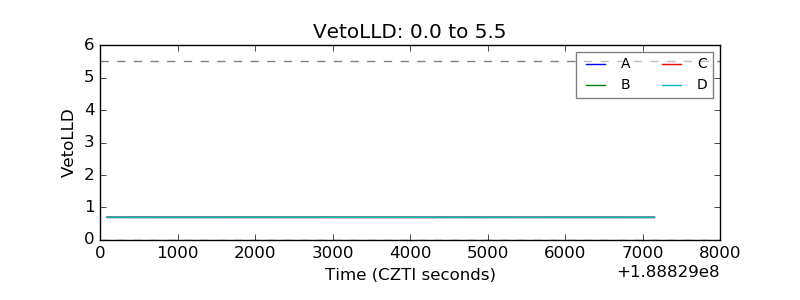 |
| Alpha Counter | 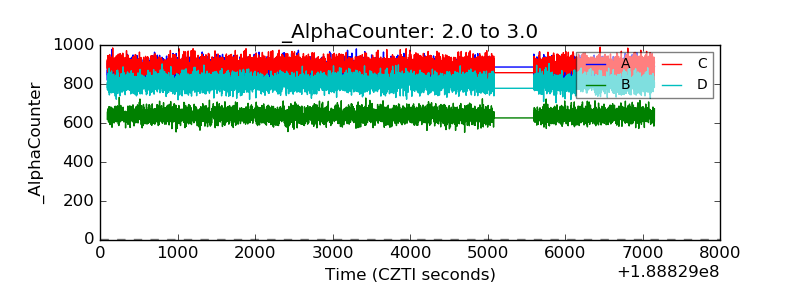 |
| _CPM_Rate | 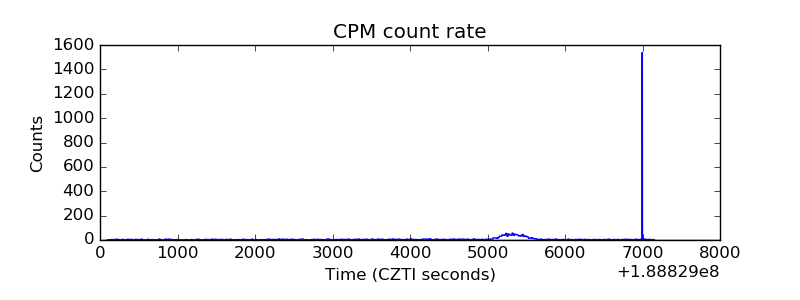 |
| CZT Counter | 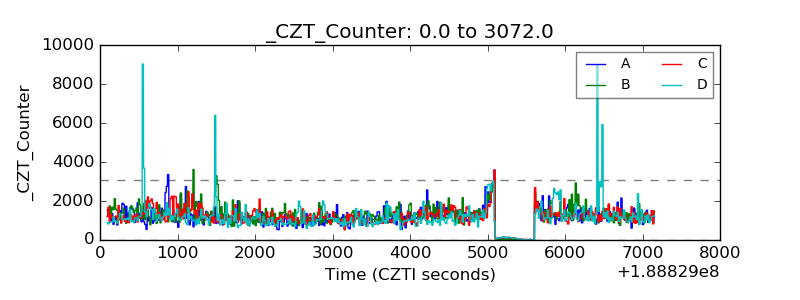 |
| +2.5 Volts monitor |  |
| +5 Volts monitor | 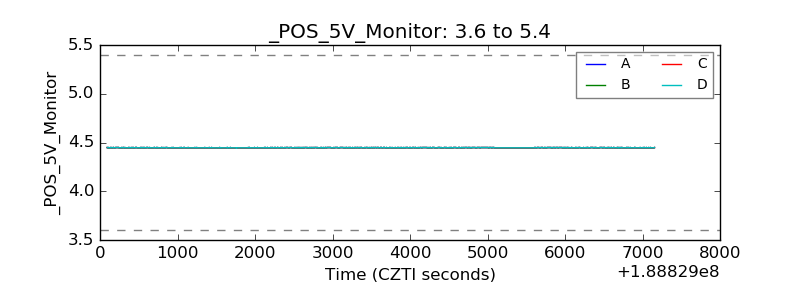 |
| _ROLL_ROT | 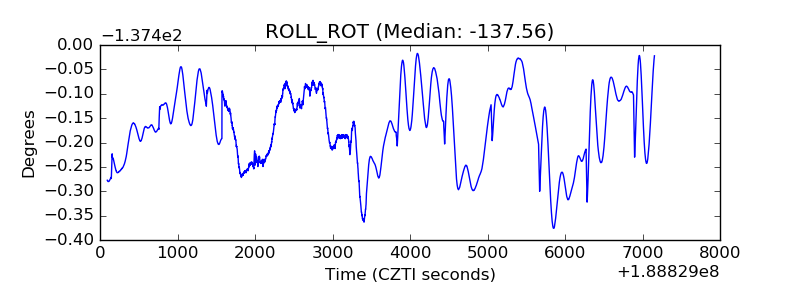 |
| _Roll_DEC | 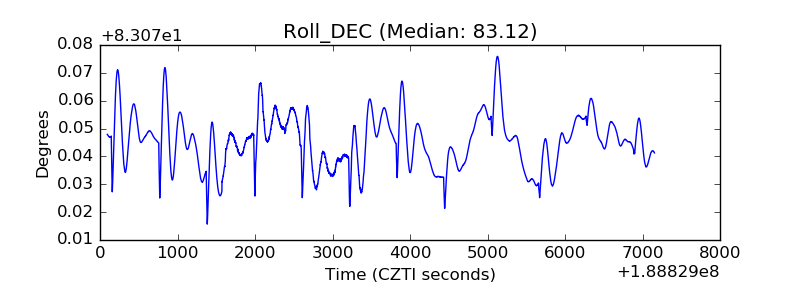 |
| _Roll_RA | 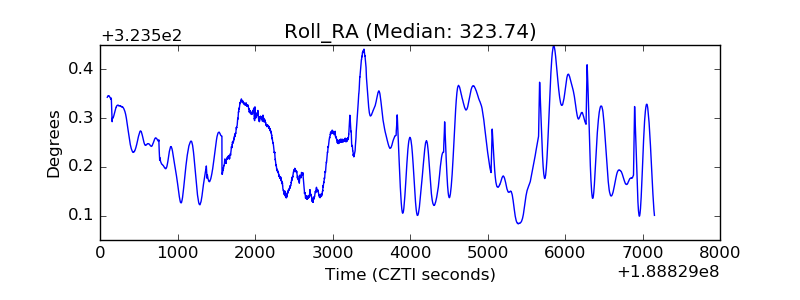 |
| Veto Counter | 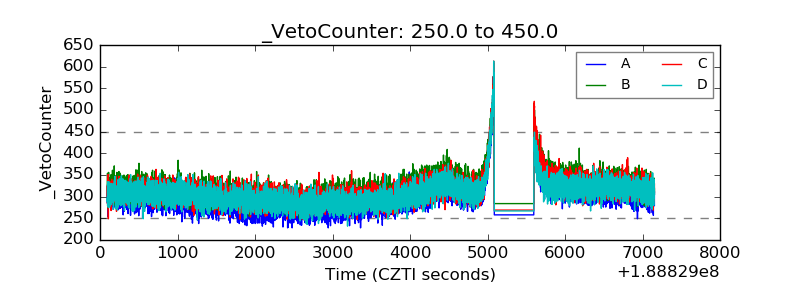 |