| Param | Original file | Final file |
|---|---|---|
| Filename | modeM0/AS1G04_002T02_9000000230_01325cztM0_level2.evt | modeM0/AS1G04_002T02_9000000230_01325cztM0_level2_quad_clean.evt |
| Size (bytes) | 1,127,891,520 | 101,828,160 |
| Size | 1.1 GB | 97.1 MB |
| Events in quadrant A | 8,478,605 | 667,666 |
| Events in quadrant B | 8,987,072 | 660,744 |
| Events in quadrant C | 8,328,916 | 643,604 |
| Events in quadrant D | 7,909,785 | 634,051 |
| Mode M9 | |||
|---|---|---|---|
| Quadrant | BADHDUFLAG | Total packets | Discarded packets |
| A | 0 | 7 | 0 |
| B | 0 | 7 | 0 |
| C | 0 | 7 | 0 |
| D | 0 | 7 | 0 |
| Mode M0 | |||
|---|---|---|---|
| Quadrant | BADHDUFLAG | Total packets | Discarded packets |
| A | 0 | 30061 | 2 |
| B | 0 | 31554 | 1 |
| C | 0 | 29572 | 1 |
| D | 0 | 28378 | 1 |
| Mode SS | |||
|---|---|---|---|
| Quadrant | BADHDUFLAG | Total packets | Discarded packets |
| A | 0 | 140 | 0 |
| B | 0 | 140 | 0 |
| C | 0 | 140 | 0 |
| D | 0 | 140 | 0 |
| Quadrant | Total seconds | Saturated seconds | Saturation percentage |
|---|---|---|---|
| A | 6854 | 11 | 0.160490% |
| B | 6854 | 51 | 0.744091% |
| C | 6854 | 26 | 0.379341% |
| D | 6854 | 71 | 1.035891% |
Noise dominated data is calculated using 1-second bins in cleaned event files. If a bin has >2000 counts, and if more than 50% of those come from <1% of pixels, then it is considered to be noise-dominated and hence unusable.
| Quadrant | # 1 sec bins | Bins with >0 counts | Bins with >2000 counts | High rate bins dominated by noise | Noise dominated (total time) | Noise dominated (detector-on time) | Marked lightcurve |
|---|---|---|---|---|---|---|---|
| A | 7549 | 6854 | 202 | 202 | 2.68% | 2.95% | 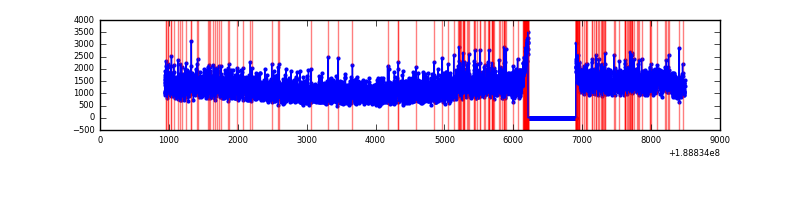 |
| B | 7549 | 6855 | 416 | 416 | 5.51% | 6.07% | 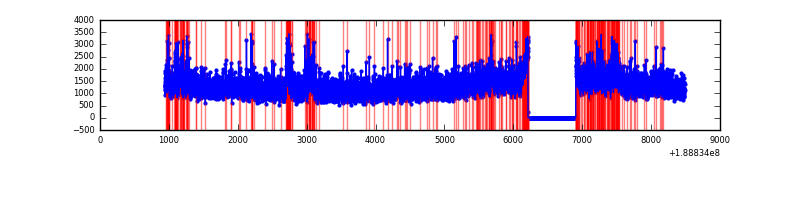 |
| C | 7549 | 6855 | 155 | 155 | 2.05% | 2.26% | 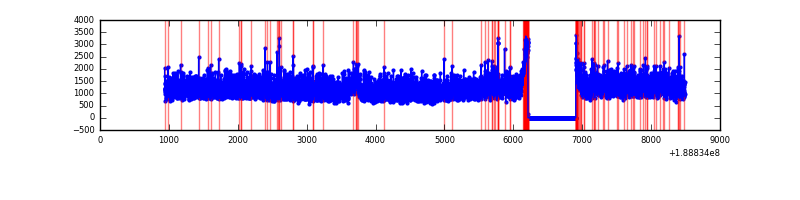 |
| D | 7549 | 6854 | 266 | 266 | 3.52% | 3.88% | 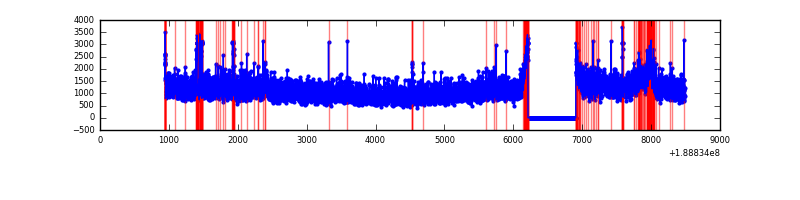 |
Top three noisy pixels from each quadrant. If the there are fewer than three noisy pixels in the level2.evt file, extra rows are filled as -1
| Pixel properties | Quadrant properties | ||||||
|---|---|---|---|---|---|---|---|
| Quadrant | DetID | PixID | Counts | Sigma | Mean | Median | Sigma |
| A | 8 | 14 | 135302 | 261.33 | 2108 | 2120 | 509.6 |
| A | 4 | 32 | 99599 | 191.28 | 2108 | 2120 | 509.6 |
| A | 14 | 5 | 61846 | 117.2 | 2108 | 2120 | 509.6 |
| B | 8 | 4 | 441290 | 854.3 | 2183 | 2189 | 514.0 |
| B | 5 | 249 | 94298 | 179.2 | 2183 | 2189 | 514.0 |
| B | 6 | 53 | 45825 | 84.9 | 2183 | 2189 | 514.0 |
| C | 15 | 241 | 339908 | 604.11 | 2005 | 2082 | 559.2 |
| C | 3 | 9 | 72946 | 126.72 | 2005 | 2082 | 559.2 |
| C | 3 | 79 | 27678 | 45.77 | 2005 | 2082 | 559.2 |
| D | 10 | 84 | 238969 | 390.84 | 1951 | 2016 | 606.3 |
| D | 1 | 83 | 113215 | 183.41 | 1951 | 2016 | 606.3 |
| D | 2 | 33 | 101940 | 164.82 | 1951 | 2016 | 606.3 |
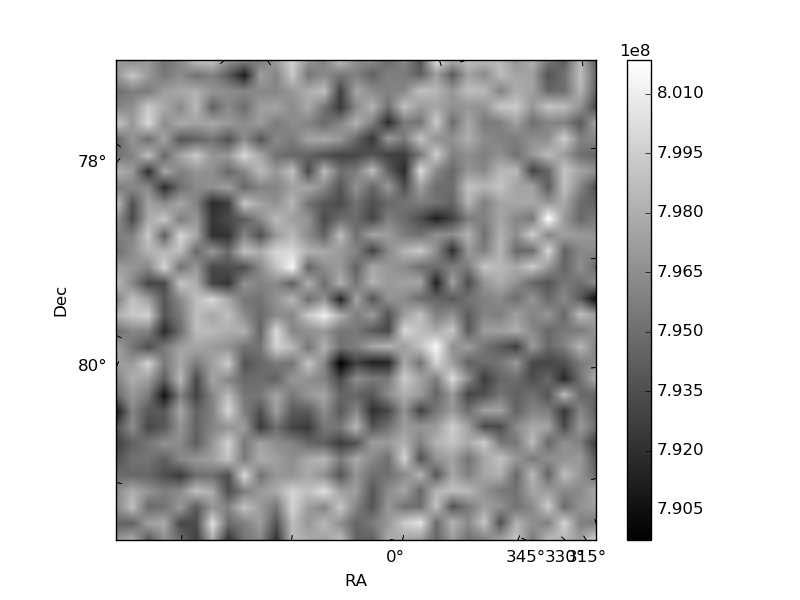
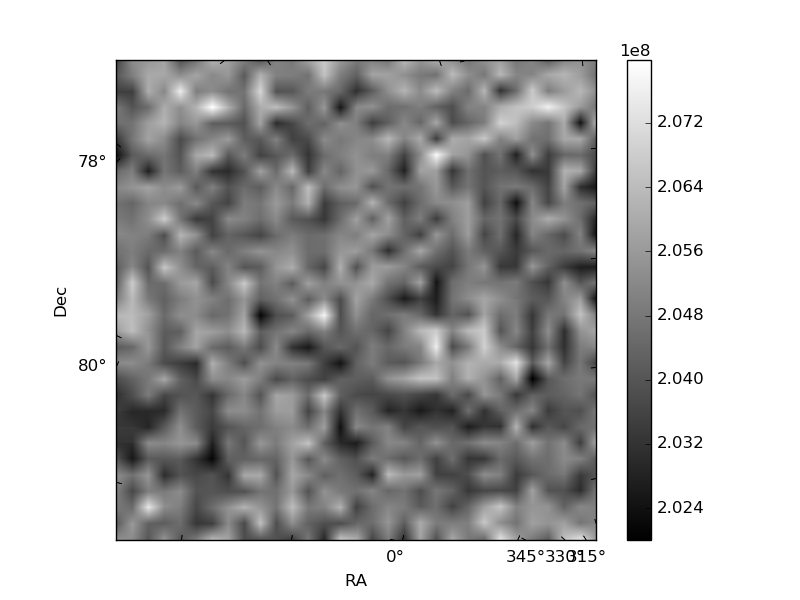
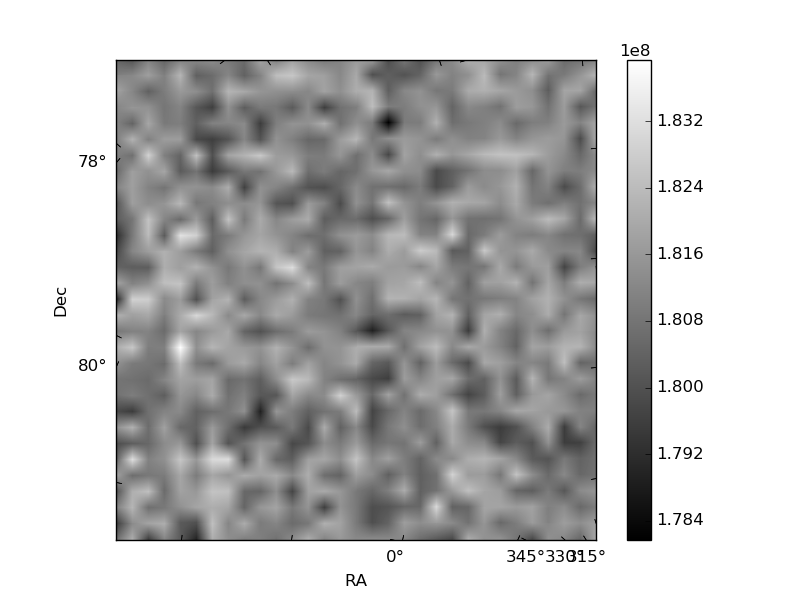
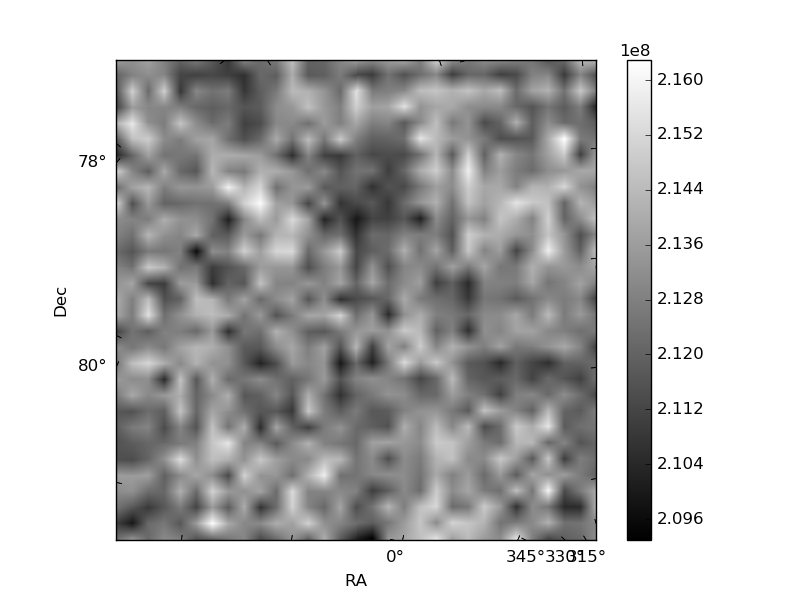
Histogram calculated using DETX and DETY for each event in the final _common_clean file
| Quadrant A | 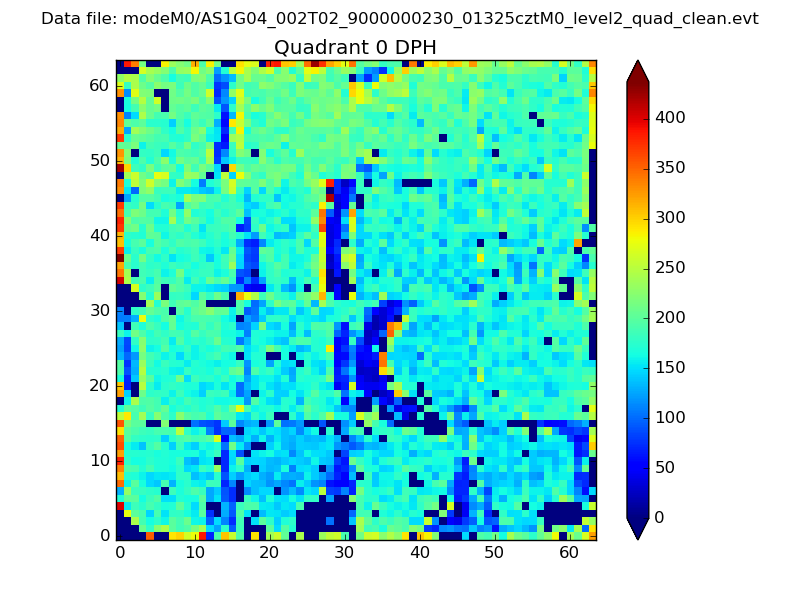 |
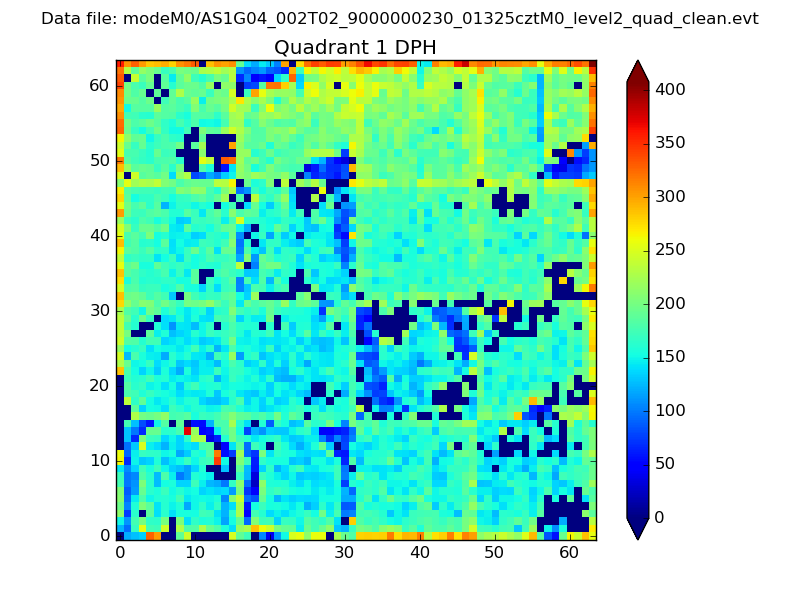 |
Quadrant B |
|---|---|---|---|
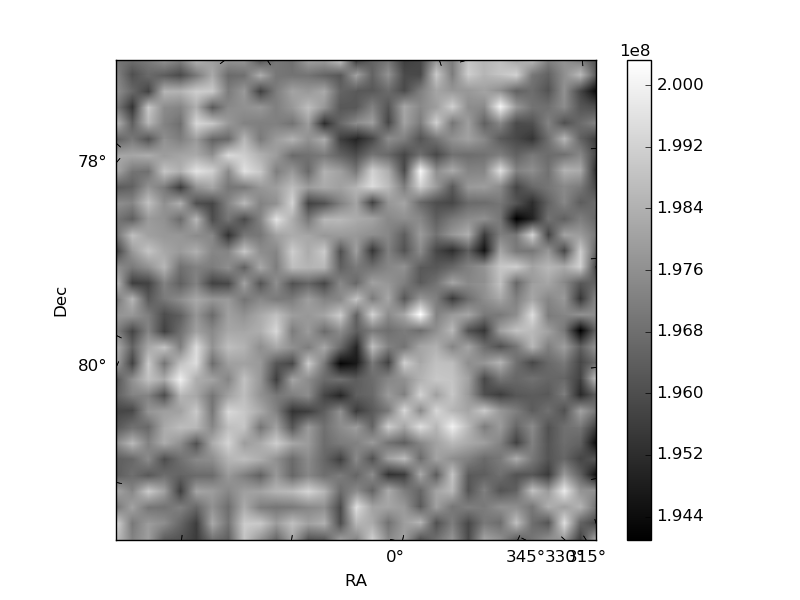
| Quadrant D | 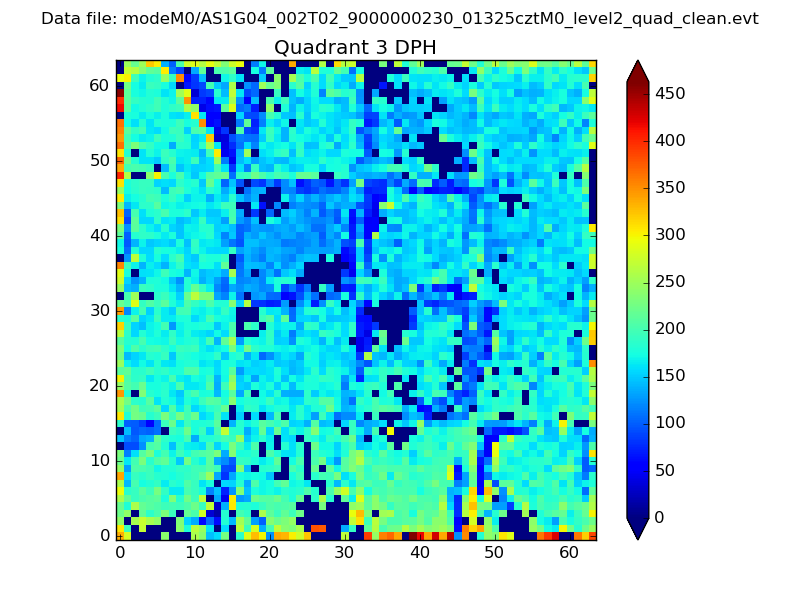 |
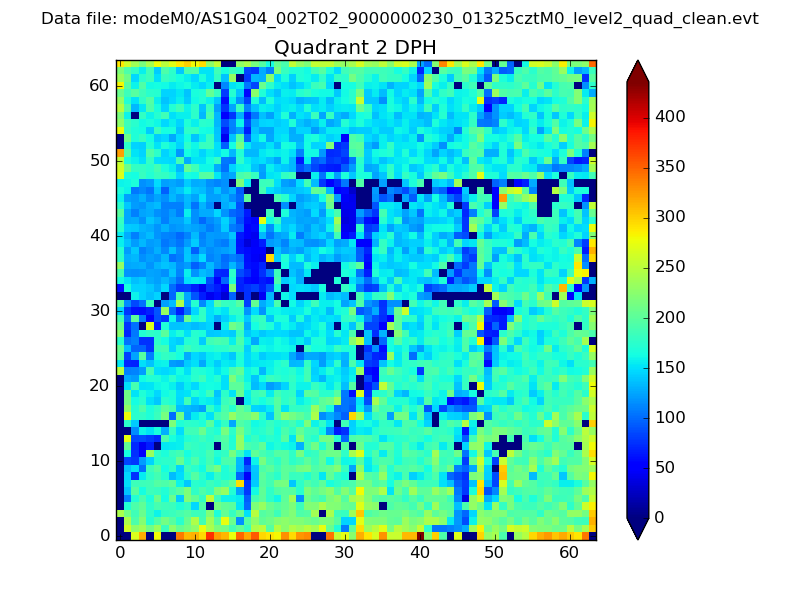 |
Quadrant C |
| Plot type | Count rate plots | Images |
|---|---|---|
| Comparison with Poisson distribution Blue bars denote a histogram of data divided into 1 sec bins. Red curve is a Poisson curve with rate = median count rate of data. |
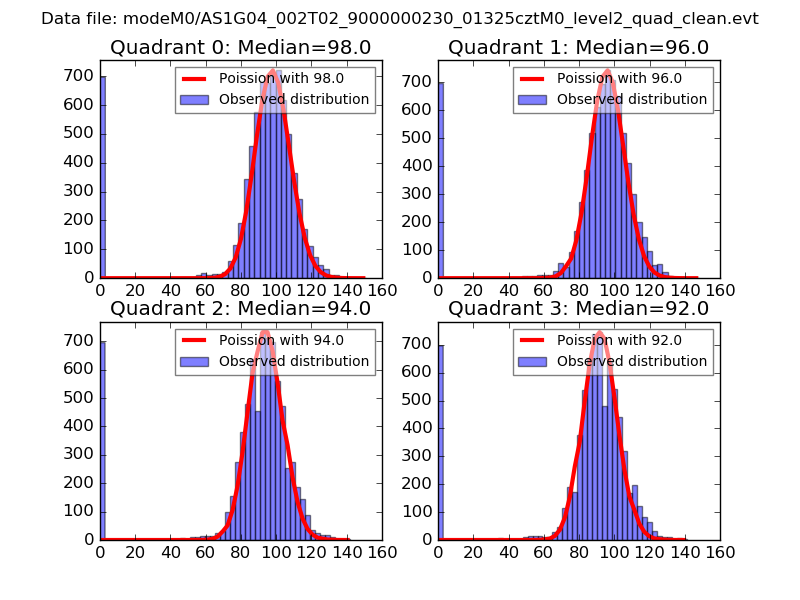 |
 |
| Quadrant-wise count rates Data is divided into 100 sec bins |
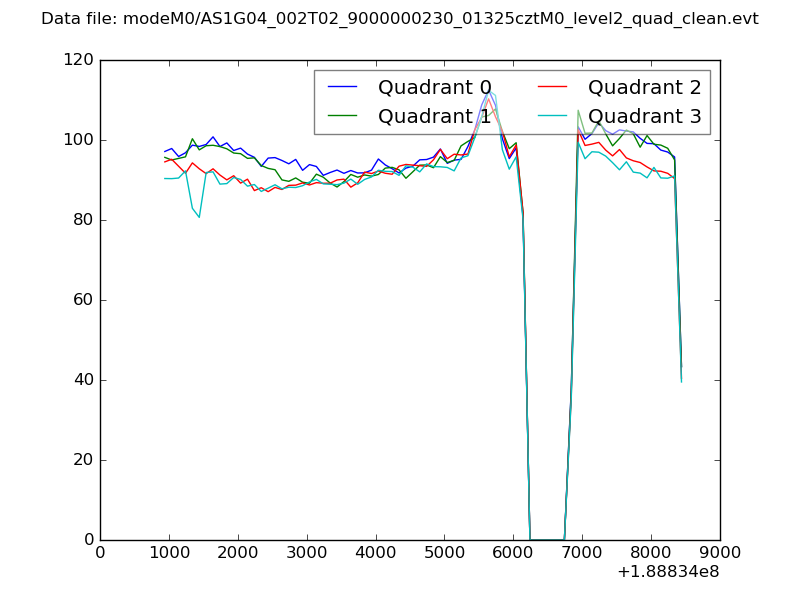 |
|
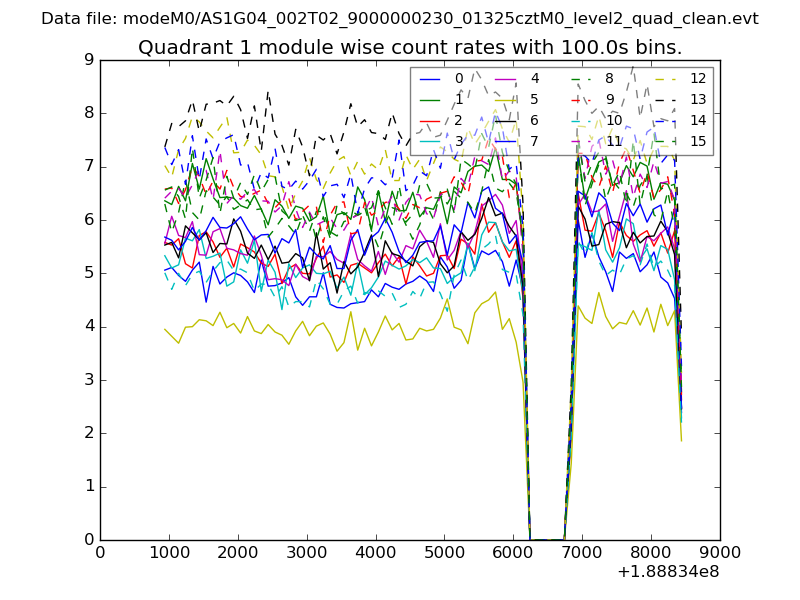
| Module-wise count rates for Quadrant A Data is divided into 100 sec bins |
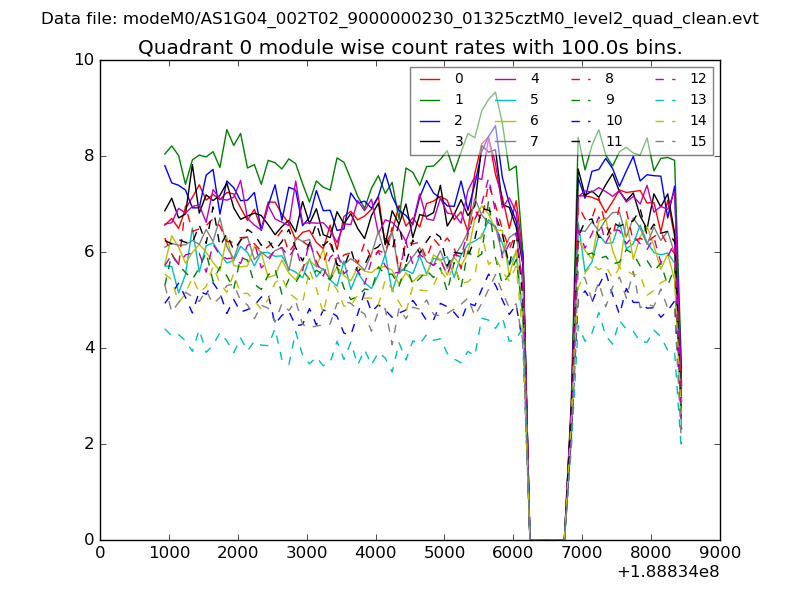 |
 |
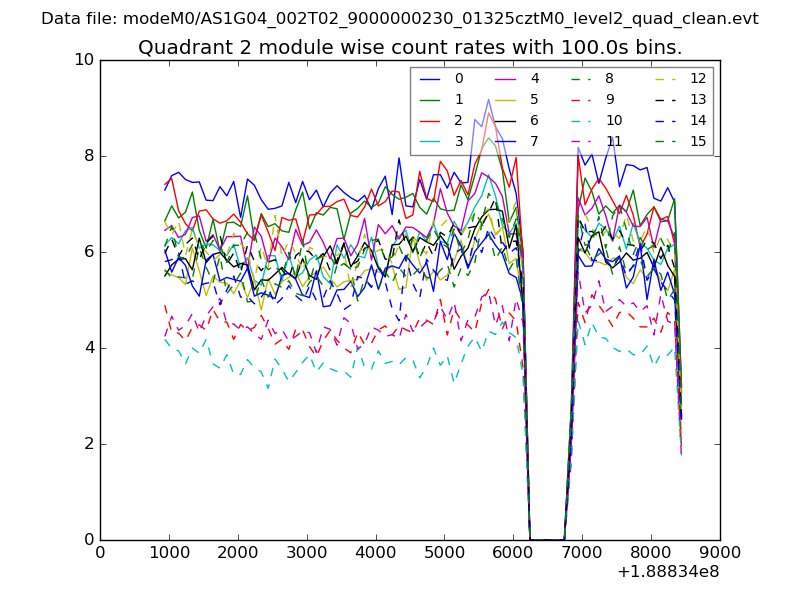
| Module-wise count rates for Quadrant B Data is divided into 100 sec bins |
 |
 |
| Module-wise count rates for Quadrant C Data is divided into 100 sec bins |
 |
 |
| Module-wise count rates for Quadrant D Data is divided into 100 sec bins |
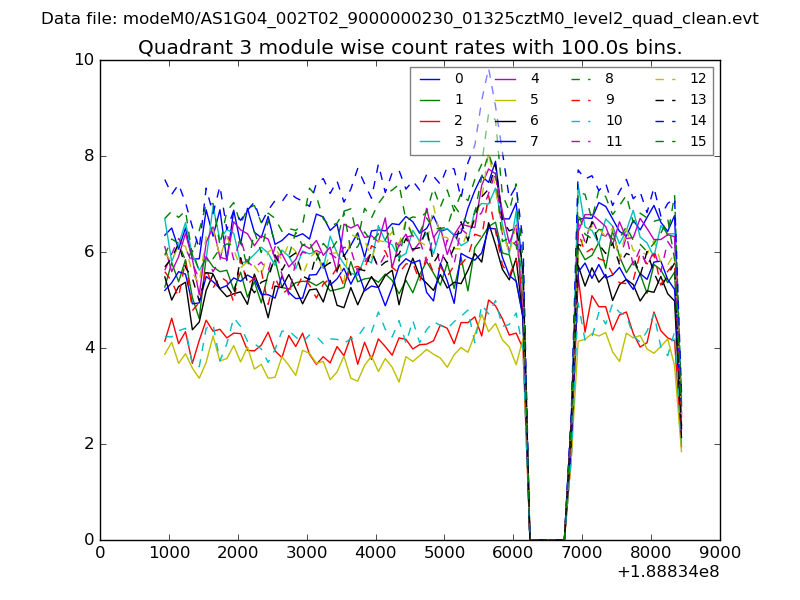 |
 |
| Parameter | Plot |
|---|---|
| CZT HV Monitor | 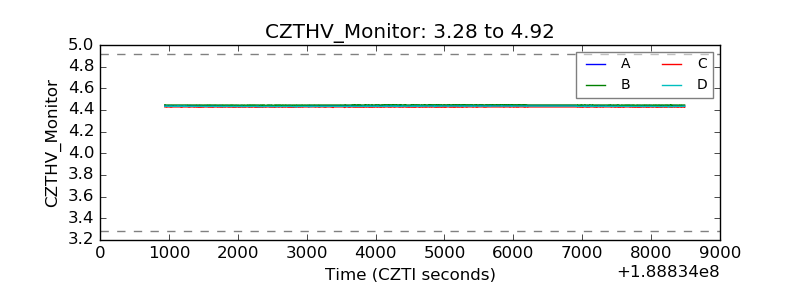 |
| D_VDD | 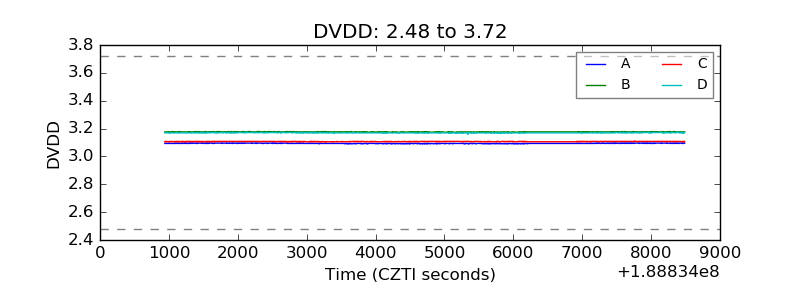 |
| Temperature 1 | 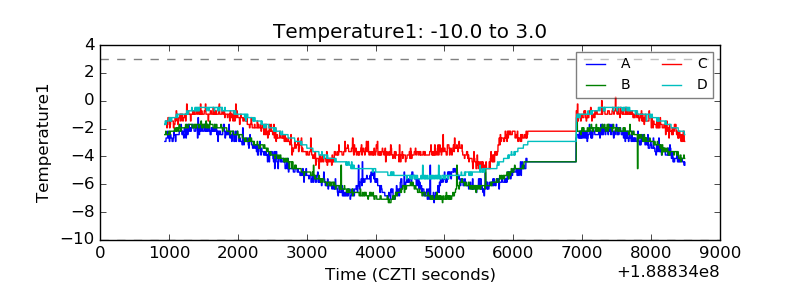 |
| Veto HV Monitor | 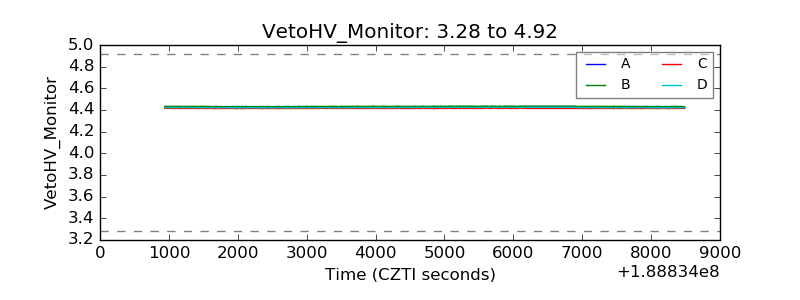 |
| Veto LLD | 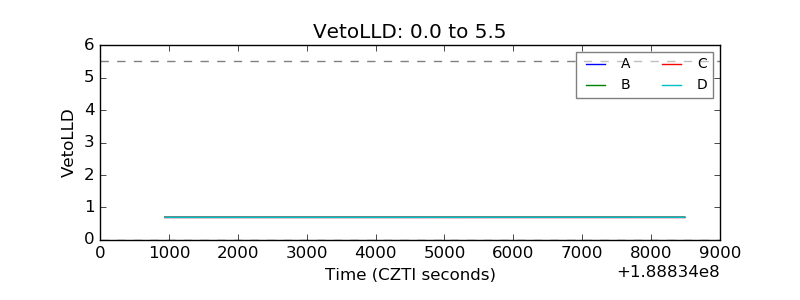 |
| Alpha Counter | 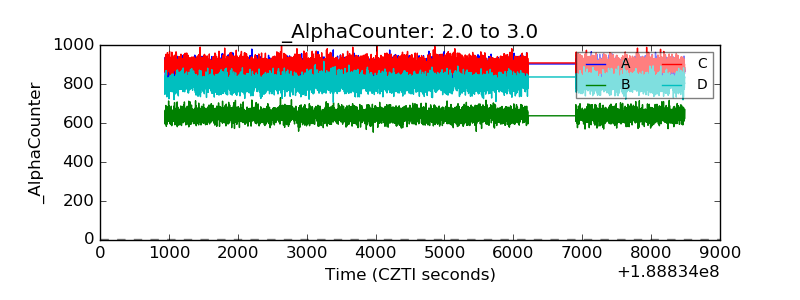 |
| _CPM_Rate | 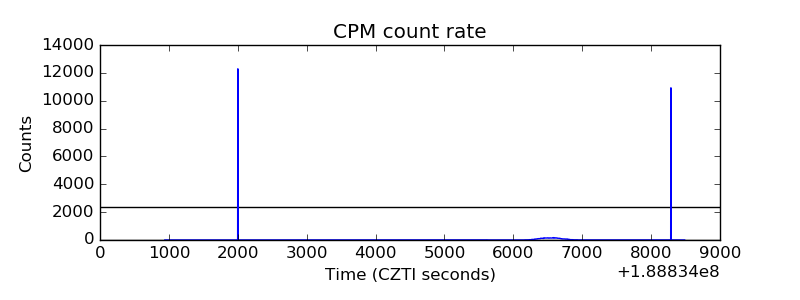 |
| CZT Counter | 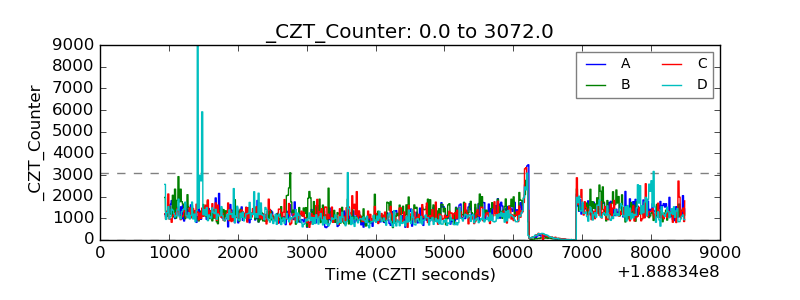 |
| +2.5 Volts monitor |  |
| +5 Volts monitor |  |
| _ROLL_ROT | 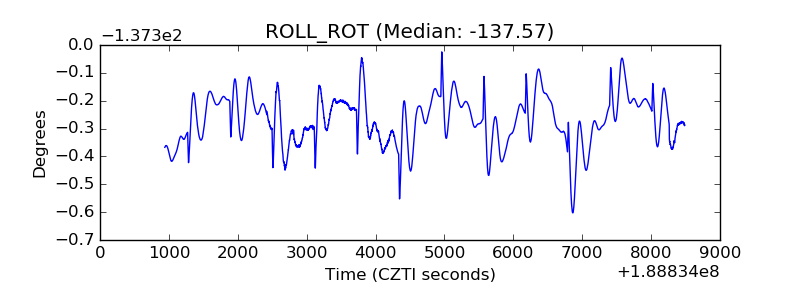 |
| _Roll_DEC | 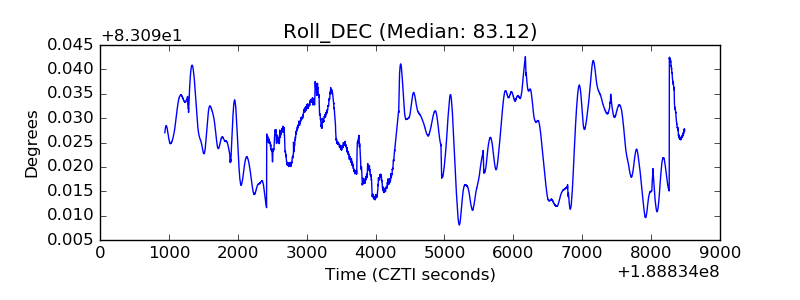 |
| _Roll_RA | 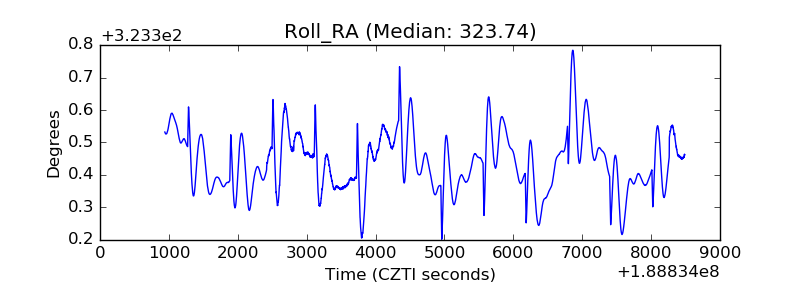 |
| Veto Counter | 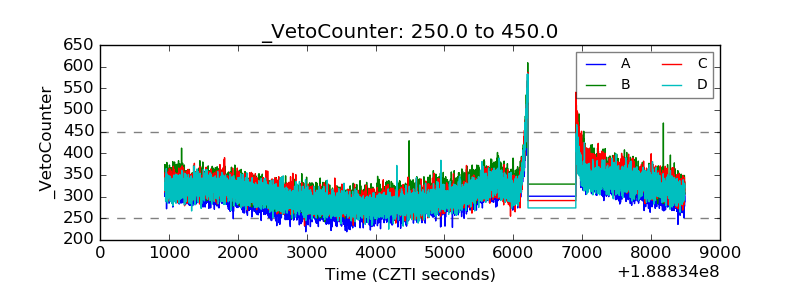 |