| Param | Original file | Final file |
|---|---|---|
| Filename | modeM0/AS1G04_002T02_9000000230_01327cztM0_level2.evt | modeM0/AS1G04_002T02_9000000230_01327cztM0_level2_quad_clean.evt |
| Size (bytes) | 1,032,837,120 | 96,154,560 |
| Size | 985.0 MB | 91.7 MB |
| Events in quadrant A | 7,461,502 | 629,209 |
| Events in quadrant B | 8,710,787 | 621,298 |
| Events in quadrant C | 7,552,224 | 615,515 |
| Events in quadrant D | 7,139,725 | 608,484 |
| Mode M9 | |||
|---|---|---|---|
| Quadrant | BADHDUFLAG | Total packets | Discarded packets |
| A | 0 | 10 | 0 |
| B | 0 | 10 | 0 |
| C | 0 | 10 | 0 |
| D | 0 | 10 | 0 |
| Mode M0 | |||
|---|---|---|---|
| Quadrant | BADHDUFLAG | Total packets | Discarded packets |
| A | 0 | 26658 | 2 |
| B | 0 | 30269 | 1 |
| C | 0 | 26820 | 1 |
| D | 0 | 25722 | 1 |
| Mode SS | |||
|---|---|---|---|
| Quadrant | BADHDUFLAG | Total packets | Discarded packets |
| A | 0 | 128 | 0 |
| B | 0 | 128 | 0 |
| C | 0 | 128 | 0 |
| D | 0 | 128 | 0 |
| Quadrant | Total seconds | Saturated seconds | Saturation percentage |
|---|---|---|---|
| A | 6265 | 4 | 0.063847% |
| B | 6265 | 54 | 0.861931% |
| C | 6265 | 14 | 0.223464% |
| D | 6265 | 33 | 0.526736% |
Noise dominated data is calculated using 1-second bins in cleaned event files. If a bin has >2000 counts, and if more than 50% of those come from <1% of pixels, then it is considered to be noise-dominated and hence unusable.
| Quadrant | # 1 sec bins | Bins with >0 counts | Bins with >2000 counts | High rate bins dominated by noise | Noise dominated (total time) | Noise dominated (detector-on time) | Marked lightcurve |
|---|---|---|---|---|---|---|---|
| A | 7290 | 6266 | 160 | 160 | 2.19% | 2.55% | 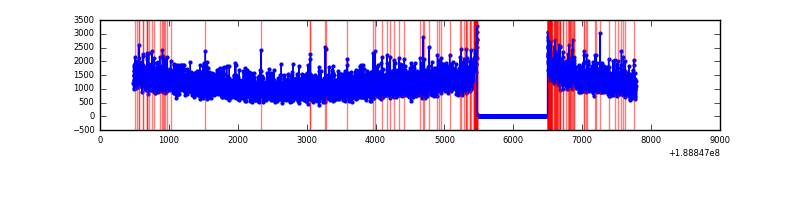 |
| B | 7290 | 6266 | 679 | 679 | 9.31% | 10.84% | 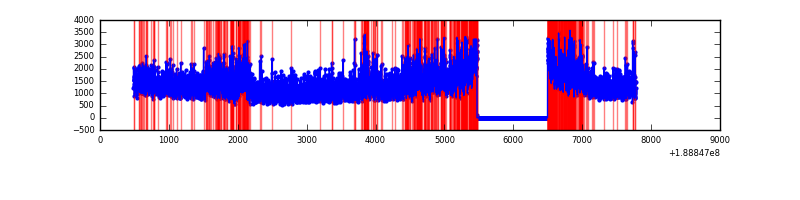 |
| C | 7290 | 6266 | 164 | 164 | 2.25% | 2.62% | 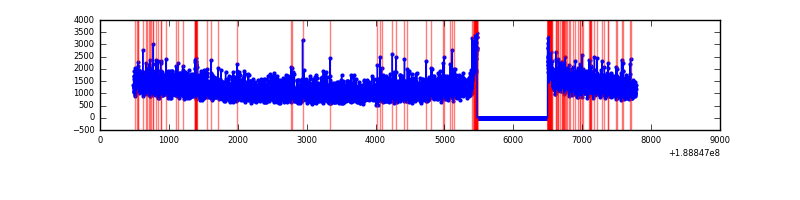 |
| D | 7290 | 6266 | 255 | 255 | 3.50% | 4.07% | 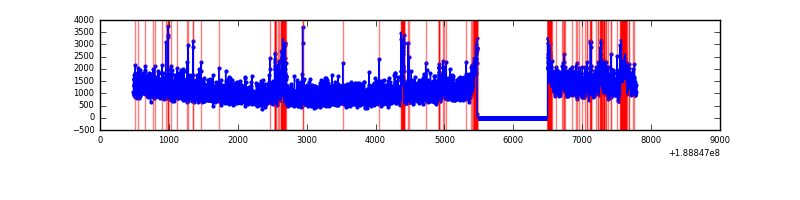 |
Top three noisy pixels from each quadrant. If the there are fewer than three noisy pixels in the level2.evt file, extra rows are filled as -1
| Pixel properties | Quadrant properties | ||||||
|---|---|---|---|---|---|---|---|
| Quadrant | DetID | PixID | Counts | Sigma | Mean | Median | Sigma |
| A | 14 | 5 | 123148 | 267.63 | 1880 | 1892 | 453.1 |
| A | 15 | 127 | 61519 | 131.6 | 1880 | 1892 | 453.1 |
| A | 4 | 32 | 35219 | 73.56 | 1880 | 1892 | 453.1 |
| B | 8 | 4 | 963421 | 2093.36 | 1961 | 1966 | 459.3 |
| B | 6 | 53 | 115189 | 246.52 | 1961 | 1966 | 459.3 |
| B | 5 | 249 | 49223 | 102.89 | 1961 | 1966 | 459.3 |
| C | 15 | 241 | 312441 | 613.41 | 1821 | 1891 | 506.3 |
| C | 3 | 9 | 92316 | 178.61 | 1821 | 1891 | 506.3 |
| C | 3 | 111 | 22033 | 39.79 | 1821 | 1891 | 506.3 |
| D | 10 | 84 | 295023 | 536.19 | 1761 | 1823 | 546.8 |
| D | 1 | 83 | 153148 | 276.73 | 1761 | 1823 | 546.8 |
| D | 10 | 125 | 31519 | 54.31 | 1761 | 1823 | 546.8 |
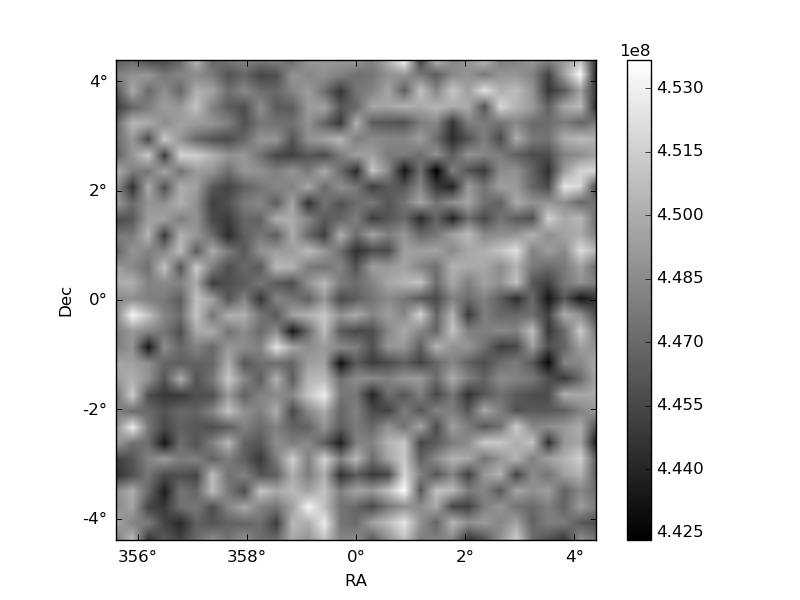
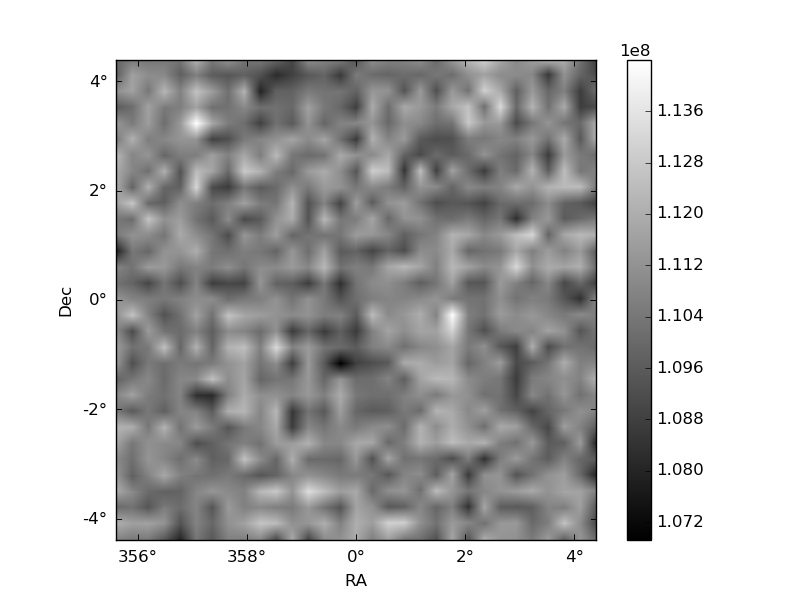
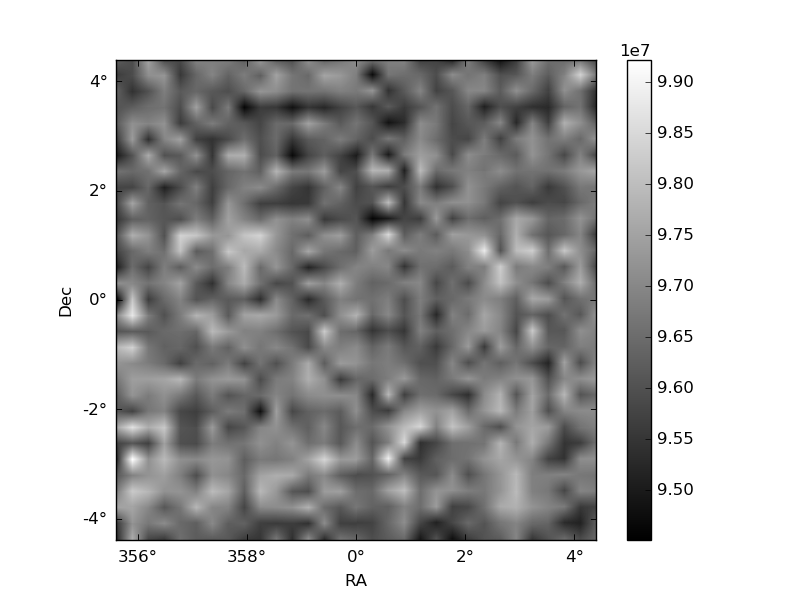
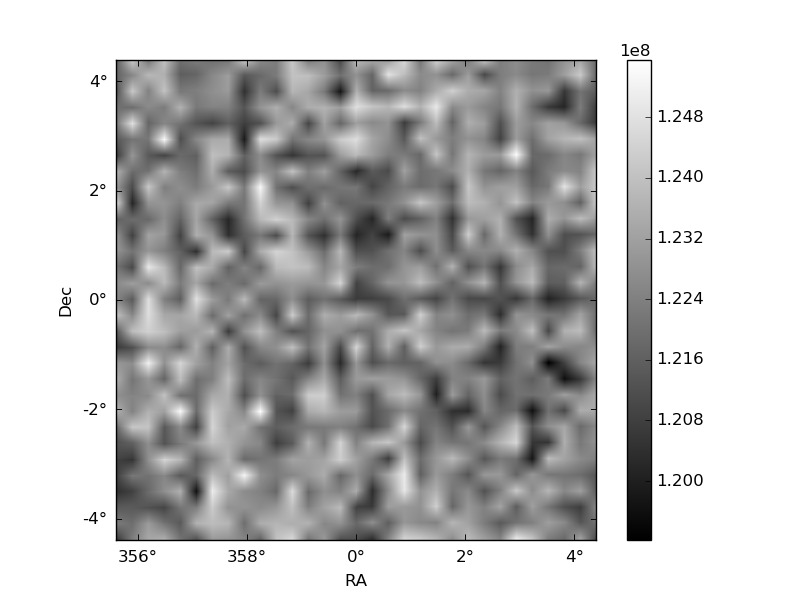
Histogram calculated using DETX and DETY for each event in the final _common_clean file
| Quadrant A | 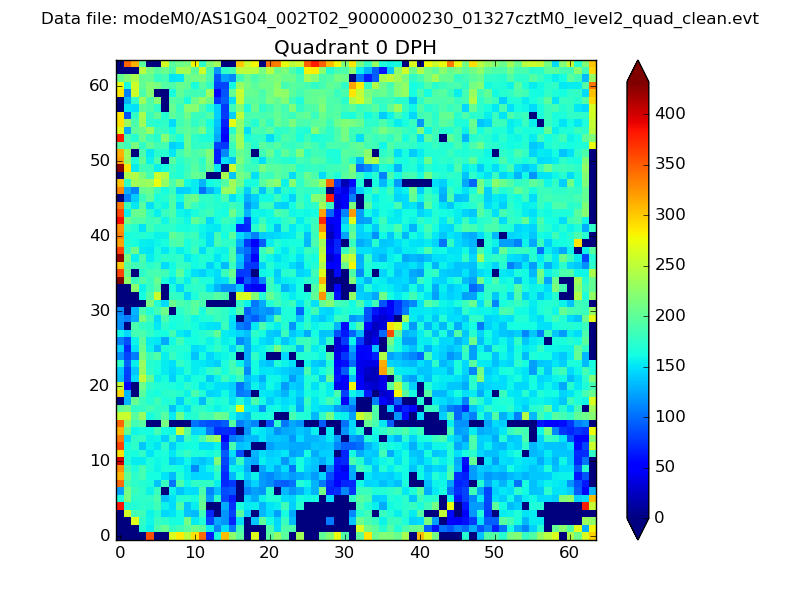 |
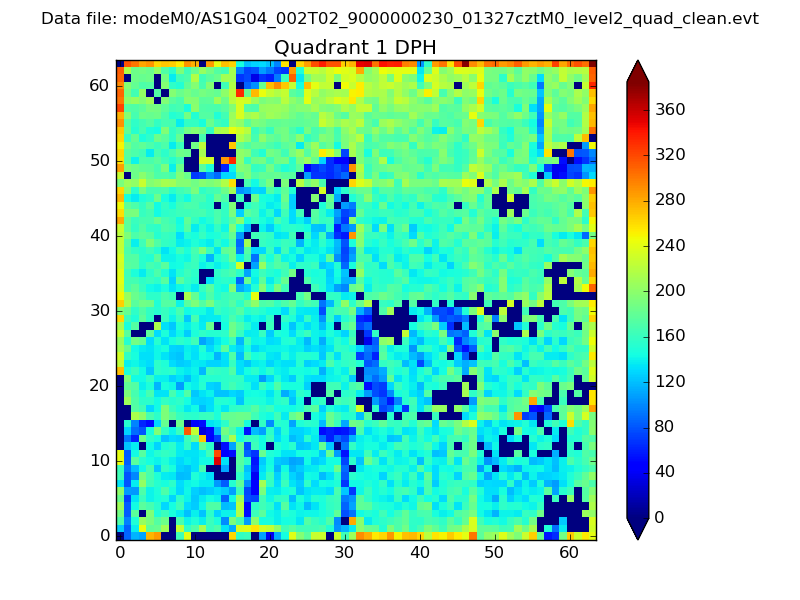 |
Quadrant B |
|---|---|---|---|
| Quadrant D | 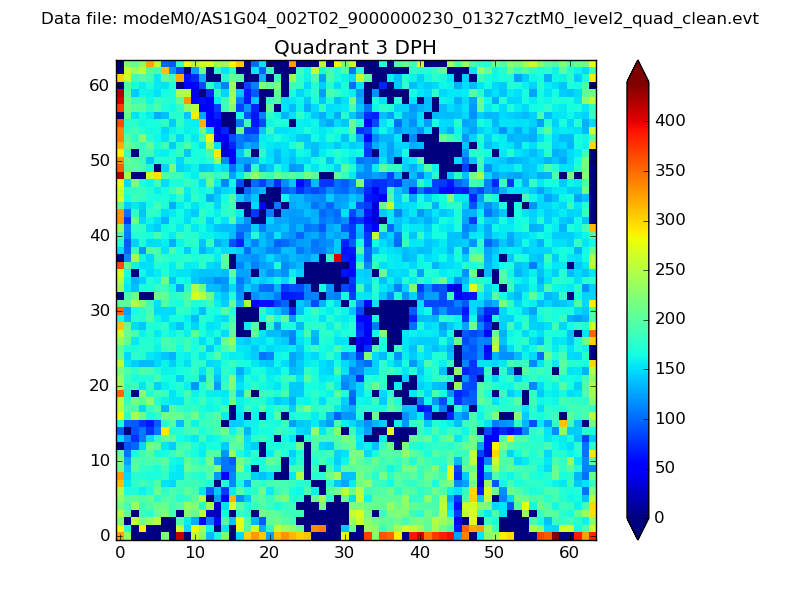 |
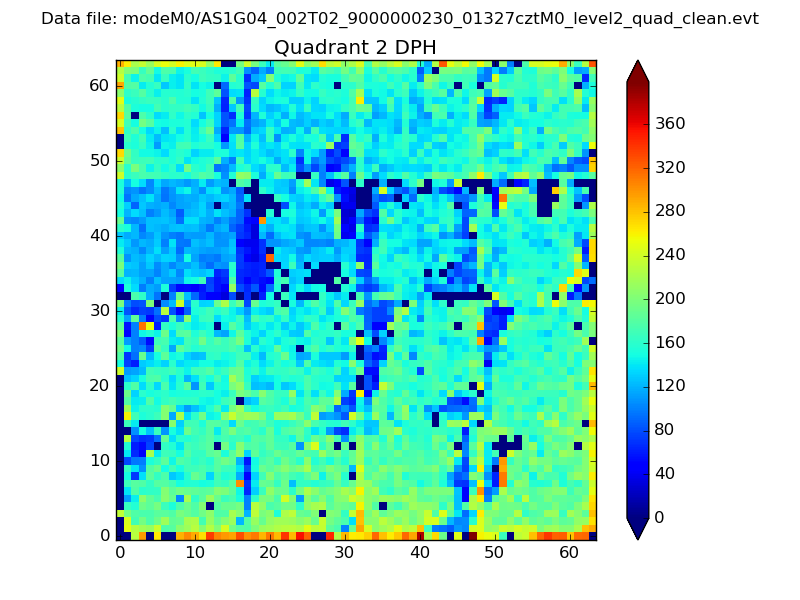 |
Quadrant C |
| Plot type | Count rate plots | Images |
|---|---|---|
| Comparison with Poisson distribution Blue bars denote a histogram of data divided into 1 sec bins. Red curve is a Poisson curve with rate = median count rate of data. |
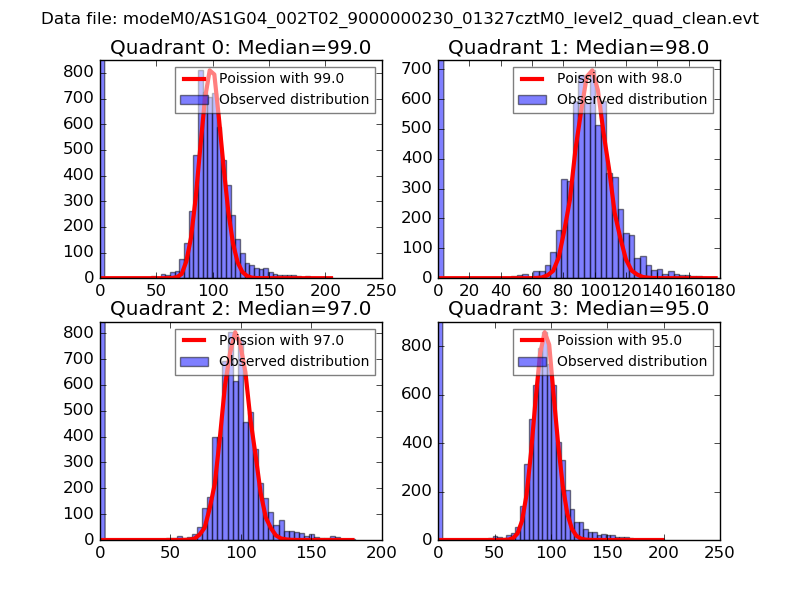 |
 |
| Quadrant-wise count rates Data is divided into 100 sec bins |
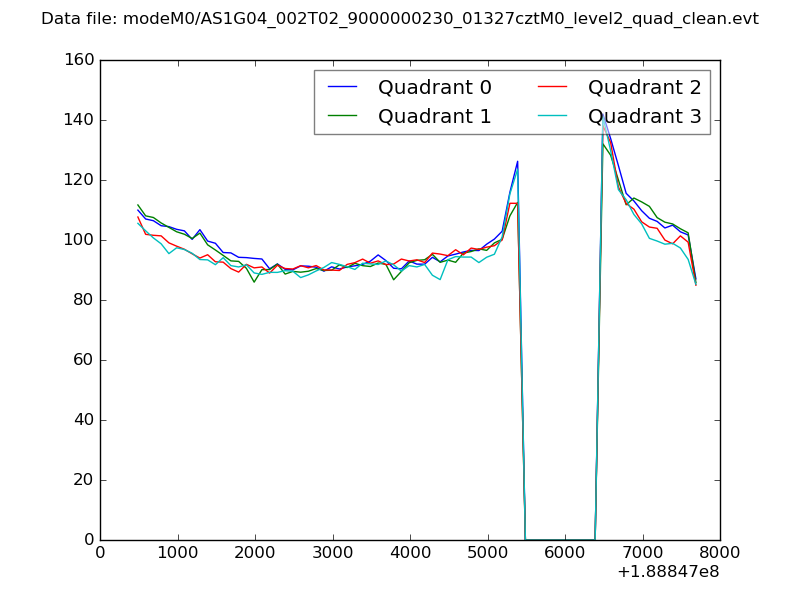 |
|
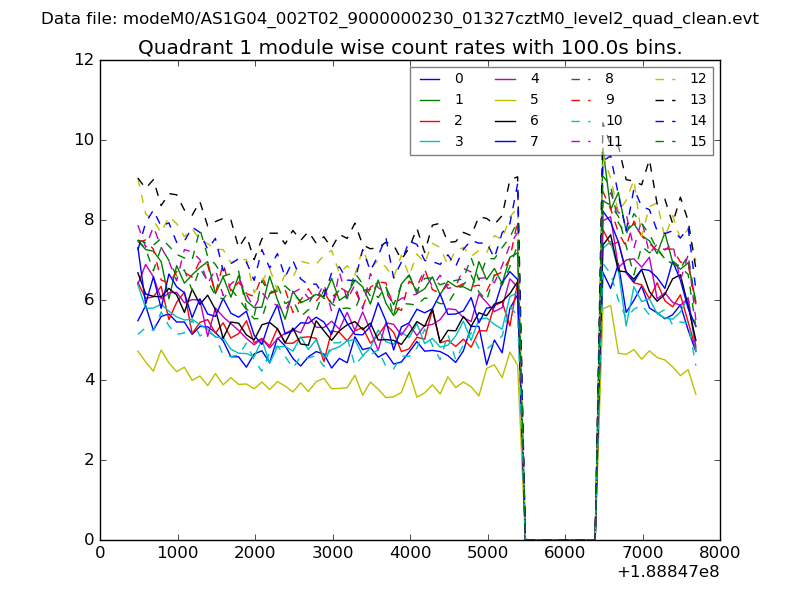
| Module-wise count rates for Quadrant A Data is divided into 100 sec bins |
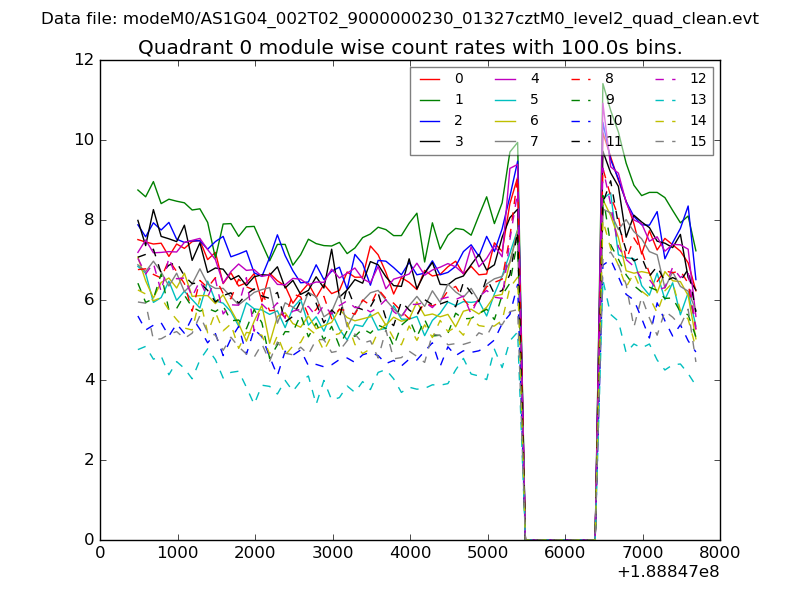 |
 |
| Module-wise count rates for Quadrant B Data is divided into 100 sec bins |
 |
 |
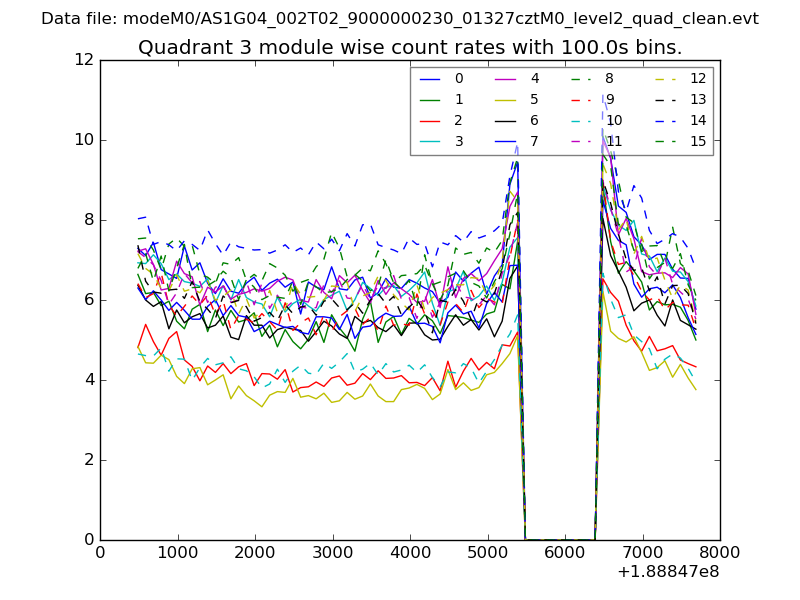
| Module-wise count rates for Quadrant C Data is divided into 100 sec bins |
 |
 |
| Module-wise count rates for Quadrant D Data is divided into 100 sec bins |
 |
 |
| Parameter | Plot |
|---|---|
| CZT HV Monitor | 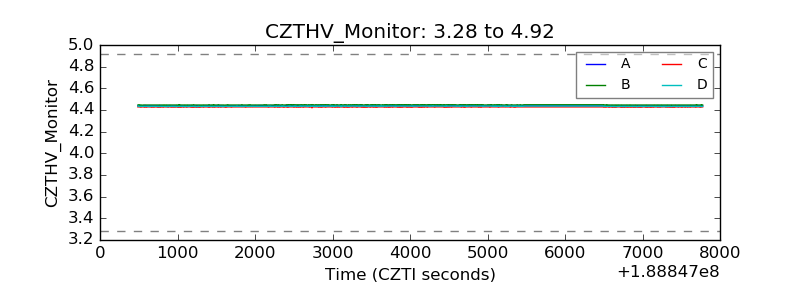 |
| D_VDD | 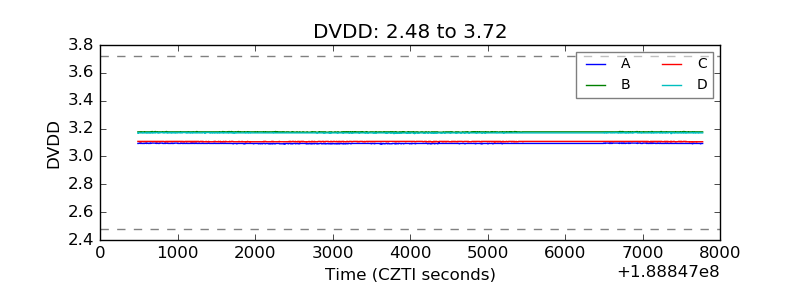 |
| Temperature 1 | 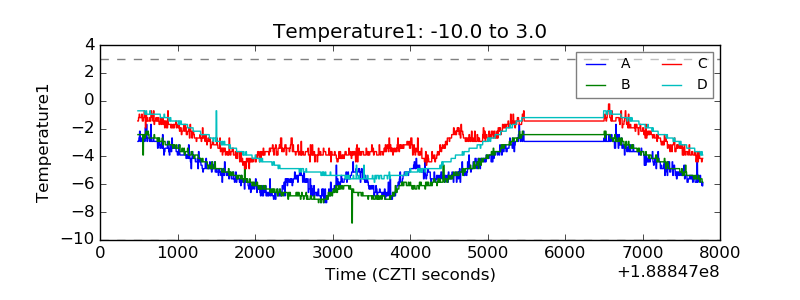 |
| Veto HV Monitor |  |
| Veto LLD | 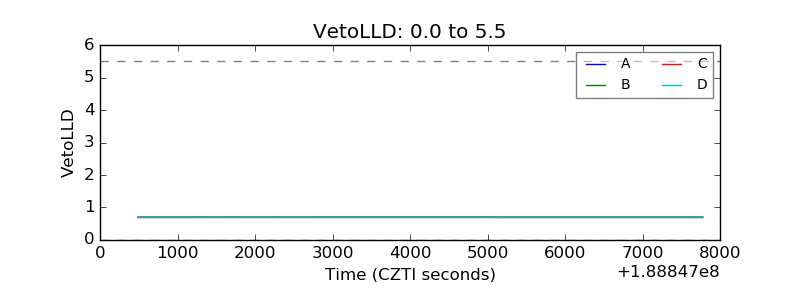 |
| Alpha Counter | 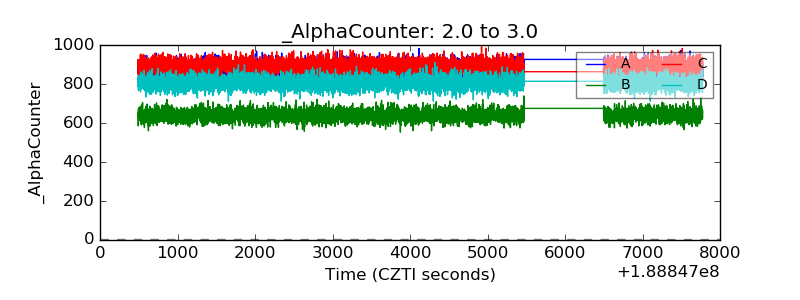 |
| _CPM_Rate | 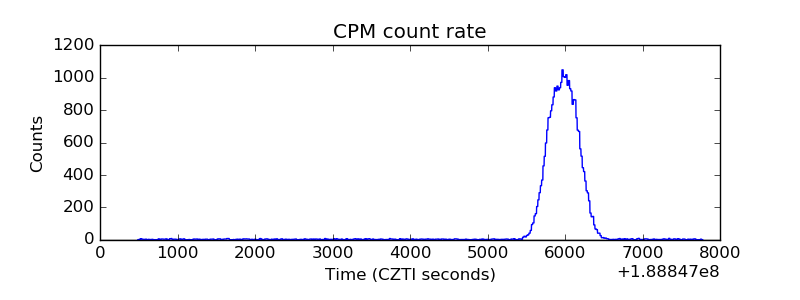 |
| CZT Counter | 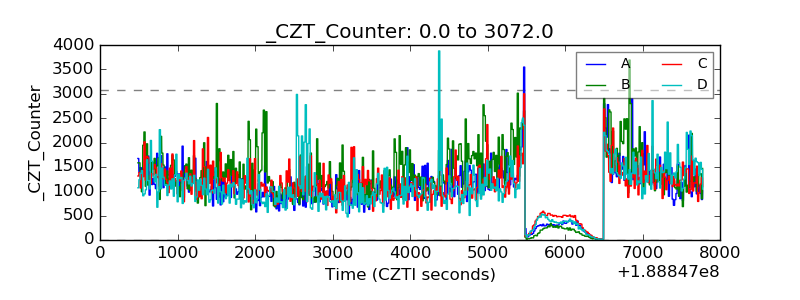 |
| +2.5 Volts monitor |  |
| +5 Volts monitor |  |
| _ROLL_ROT | 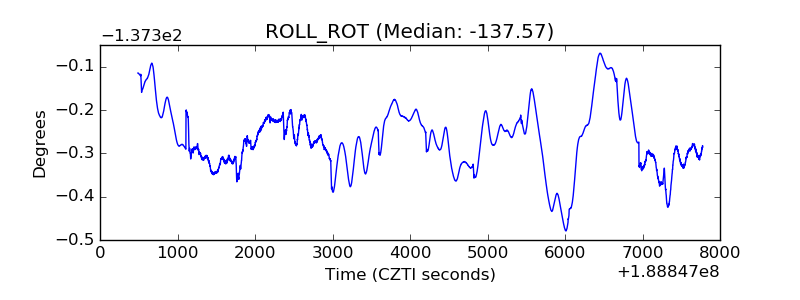 |
| _Roll_DEC | 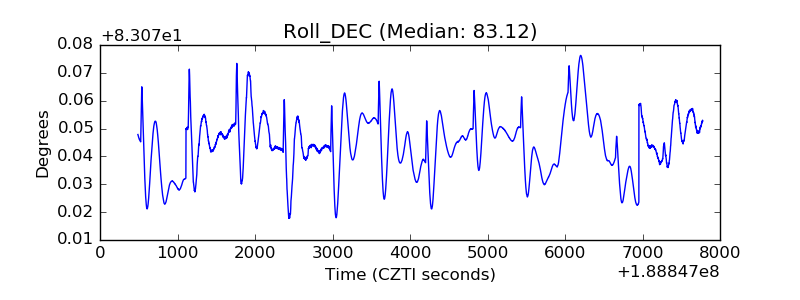 |
| _Roll_RA | 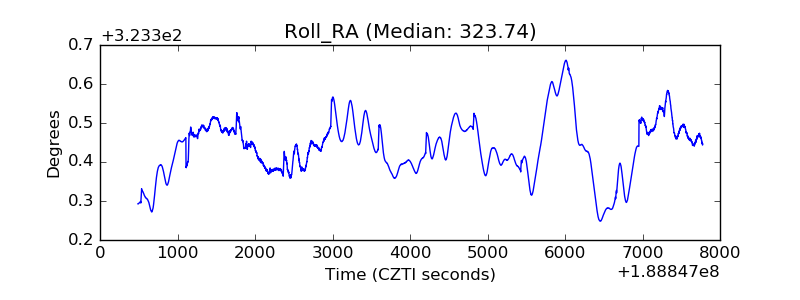 |
| Veto Counter |  |