| Param | Original file | Final file |
|---|---|---|
| Filename | modeM0/AS1G04_002T02_9000000230_01329cztM0_level2.evt | modeM0/AS1G04_002T02_9000000230_01329cztM0_level2_quad_clean.evt |
| Size (bytes) | 1,057,982,400 | 98,821,440 |
| Size | 1009.0 MB | 94.2 MB |
| Events in quadrant A | 7,569,879 | 643,207 |
| Events in quadrant B | 8,595,517 | 648,832 |
| Events in quadrant C | 8,039,703 | 636,614 |
| Events in quadrant D | 7,416,659 | 622,263 |
| Mode M9 | |||
|---|---|---|---|
| Quadrant | BADHDUFLAG | Total packets | Discarded packets |
| A | 0 | 12 | 0 |
| B | 0 | 12 | 0 |
| C | 0 | 12 | 0 |
| D | 0 | 12 | 0 |
| Mode M0 | |||
|---|---|---|---|
| Quadrant | BADHDUFLAG | Total packets | Discarded packets |
| A | 0 | 27036 | 2 |
| B | 0 | 30063 | 1 |
| C | 0 | 28355 | 1 |
| D | 0 | 26522 | 1 |
| Mode SS | |||
|---|---|---|---|
| Quadrant | BADHDUFLAG | Total packets | Discarded packets |
| A | 0 | 128 | 0 |
| B | 0 | 128 | 0 |
| C | 0 | 128 | 0 |
| D | 0 | 128 | 0 |
| Quadrant | Total seconds | Saturated seconds | Saturation percentage |
|---|---|---|---|
| A | 6334 | 28 | 0.442059% |
| B | 6334 | 47 | 0.742027% |
| C | 6334 | 5 | 0.078939% |
| D | 6334 | 79 | 1.247237% |
Noise dominated data is calculated using 1-second bins in cleaned event files. If a bin has >2000 counts, and if more than 50% of those come from <1% of pixels, then it is considered to be noise-dominated and hence unusable.
| Quadrant | # 1 sec bins | Bins with >0 counts | Bins with >2000 counts | High rate bins dominated by noise | Noise dominated (total time) | Noise dominated (detector-on time) | Marked lightcurve |
|---|---|---|---|---|---|---|---|
| A | 7494 | 6335 | 202 | 202 | 2.70% | 3.19% | 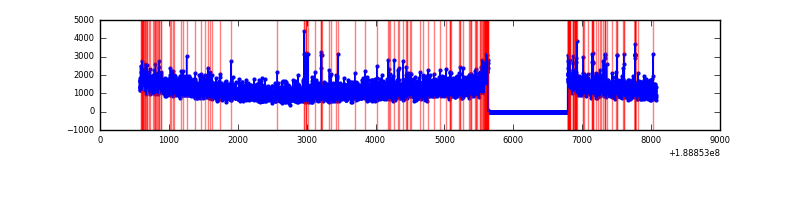 |
| B | 7494 | 6334 | 575 | 575 | 7.67% | 9.08% | 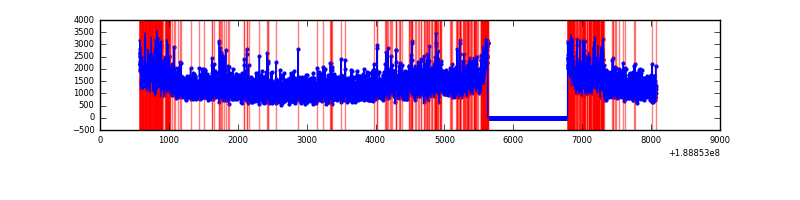 |
| C | 7494 | 6334 | 284 | 284 | 3.79% | 4.48% | 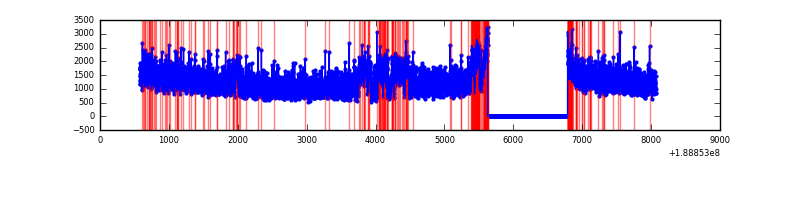 |
| D | 7494 | 6335 | 318 | 318 | 4.24% | 5.02% | 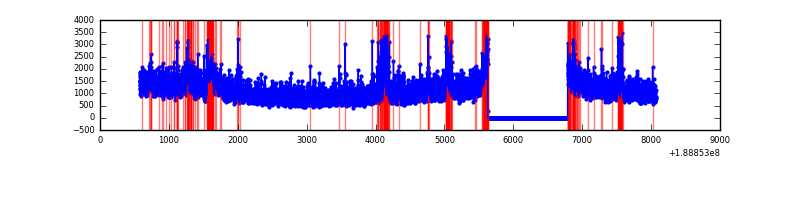 |
Top three noisy pixels from each quadrant. If the there are fewer than three noisy pixels in the level2.evt file, extra rows are filled as -1
| Pixel properties | Quadrant properties | ||||||
|---|---|---|---|---|---|---|---|
| Quadrant | DetID | PixID | Counts | Sigma | Mean | Median | Sigma |
| A | 4 | 32 | 117076 | 253.36 | 1895 | 1909 | 454.6 |
| A | 14 | 5 | 65519 | 139.94 | 1895 | 1909 | 454.6 |
| A | 12 | 243 | 47218 | 99.68 | 1895 | 1909 | 454.6 |
| B | 8 | 4 | 800528 | 1735.03 | 1984 | 1994 | 460.2 |
| B | 12 | 52 | 64728 | 136.31 | 1984 | 1994 | 460.2 |
| B | 6 | 53 | 61138 | 128.51 | 1984 | 1994 | 460.2 |
| C | 3 | 9 | 553130 | 1089.36 | 1827 | 1893 | 506.0 |
| C | 15 | 241 | 311213 | 611.28 | 1827 | 1893 | 506.0 |
| C | 3 | 111 | 20016 | 35.81 | 1827 | 1893 | 506.0 |
| D | 10 | 84 | 522599 | 957.5 | 1761 | 1824 | 543.9 |
| D | 1 | 83 | 84465 | 151.94 | 1761 | 1824 | 543.9 |
| D | 2 | 88 | 54403 | 96.67 | 1761 | 1824 | 543.9 |
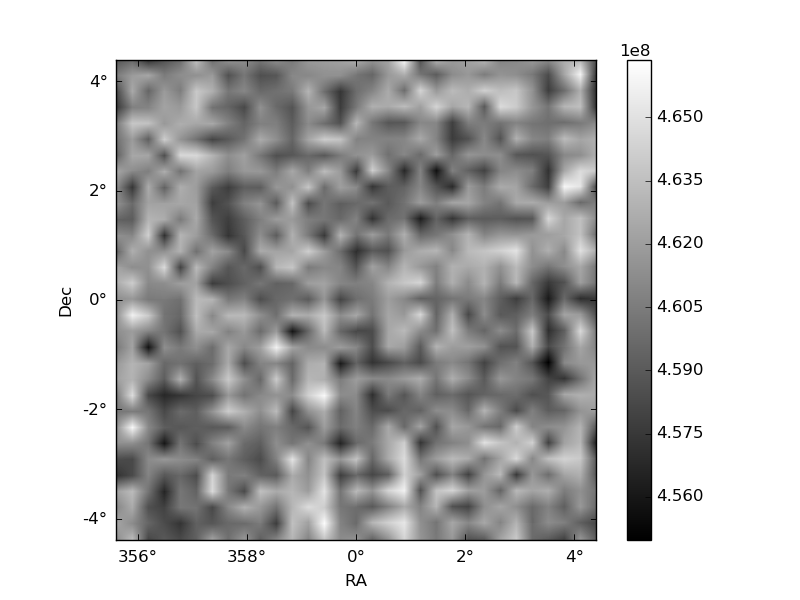
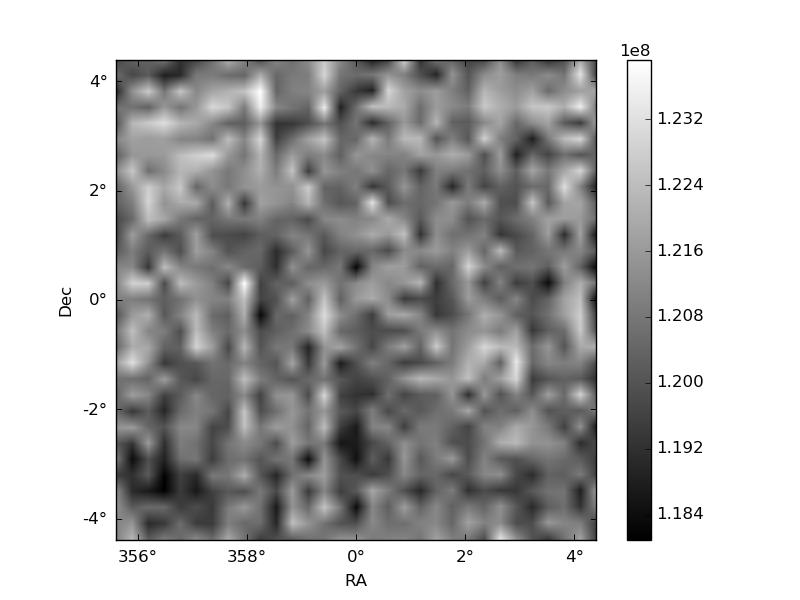
Histogram calculated using DETX and DETY for each event in the final _common_clean file
| Quadrant A | 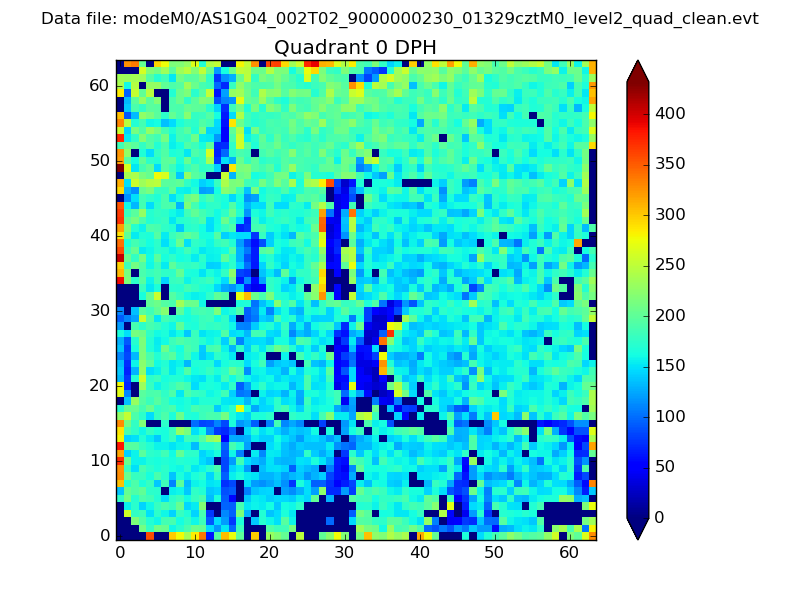 |
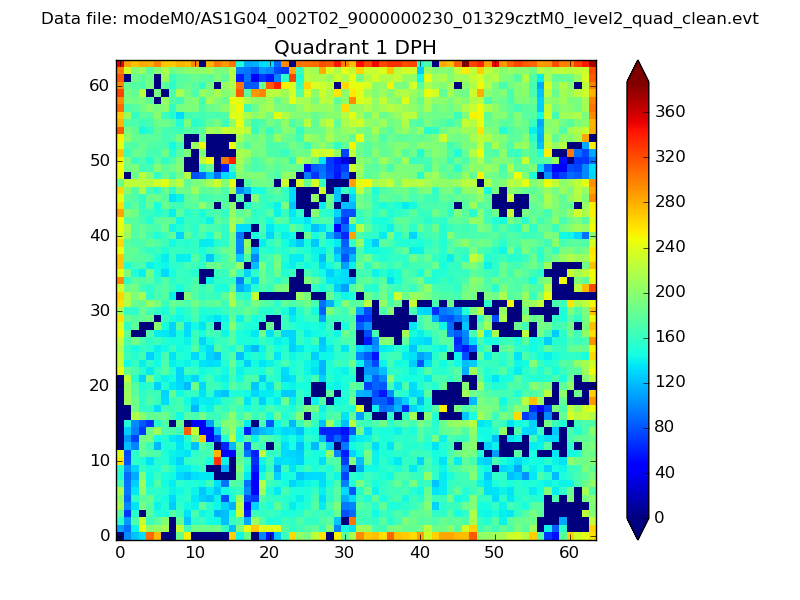 |
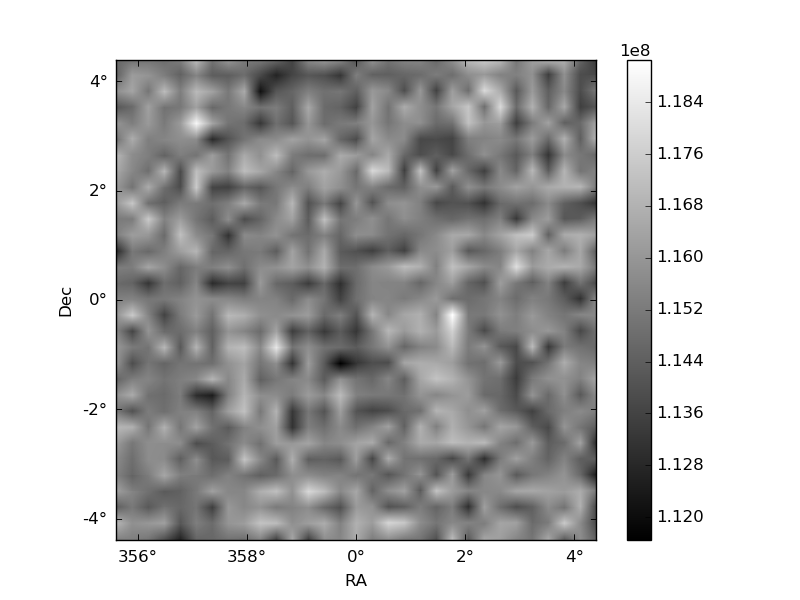
Quadrant B |
|---|---|---|---|
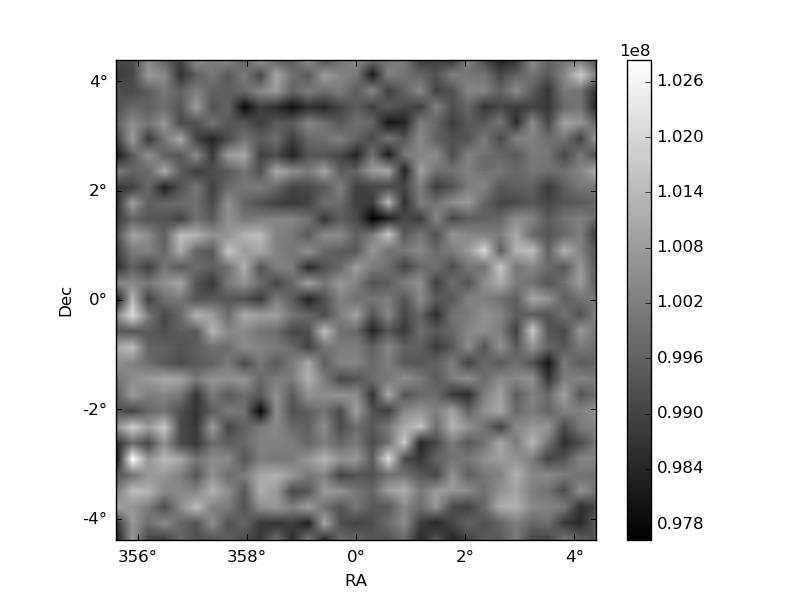
| Quadrant D | 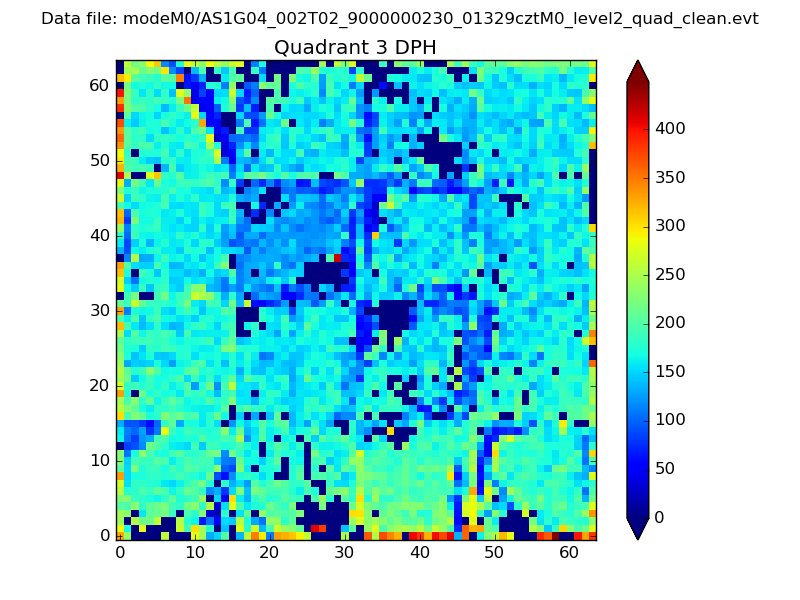 |
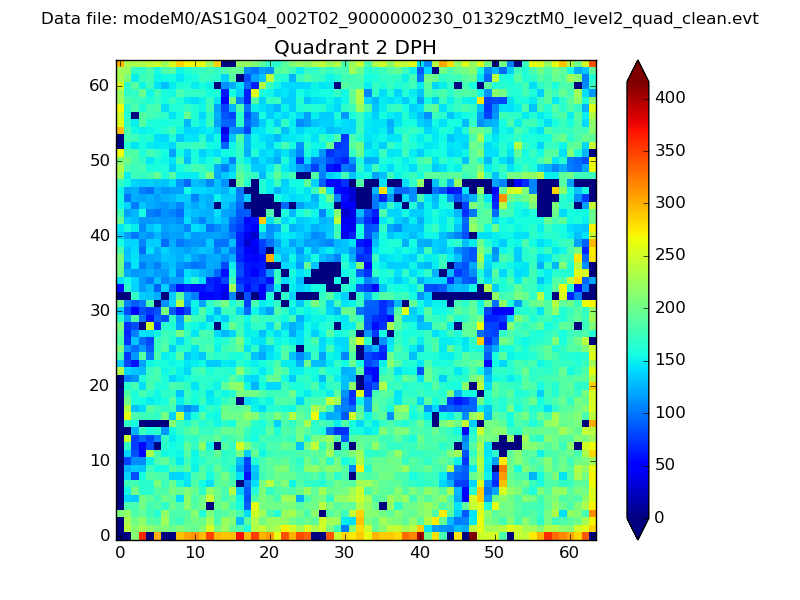 |
Quadrant C |
| Plot type | Count rate plots | Images |
|---|---|---|
| Comparison with Poisson distribution Blue bars denote a histogram of data divided into 1 sec bins. Red curve is a Poisson curve with rate = median count rate of data. |
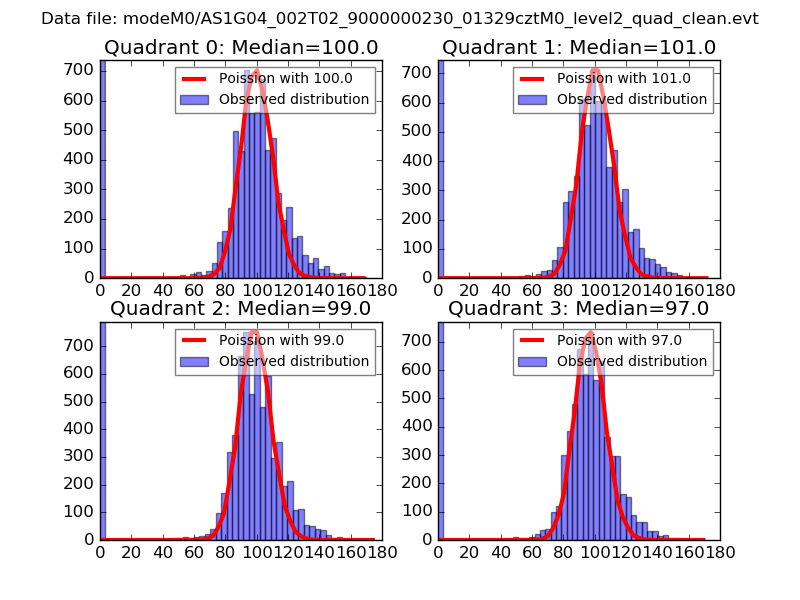 |
 |
| Quadrant-wise count rates Data is divided into 100 sec bins |
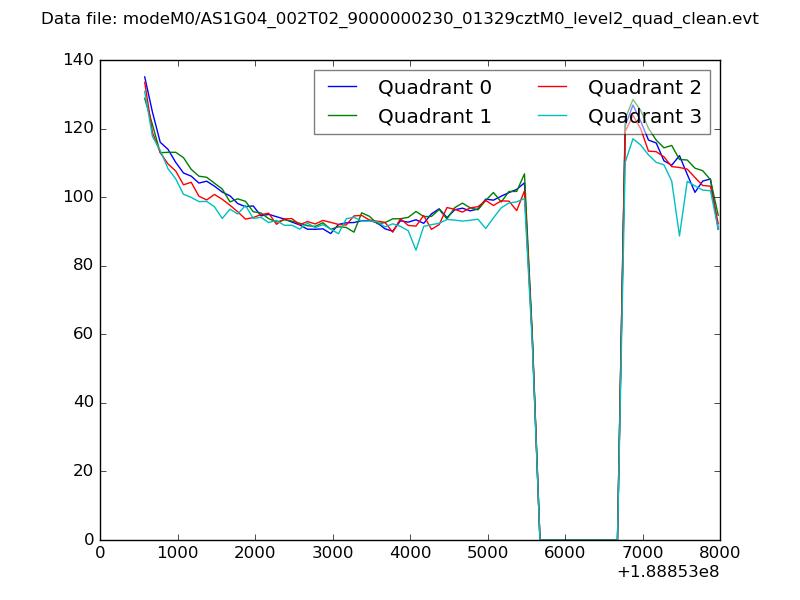 |
|
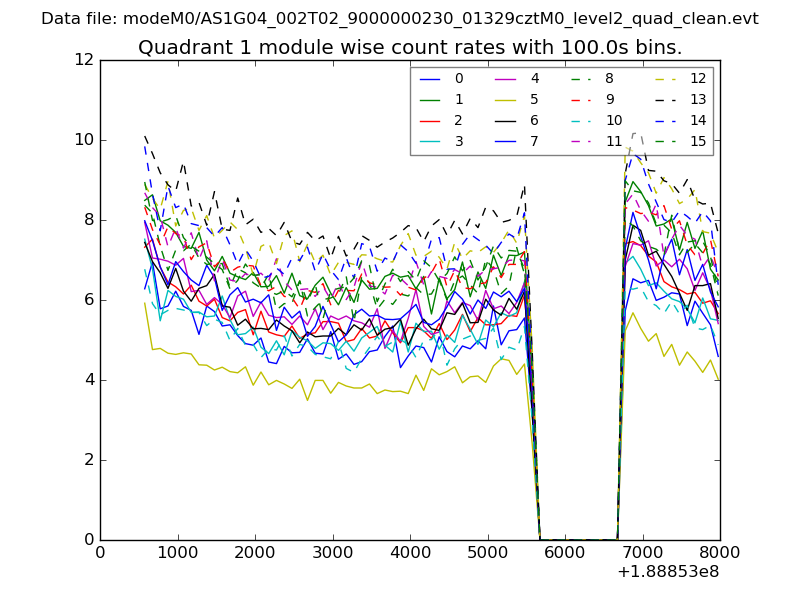
| Module-wise count rates for Quadrant A Data is divided into 100 sec bins |
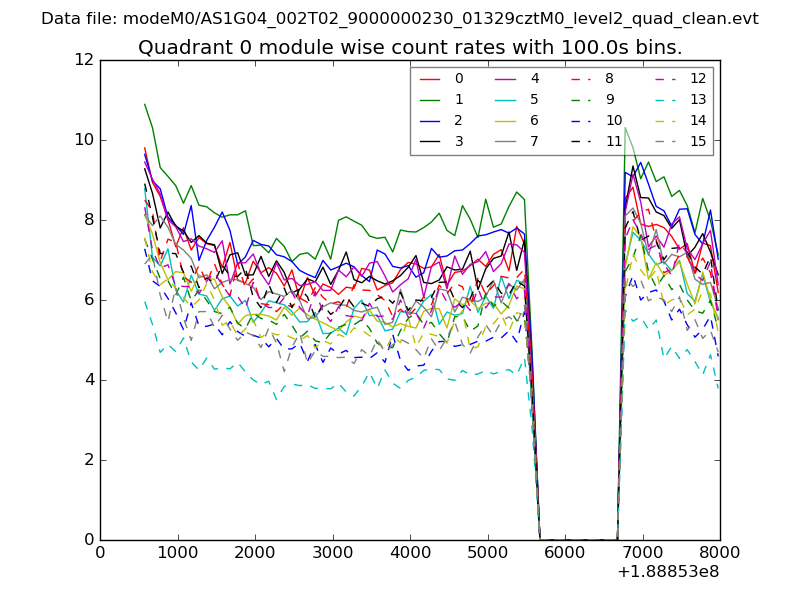 |
 |
| Module-wise count rates for Quadrant B Data is divided into 100 sec bins |
 |
 |
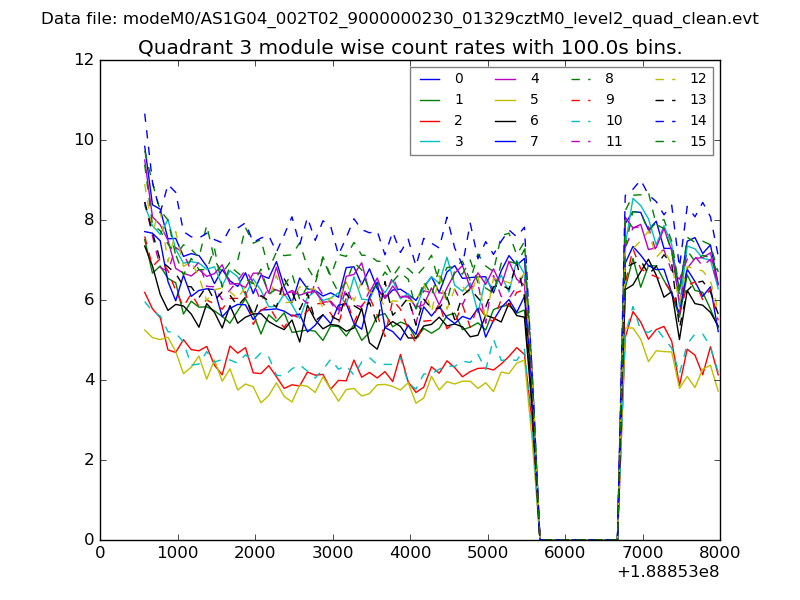
| Module-wise count rates for Quadrant C Data is divided into 100 sec bins |
 |
 |
| Module-wise count rates for Quadrant D Data is divided into 100 sec bins |
 |
 |
| Parameter | Plot |
|---|---|
| CZT HV Monitor |  |
| D_VDD | 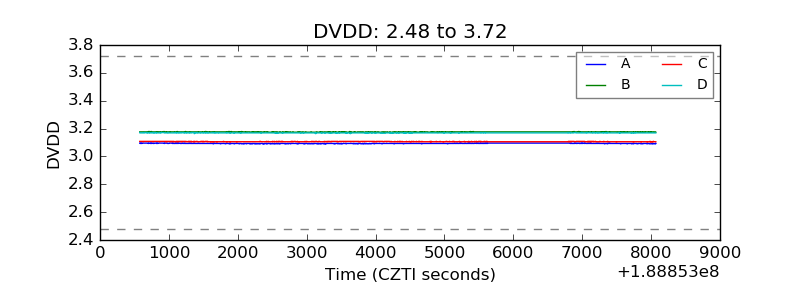 |
| Temperature 1 | 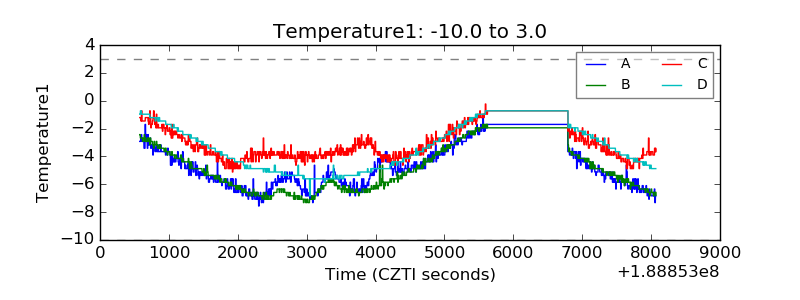 |
| Veto HV Monitor | 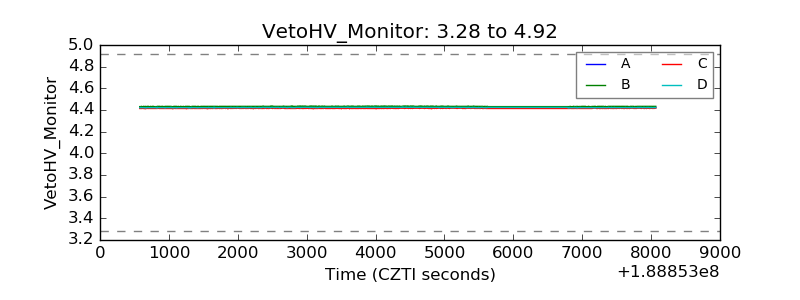 |
| Veto LLD | 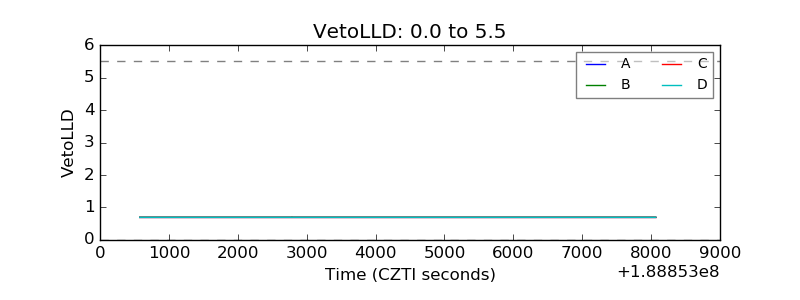 |
| Alpha Counter | 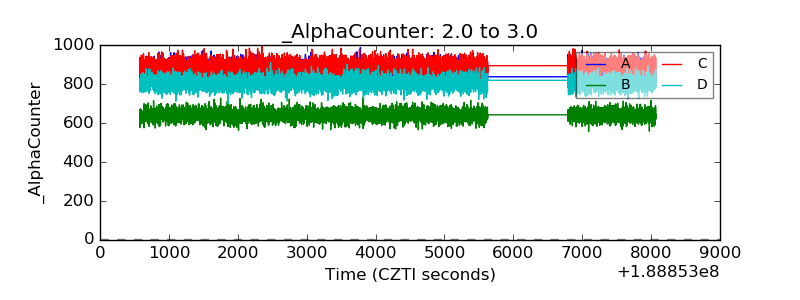 |
| _CPM_Rate | 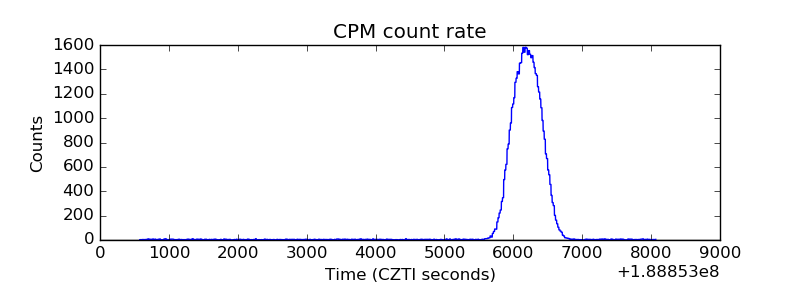 |
| CZT Counter | 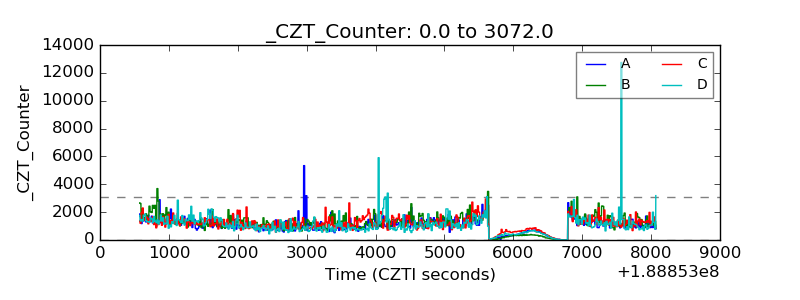 |
| +2.5 Volts monitor |  |
| +5 Volts monitor |  |
| _ROLL_ROT | 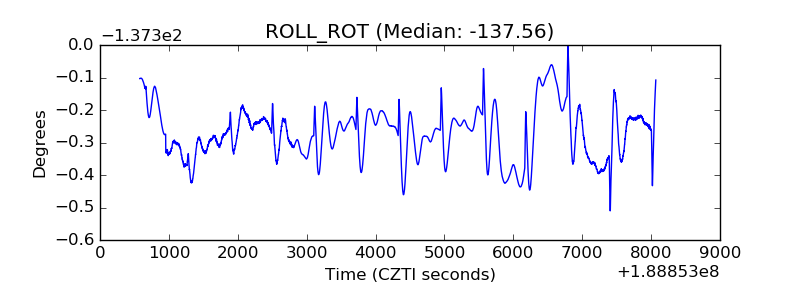 |
| _Roll_DEC | 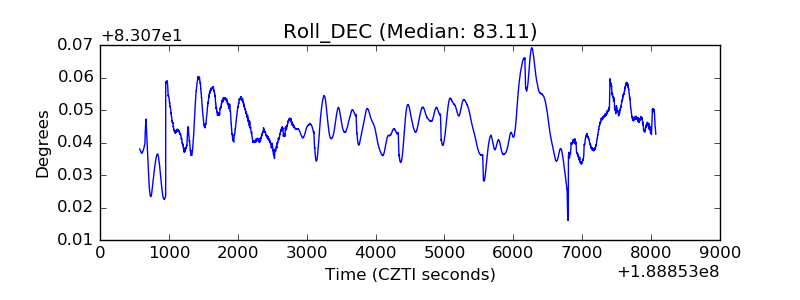 |
| _Roll_RA | 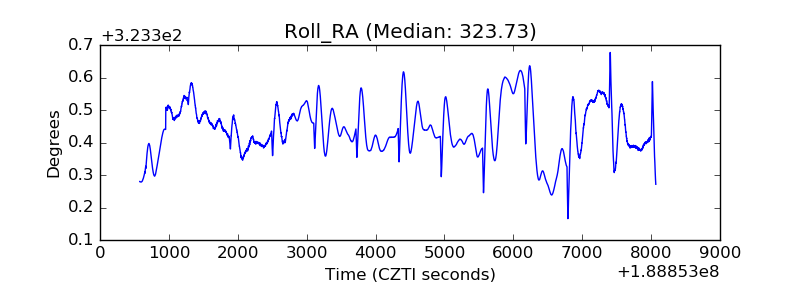 |
| Veto Counter | 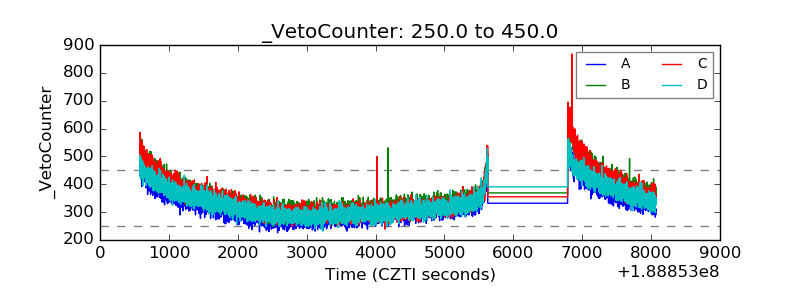 |