| Param | Original file | Final file |
|---|---|---|
| Filename | modeM0/AS1G04_002T02_9000000230_01330cztM0_level2.evt | modeM0/AS1G04_002T02_9000000230_01330cztM0_level2_quad_clean.evt |
| Size (bytes) | 1,070,179,200 | 98,075,520 |
| Size | 1020.6 MB | 93.5 MB |
| Events in quadrant A | 7,452,952 | 643,976 |
| Events in quadrant B | 8,523,734 | 655,677 |
| Events in quadrant C | 7,583,572 | 645,427 |
| Events in quadrant D | 8,438,467 | 590,931 |
| Mode M9 | |||
|---|---|---|---|
| Quadrant | BADHDUFLAG | Total packets | Discarded packets |
| A | 0 | 13 | 0 |
| B | 0 | 13 | 0 |
| C | 0 | 13 | 0 |
| D | 0 | 13 | 0 |
| Mode M0 | |||
|---|---|---|---|
| Quadrant | BADHDUFLAG | Total packets | Discarded packets |
| A | 0 | 26613 | 3 |
| B | 0 | 29730 | 2 |
| C | 0 | 26975 | 2 |
| D | 0 | 29558 | 2 |
| Mode SS | |||
|---|---|---|---|
| Quadrant | BADHDUFLAG | Total packets | Discarded packets |
| A | 0 | 126 | 0 |
| B | 0 | 126 | 0 |
| C | 0 | 126 | 0 |
| D | 0 | 126 | 0 |
| Quadrant | Total seconds | Saturated seconds | Saturation percentage |
|---|---|---|---|
| A | 6219 | 46 | 0.739669% |
| B | 6219 | 57 | 0.916546% |
| C | 6219 | 13 | 0.209037% |
| D | 6219 | 578 | 9.294099% |
Noise dominated data is calculated using 1-second bins in cleaned event files. If a bin has >2000 counts, and if more than 50% of those come from <1% of pixels, then it is considered to be noise-dominated and hence unusable.
| Quadrant | # 1 sec bins | Bins with >0 counts | Bins with >2000 counts | High rate bins dominated by noise | Noise dominated (total time) | Noise dominated (detector-on time) | Marked lightcurve |
|---|---|---|---|---|---|---|---|
| A | 7464 | 6220 | 238 | 238 | 3.19% | 3.83% | 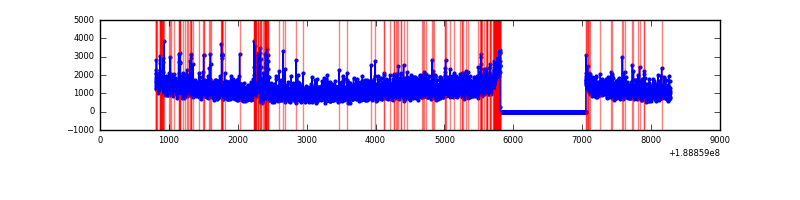 |
| B | 7464 | 6220 | 536 | 536 | 7.18% | 8.62% | 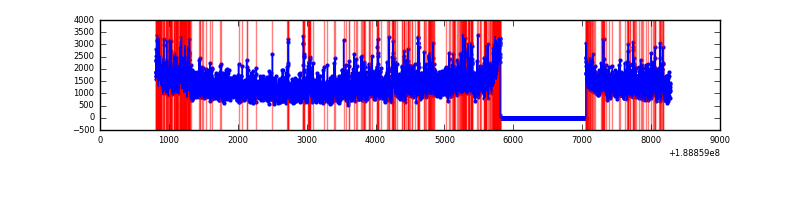 |
| C | 7464 | 6220 | 242 | 242 | 3.24% | 3.89% | 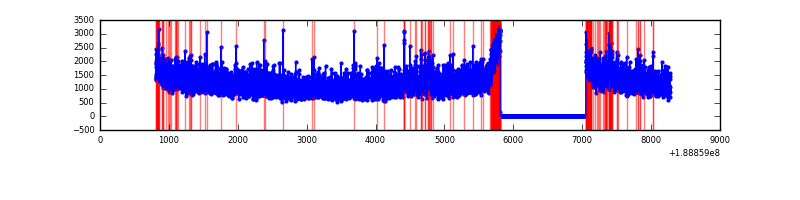 |
| D | 7464 | 6219 | 959 | 959 | 12.85% | 15.42% | 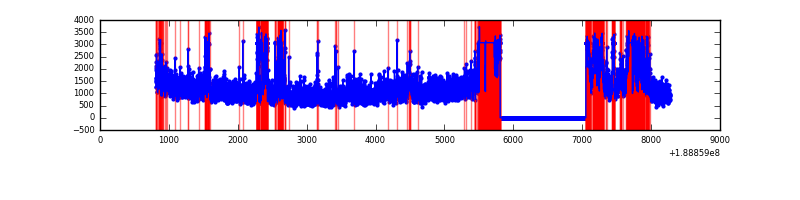 |
Top three noisy pixels from each quadrant. If the there are fewer than three noisy pixels in the level2.evt file, extra rows are filled as -1
| Pixel properties | Quadrant properties | ||||||
|---|---|---|---|---|---|---|---|
| Quadrant | DetID | PixID | Counts | Sigma | Mean | Median | Sigma |
| A | 4 | 32 | 284575 | 635.17 | 1854 | 1868 | 445.1 |
| A | 8 | 14 | 14840 | 29.14 | 1854 | 1868 | 445.1 |
| A | 8 | 15 | 12774 | 24.5 | 1854 | 1868 | 445.1 |
| B | 8 | 4 | 755828 | 1646.48 | 1969 | 1975 | 457.9 |
| B | 12 | 52 | 116973 | 251.17 | 1969 | 1975 | 457.9 |
| B | 6 | 53 | 60410 | 127.63 | 1969 | 1975 | 457.9 |
| C | 15 | 241 | 304146 | 608.79 | 1792 | 1854 | 496.5 |
| C | 3 | 9 | 163615 | 325.77 | 1792 | 1854 | 496.5 |
| C | 9 | 52 | 58561 | 114.2 | 1792 | 1854 | 496.5 |
| D | 10 | 84 | 2225891 | 4450.39 | 1626 | 1682 | 499.8 |
| D | 15 | 13 | 38435 | 73.54 | 1626 | 1682 | 499.8 |
| D | 1 | 83 | 28186 | 53.03 | 1626 | 1682 | 499.8 |
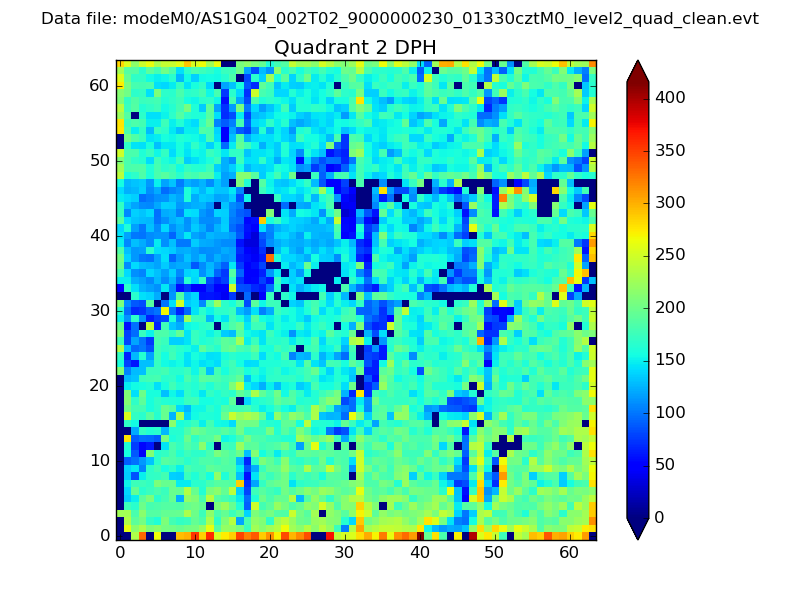
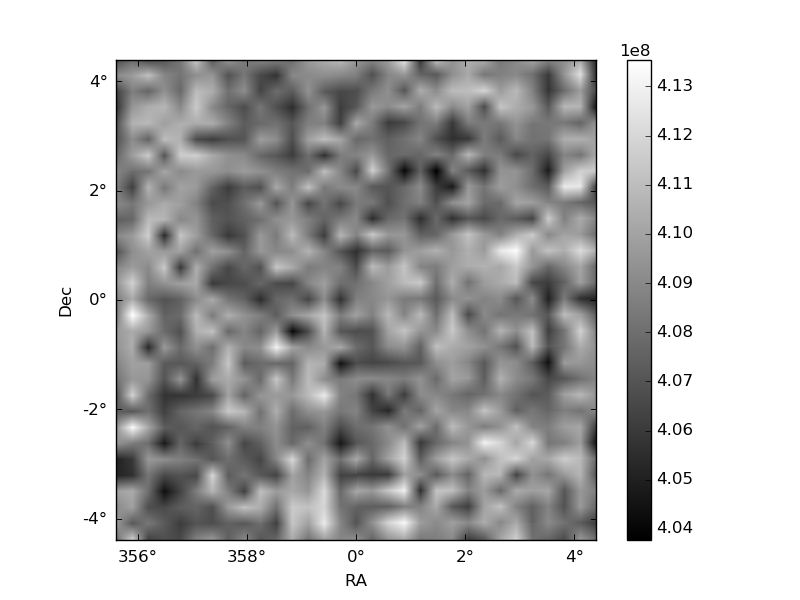
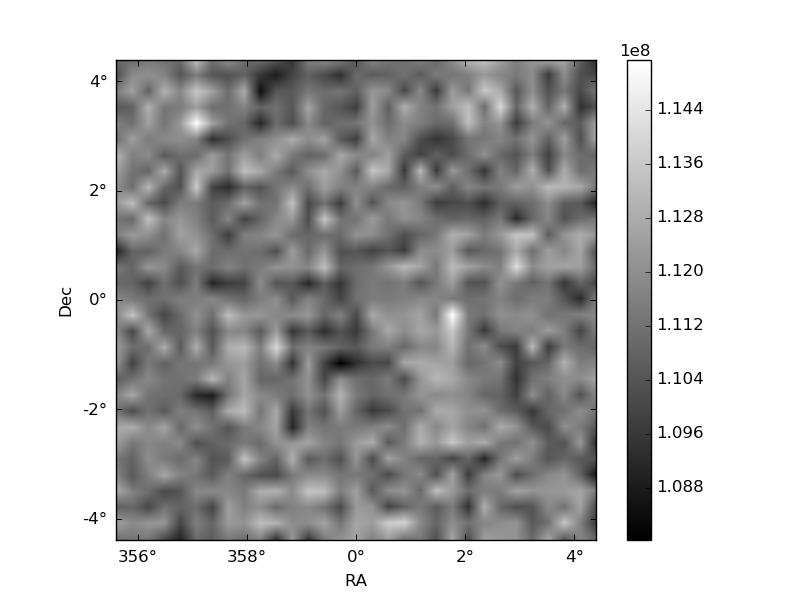
Histogram calculated using DETX and DETY for each event in the final _common_clean file
| Quadrant A | 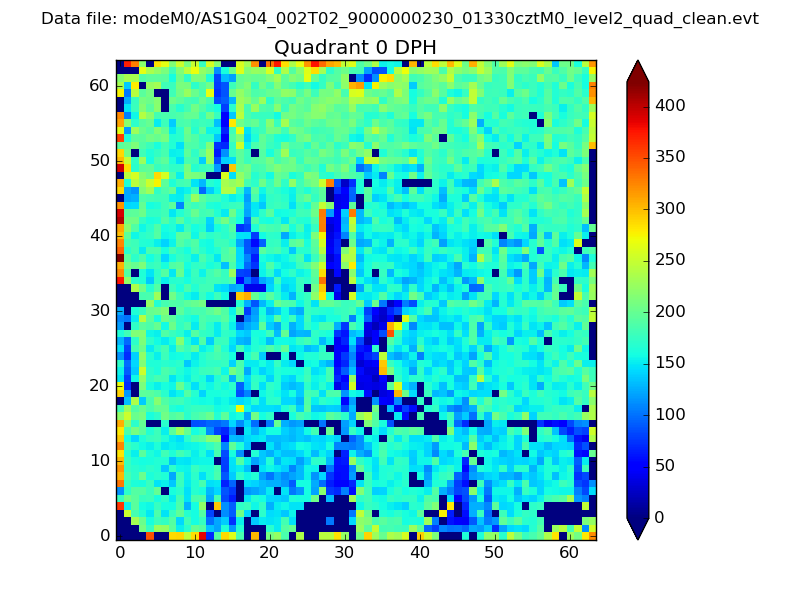 |
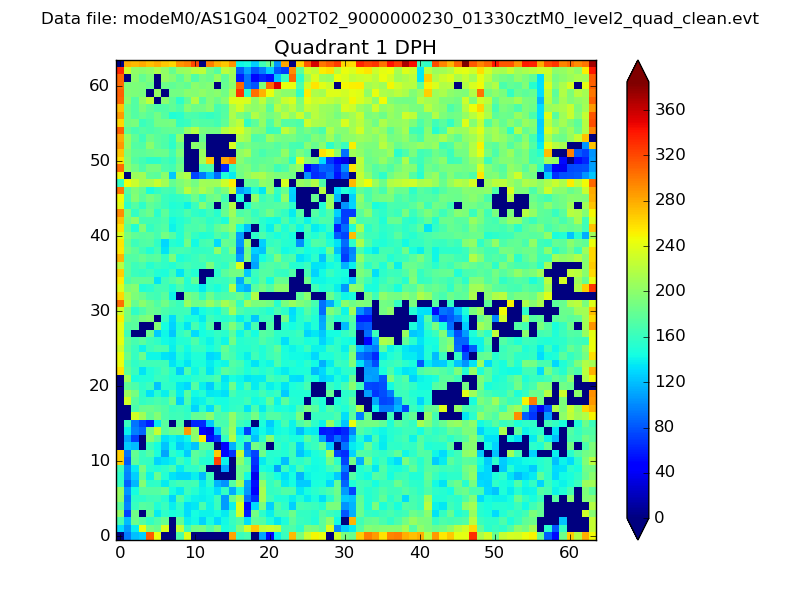 |
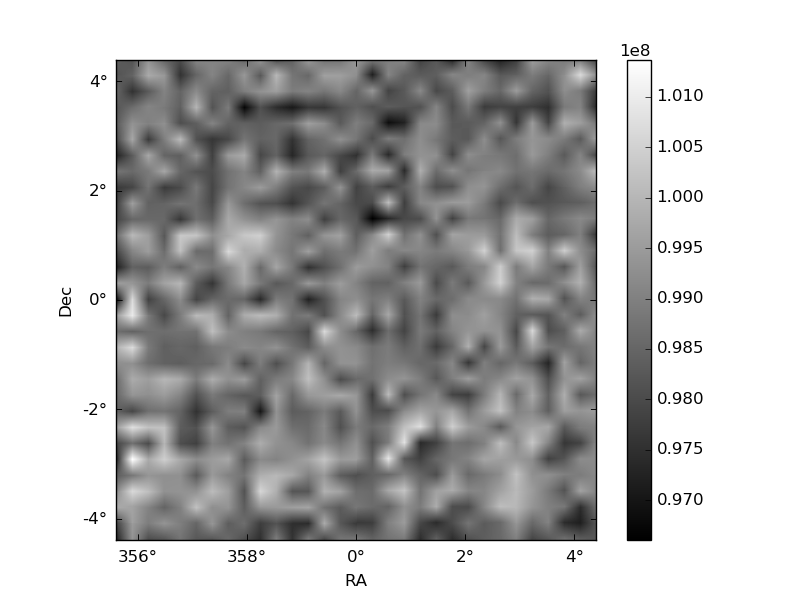
Quadrant B |
|---|---|---|---|
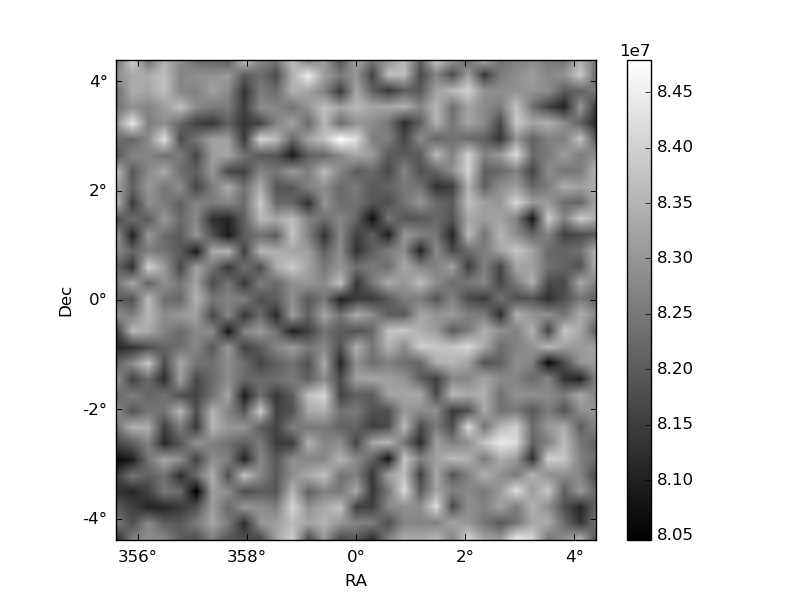
| Quadrant D | 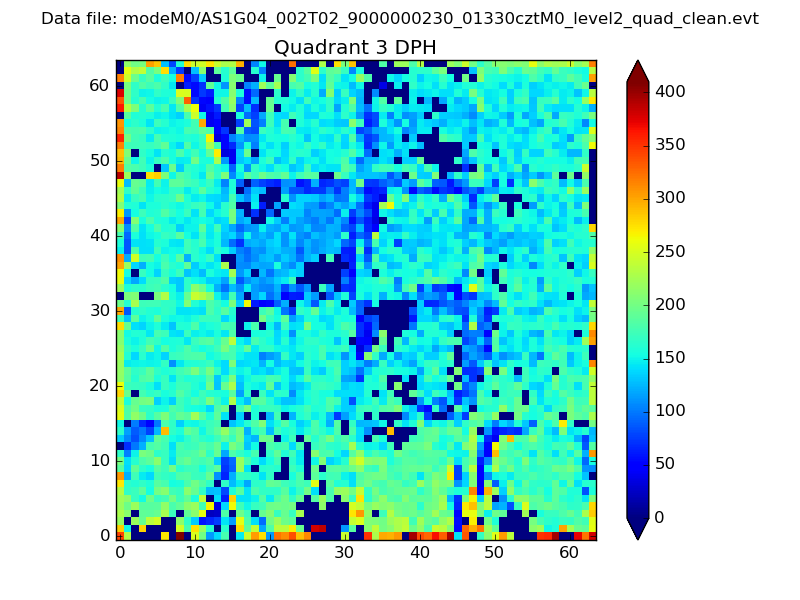 |
 |
Quadrant C |
| Plot type | Count rate plots | Images |
|---|---|---|
| Comparison with Poisson distribution Blue bars denote a histogram of data divided into 1 sec bins. Red curve is a Poisson curve with rate = median count rate of data. |
 |
 |
| Quadrant-wise count rates Data is divided into 100 sec bins |
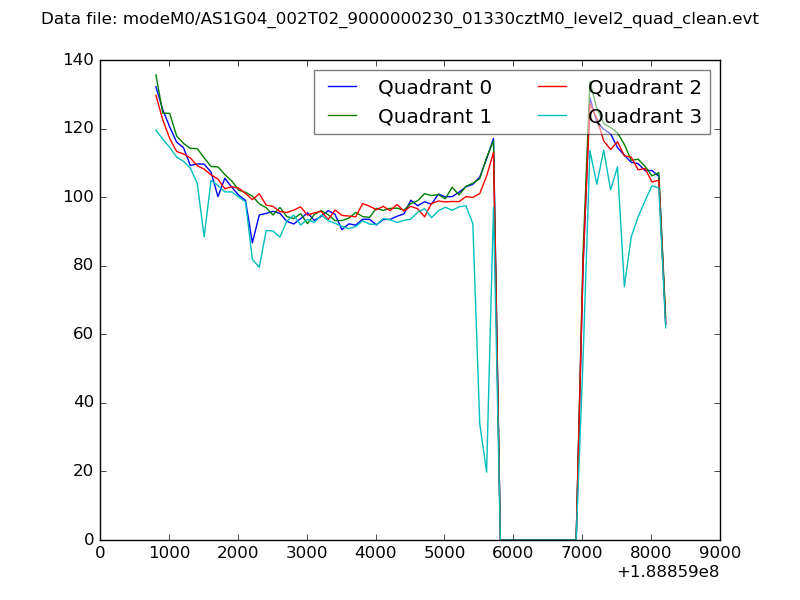 |
|
| Module-wise count rates for Quadrant A Data is divided into 100 sec bins |
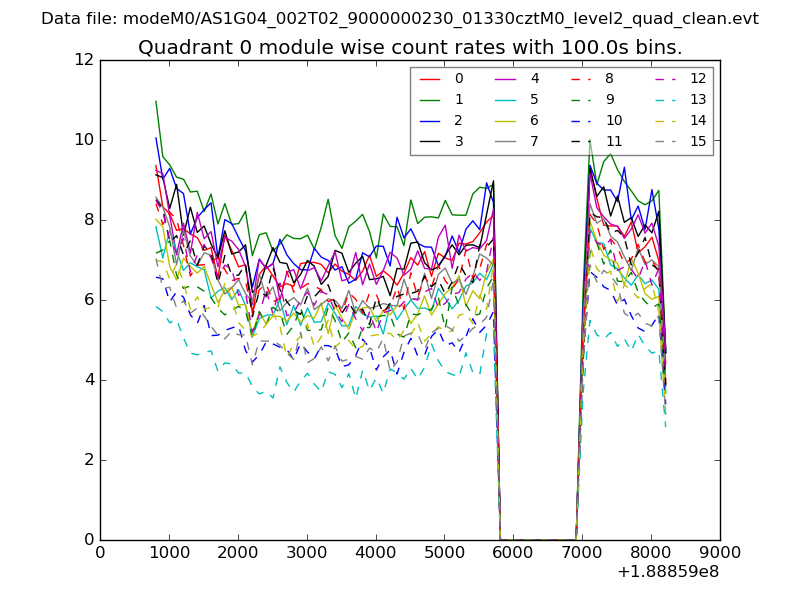 |
 |
| Module-wise count rates for Quadrant B Data is divided into 100 sec bins |
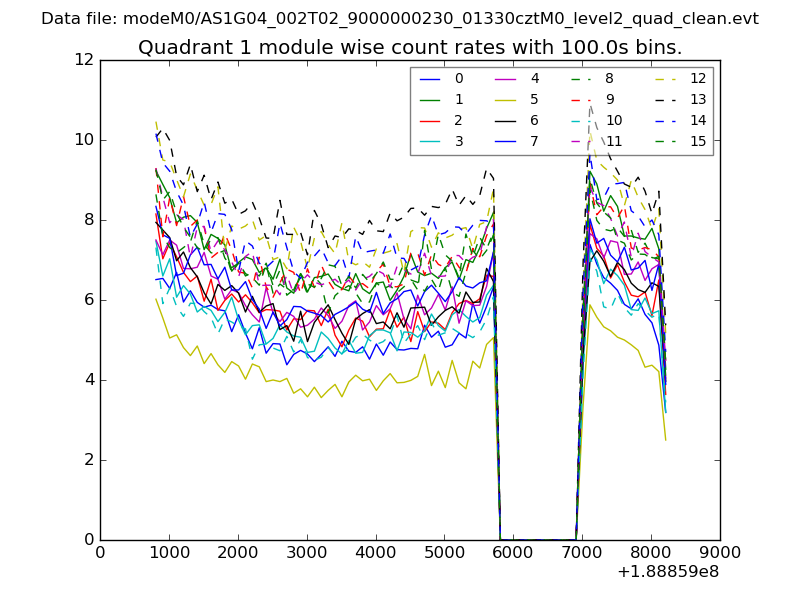 |
 |
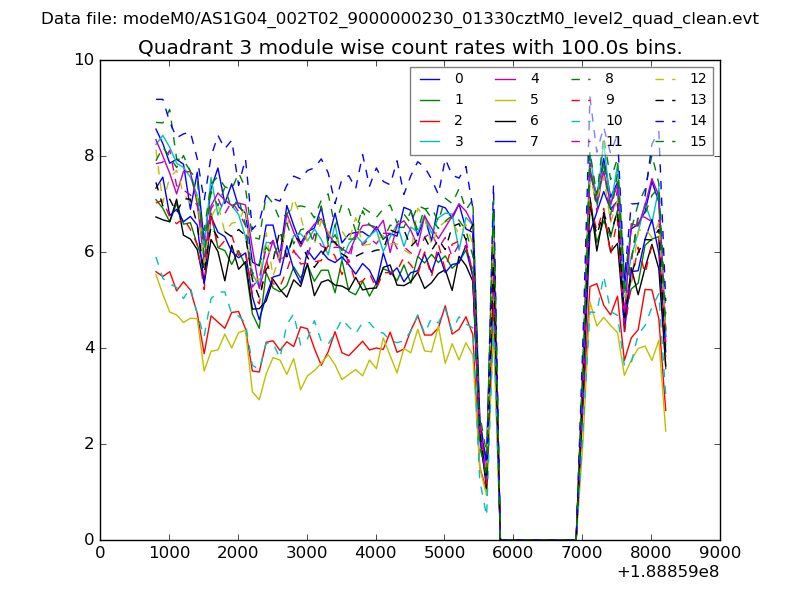
| Module-wise count rates for Quadrant C Data is divided into 100 sec bins |
 |
 |
| Module-wise count rates for Quadrant D Data is divided into 100 sec bins |
 |
 |
| Parameter | Plot |
|---|---|
| CZT HV Monitor |  |
| D_VDD | 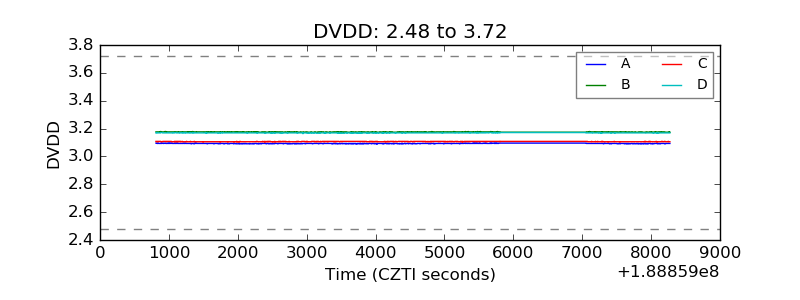 |
| Temperature 1 | 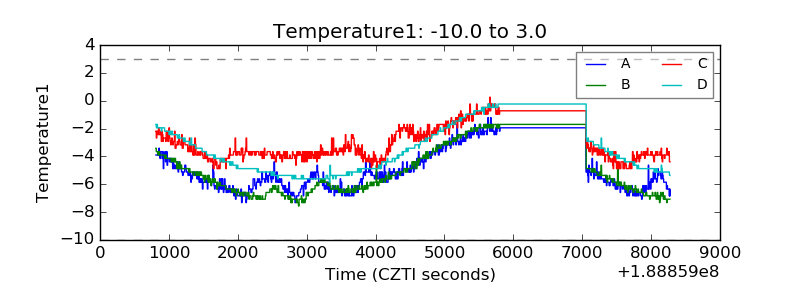 |
| Veto HV Monitor | 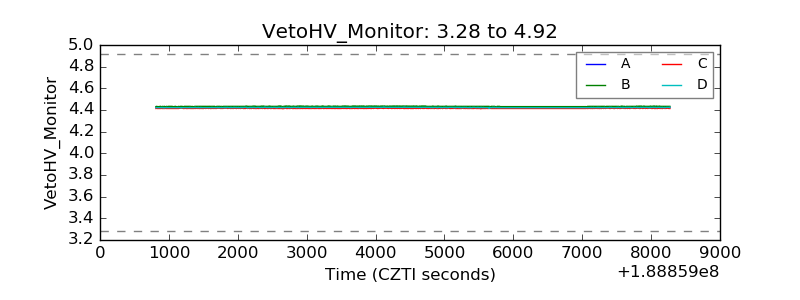 |
| Veto LLD | 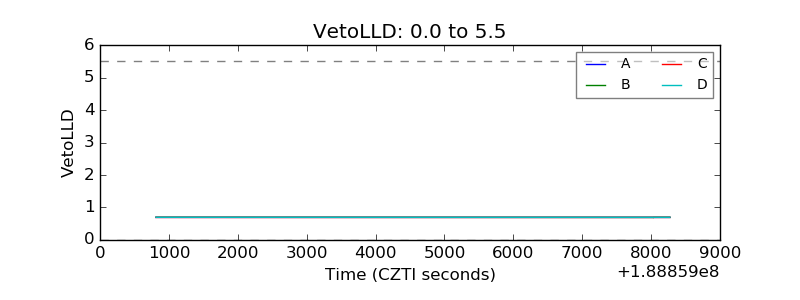 |
| Alpha Counter | 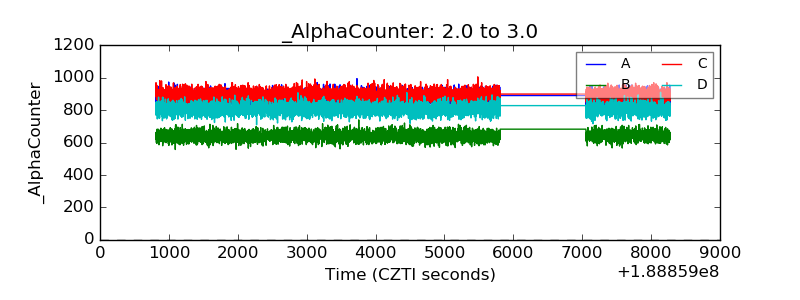 |
| _CPM_Rate | 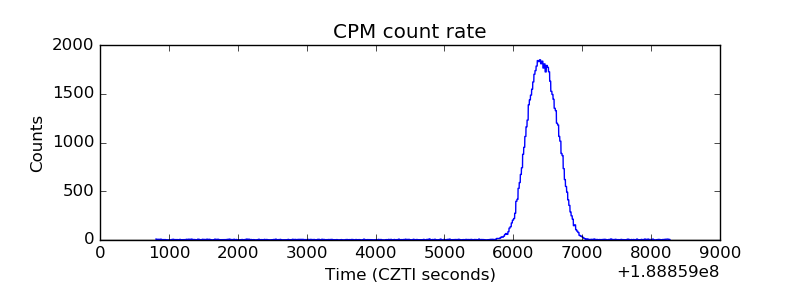 |
| CZT Counter | 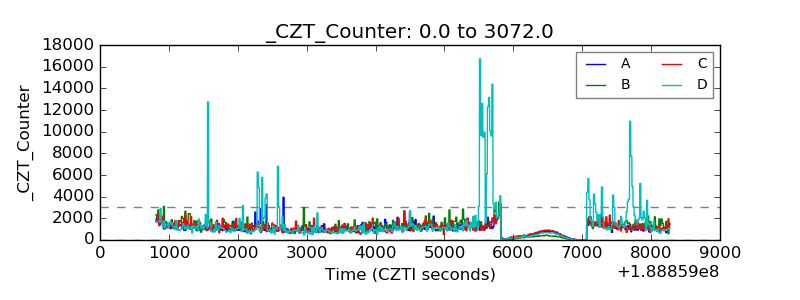 |
| +2.5 Volts monitor |  |
| +5 Volts monitor |  |
| _ROLL_ROT | 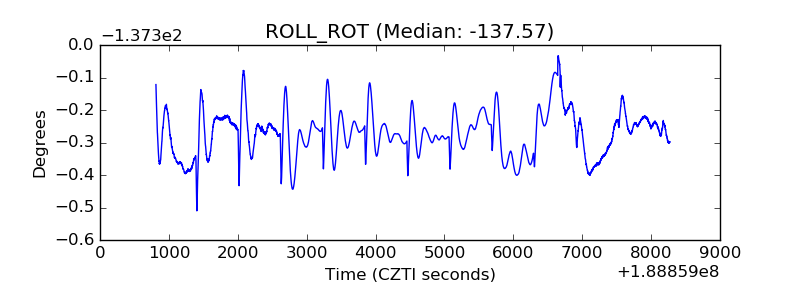 |
| _Roll_DEC | 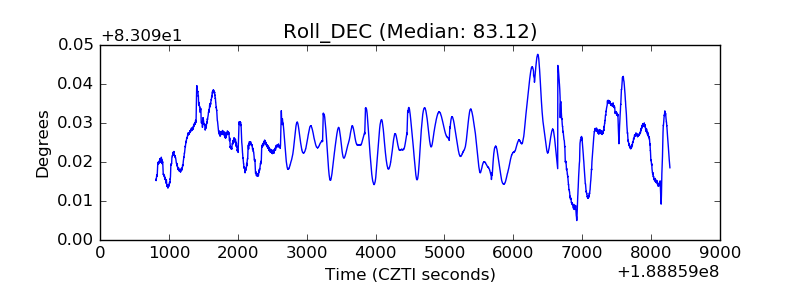 |
| _Roll_RA | 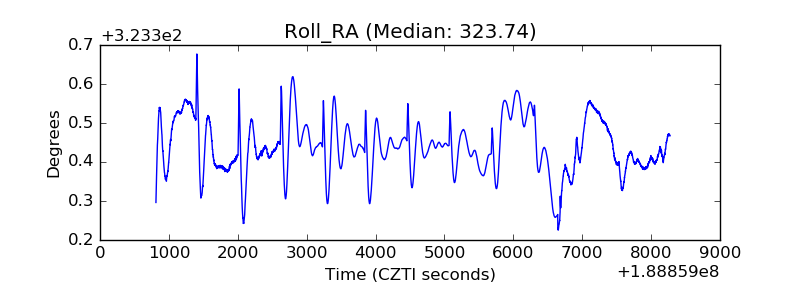 |
| Veto Counter |  |