| Param | Original file | Final file |
|---|---|---|
| Filename | modeM0/AS1G04_002T02_9000000230_01333cztM0_level2.evt | modeM0/AS1G04_002T02_9000000230_01333cztM0_level2_quad_clean.evt |
| Size (bytes) | 1,022,267,520 | 94,265,280 |
| Size | 974.9 MB | 89.9 MB |
| Events in quadrant A | 7,359,759 | 615,198 |
| Events in quadrant B | 8,138,599 | 622,224 |
| Events in quadrant C | 8,076,159 | 600,337 |
| Events in quadrant D | 6,972,749 | 582,895 |
| Mode M9 | |||
|---|---|---|---|
| Quadrant | BADHDUFLAG | Total packets | Discarded packets |
| A | 0 | 11 | 0 |
| B | 0 | 11 | 0 |
| C | 0 | 11 | 0 |
| D | 0 | 11 | 0 |
| Mode M0 | |||
|---|---|---|---|
| Quadrant | BADHDUFLAG | Total packets | Discarded packets |
| A | 0 | 26285 | 2 |
| B | 0 | 28605 | 1 |
| C | 0 | 28400 | 1 |
| D | 0 | 25211 | 1 |
| Mode SS | |||
|---|---|---|---|
| Quadrant | BADHDUFLAG | Total packets | Discarded packets |
| A | 0 | 126 | 0 |
| B | 0 | 126 | 0 |
| C | 0 | 126 | 0 |
| D | 0 | 126 | 0 |
| Quadrant | Total seconds | Saturated seconds | Saturation percentage |
|---|---|---|---|
| A | 6220 | 23 | 0.369775% |
| B | 6220 | 38 | 0.610932% |
| C | 6220 | 24 | 0.385852% |
| D | 6220 | 172 | 2.765273% |
Noise dominated data is calculated using 1-second bins in cleaned event files. If a bin has >2000 counts, and if more than 50% of those come from <1% of pixels, then it is considered to be noise-dominated and hence unusable.
| Quadrant | # 1 sec bins | Bins with >0 counts | Bins with >2000 counts | High rate bins dominated by noise | Noise dominated (total time) | Noise dominated (detector-on time) | Marked lightcurve |
|---|---|---|---|---|---|---|---|
| A | 7305 | 6222 | 262 | 262 | 3.59% | 4.21% | 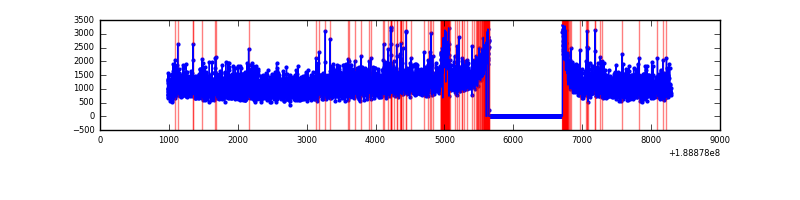 |
| B | 7305 | 6222 | 400 | 400 | 5.48% | 6.43% | 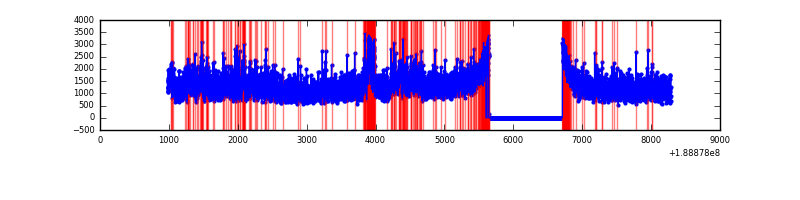 |
| C | 7305 | 6222 | 415 | 415 | 5.68% | 6.67% | 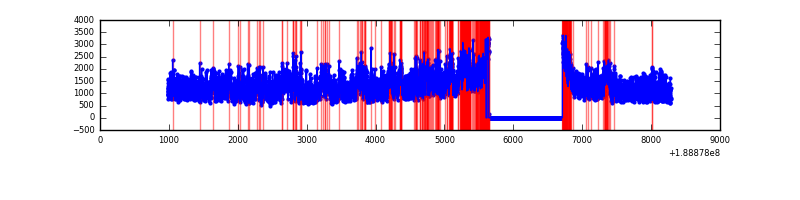 |
| D | 7305 | 6222 | 464 | 464 | 6.35% | 7.46% | 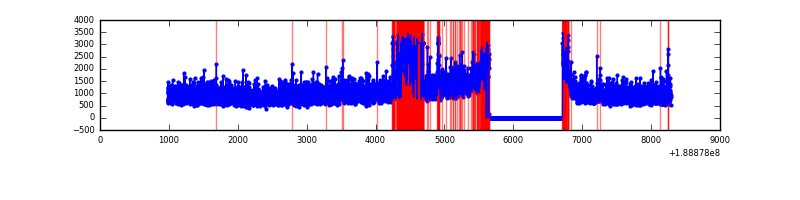 |
Top three noisy pixels from each quadrant. If the there are fewer than three noisy pixels in the level2.evt file, extra rows are filled as -1
| Pixel properties | Quadrant properties | ||||||
|---|---|---|---|---|---|---|---|
| Quadrant | DetID | PixID | Counts | Sigma | Mean | Median | Sigma |
| A | 14 | 5 | 131106 | 288.42 | 1864 | 1875 | 448.1 |
| A | 4 | 32 | 53309 | 114.79 | 1864 | 1875 | 448.1 |
| A | 12 | 243 | 11668 | 21.86 | 1864 | 1875 | 448.1 |
| B | 8 | 4 | 591798 | 1284.72 | 1944 | 1951 | 459.1 |
| B | 15 | 22 | 70781 | 149.92 | 1944 | 1951 | 459.1 |
| B | 12 | 52 | 40280 | 83.48 | 1944 | 1951 | 459.1 |
| C | 3 | 9 | 919901 | 1907.86 | 1737 | 1794 | 481.2 |
| C | 15 | 241 | 307406 | 635.07 | 1737 | 1794 | 481.2 |
| C | 3 | 111 | 19640 | 37.08 | 1737 | 1794 | 481.2 |
| D | 15 | 13 | 638107 | 1246.77 | 1650 | 1710 | 510.4 |
| D | 10 | 84 | 69437 | 132.68 | 1650 | 1710 | 510.4 |
| D | 2 | 88 | 33005 | 61.31 | 1650 | 1710 | 510.4 |
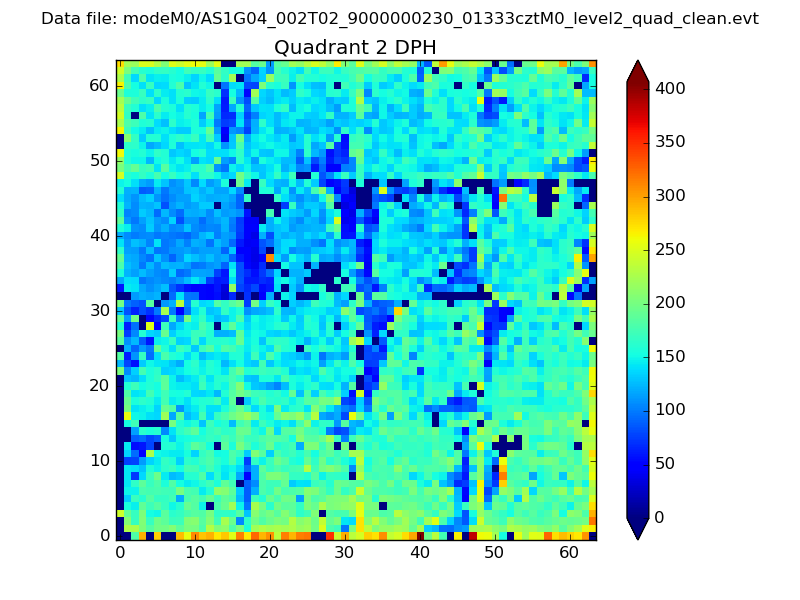
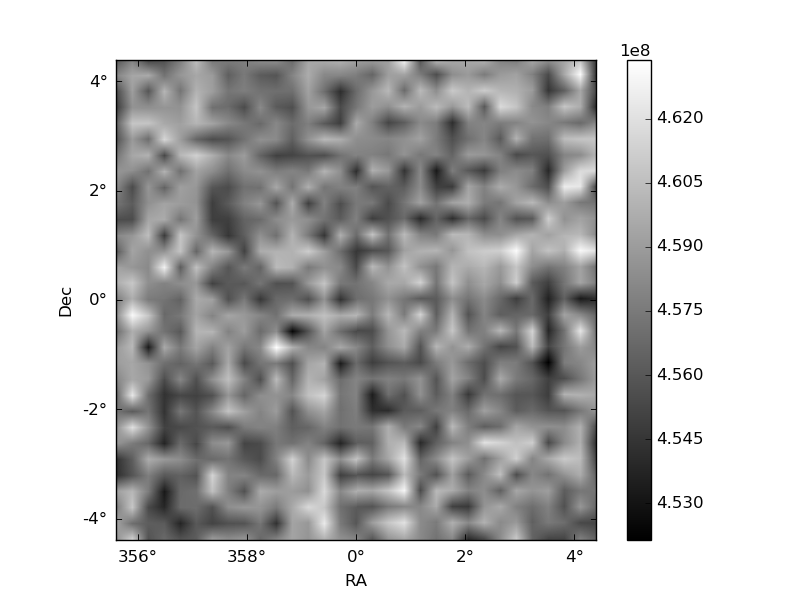
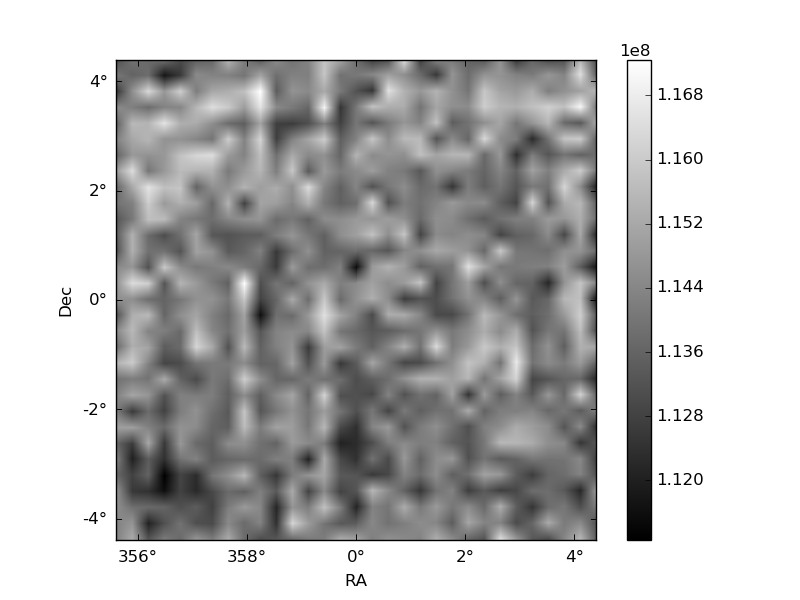
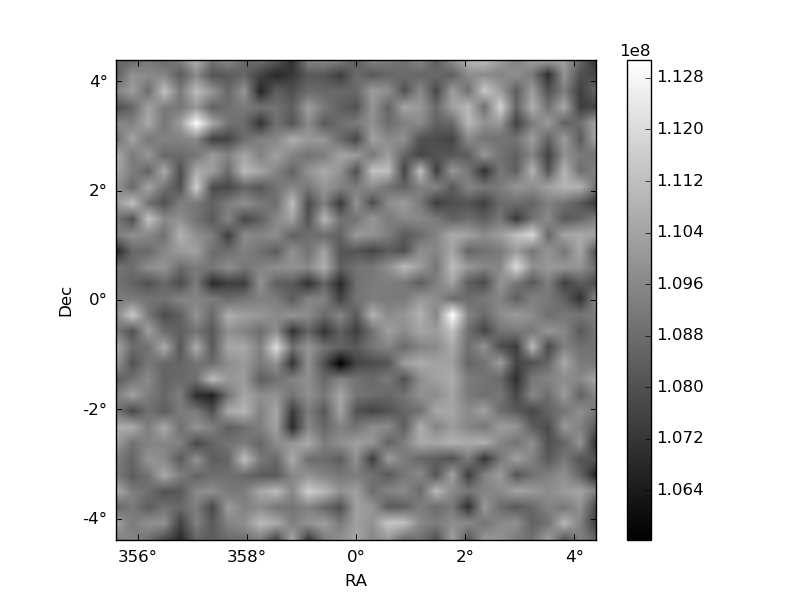
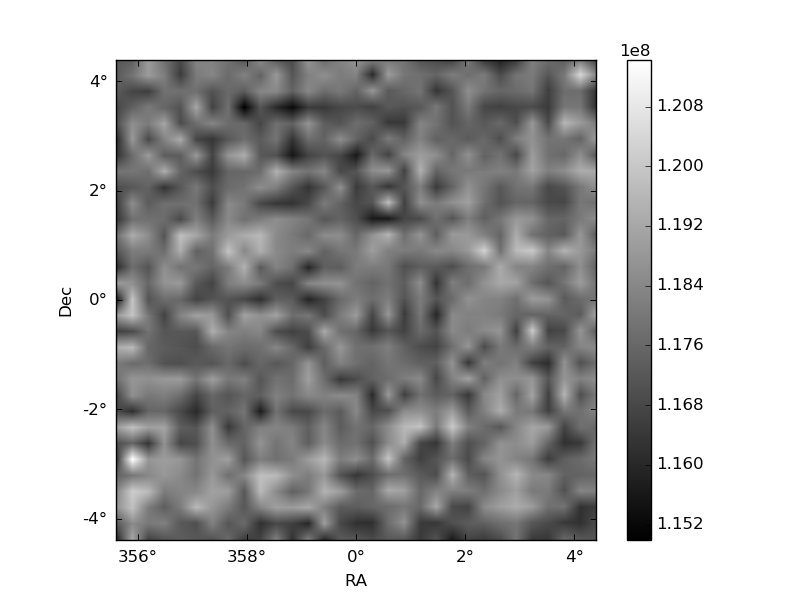
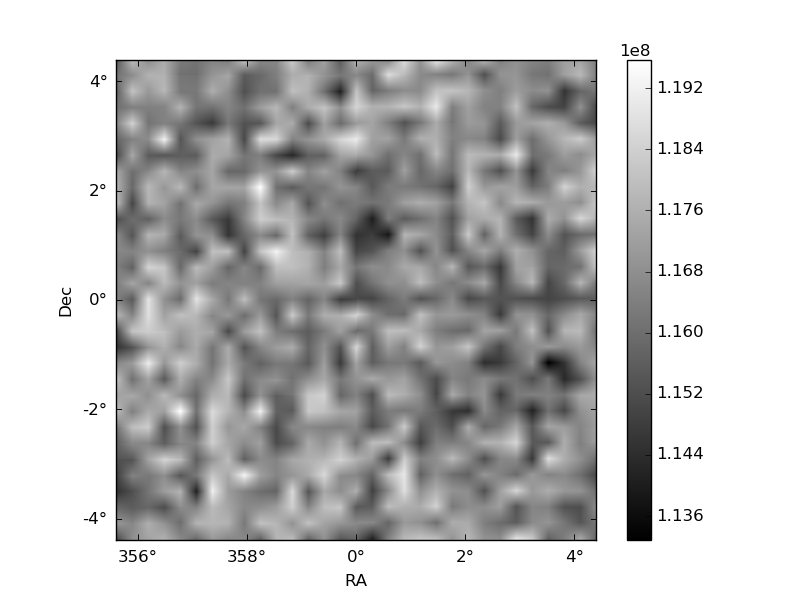
Histogram calculated using DETX and DETY for each event in the final _common_clean file
| Quadrant A | 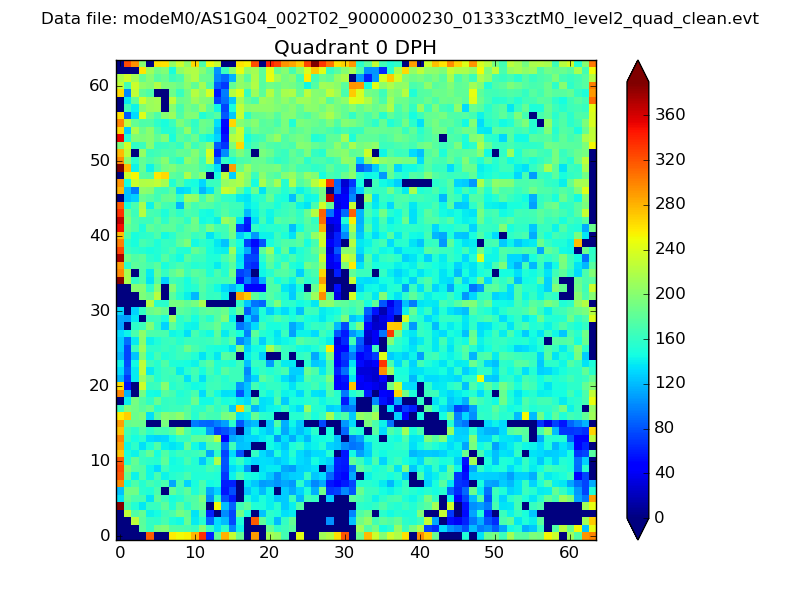 |
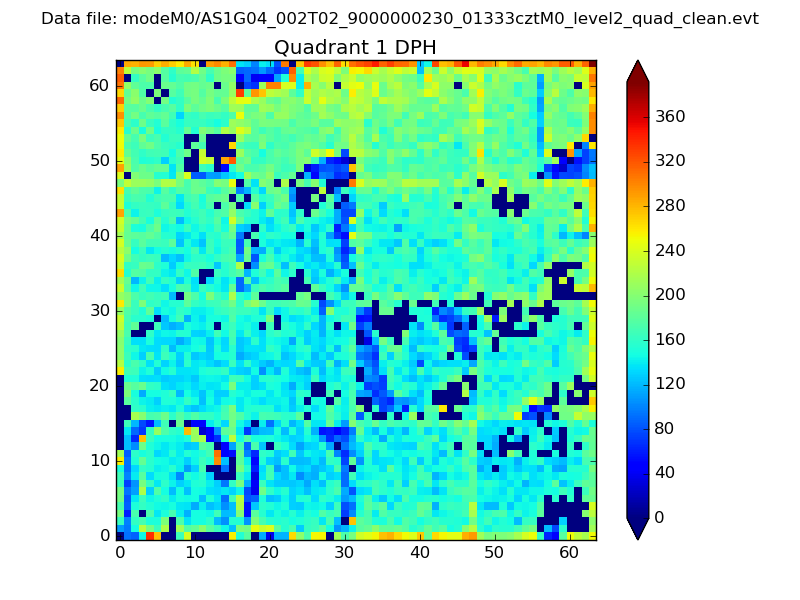 |
Quadrant B |
|---|---|---|---|
| Quadrant D | 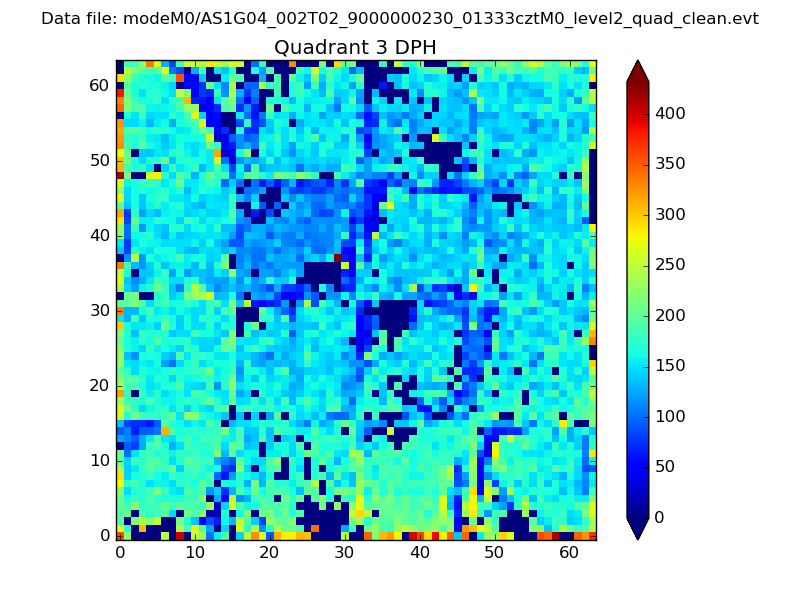 |
 |
Quadrant C |
| Plot type | Count rate plots | Images |
|---|---|---|
| Comparison with Poisson distribution Blue bars denote a histogram of data divided into 1 sec bins. Red curve is a Poisson curve with rate = median count rate of data. |
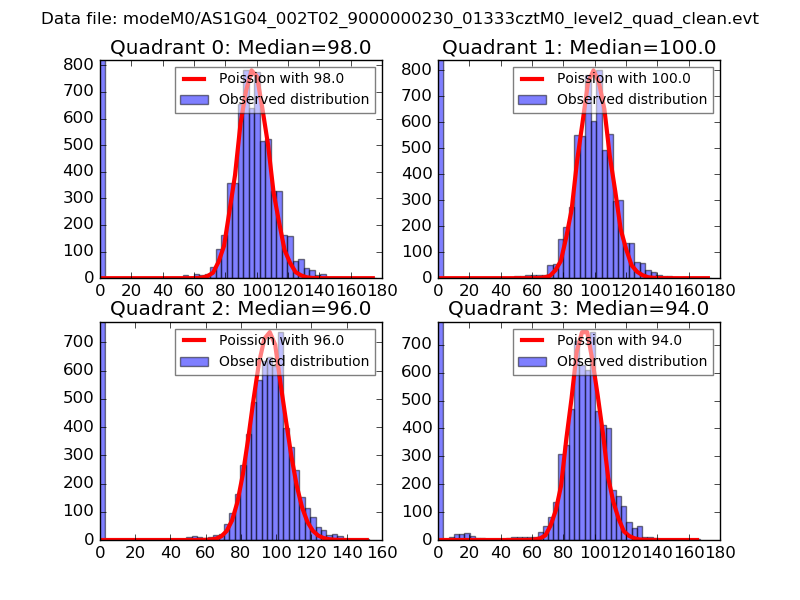 |
 |
| Quadrant-wise count rates Data is divided into 100 sec bins |
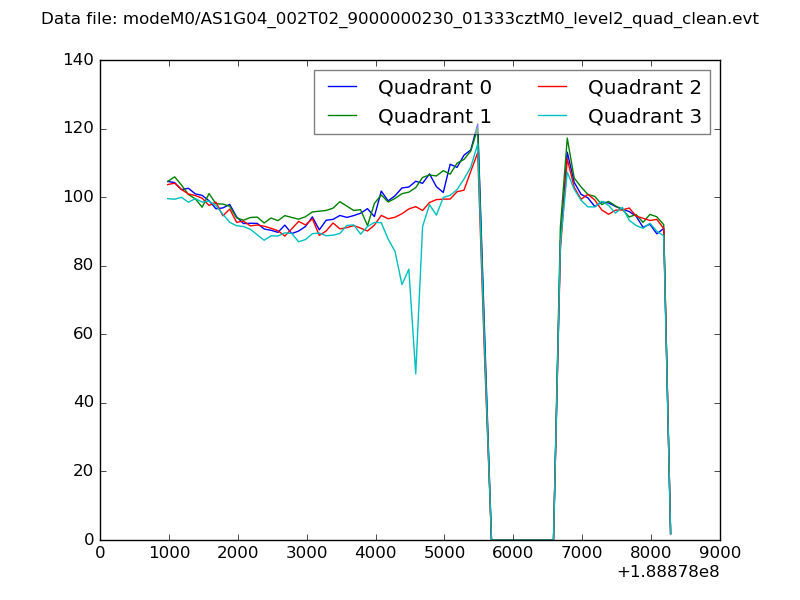 |
|
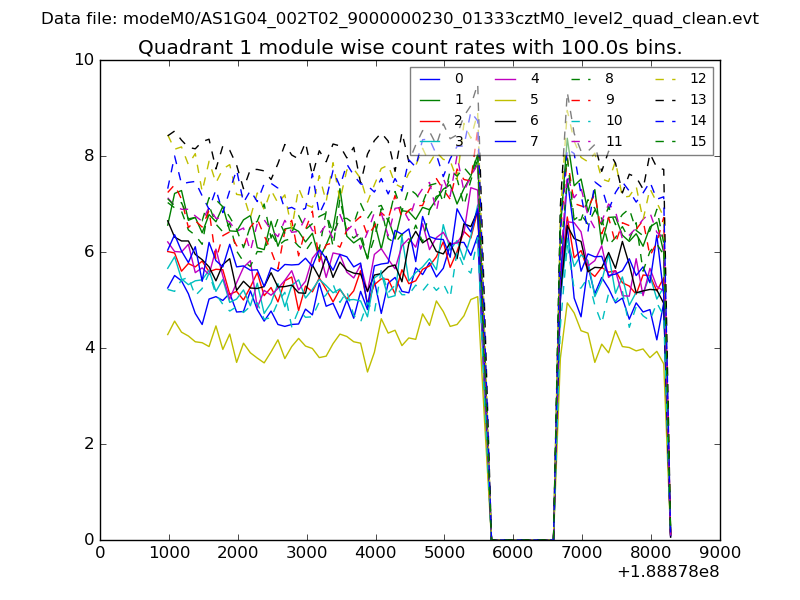
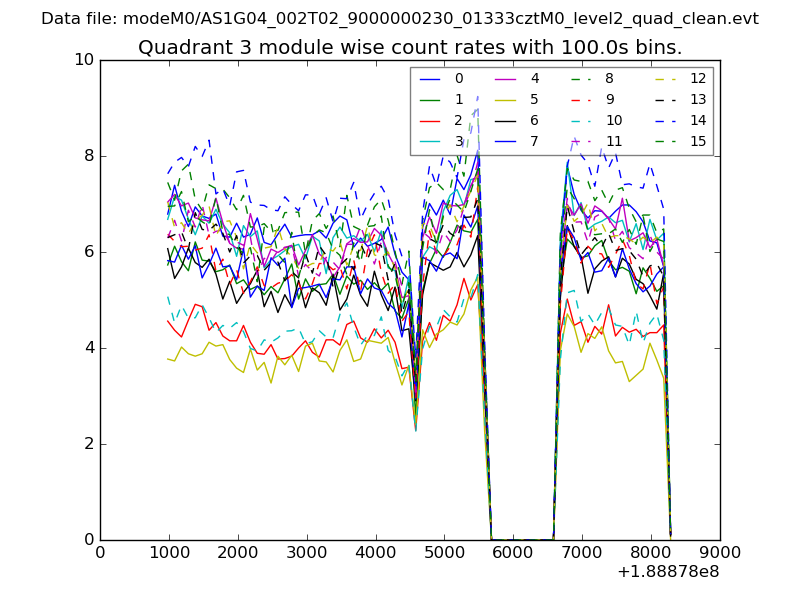
| Module-wise count rates for Quadrant A Data is divided into 100 sec bins |
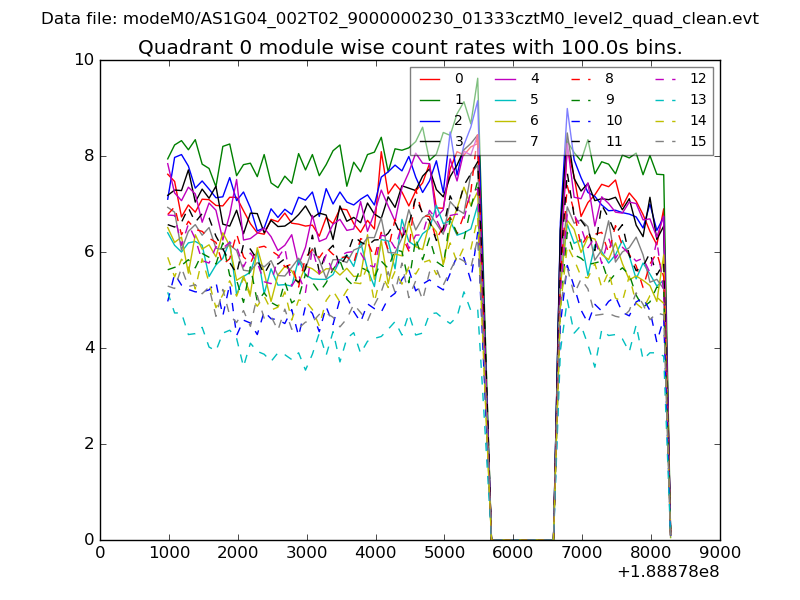 |
 |
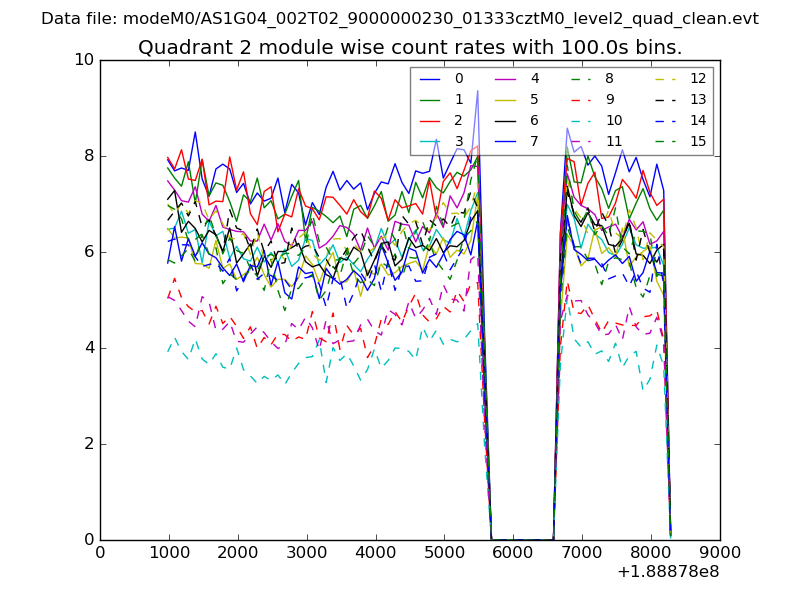
| Module-wise count rates for Quadrant B Data is divided into 100 sec bins |
 |
 |
| Module-wise count rates for Quadrant C Data is divided into 100 sec bins |
 |
 |
| Module-wise count rates for Quadrant D Data is divided into 100 sec bins |
 |
 |
| Parameter | Plot |
|---|---|
| CZT HV Monitor | 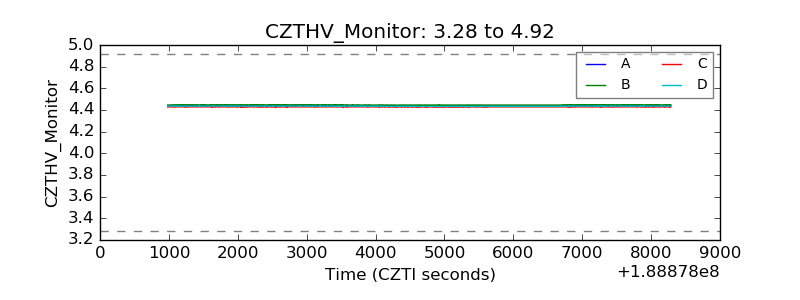 |
| D_VDD | 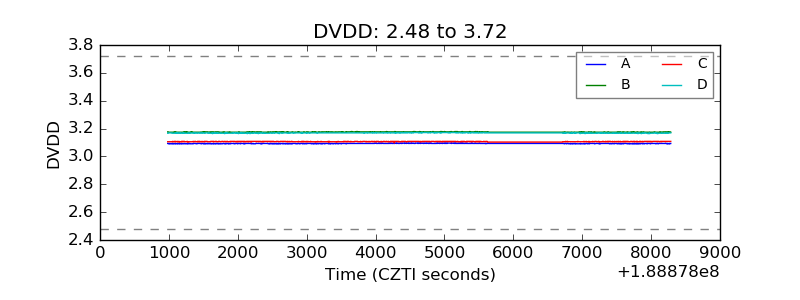 |
| Temperature 1 | 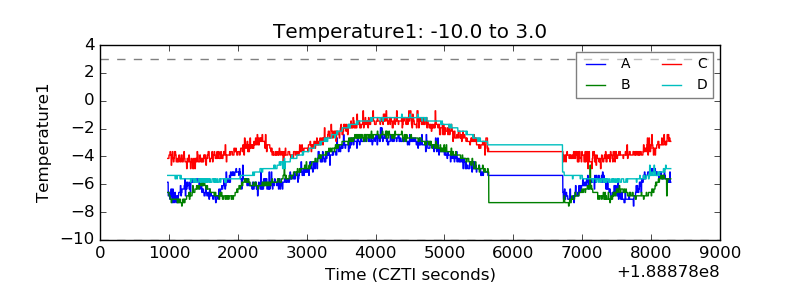 |
| Veto HV Monitor | 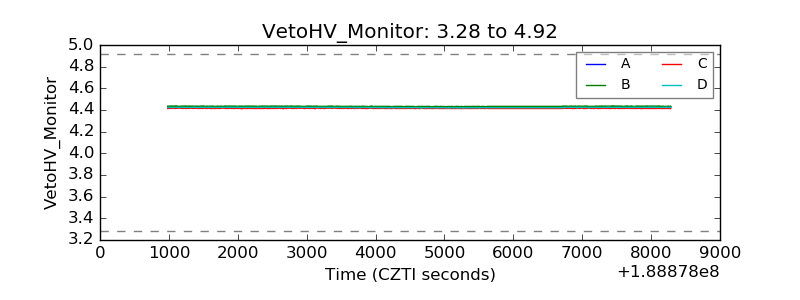 |
| Veto LLD | 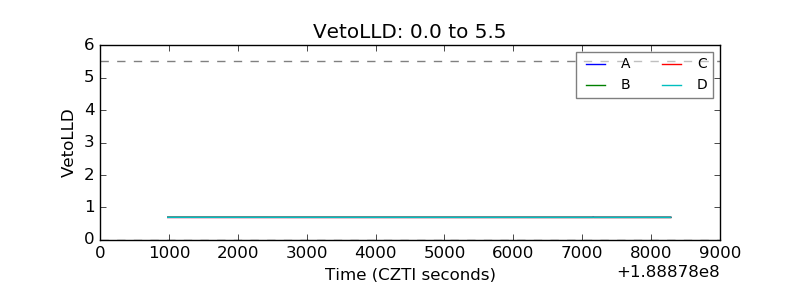 |
| Alpha Counter | 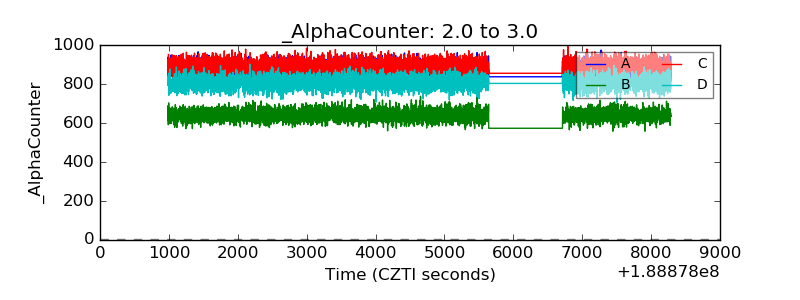 |
| _CPM_Rate | 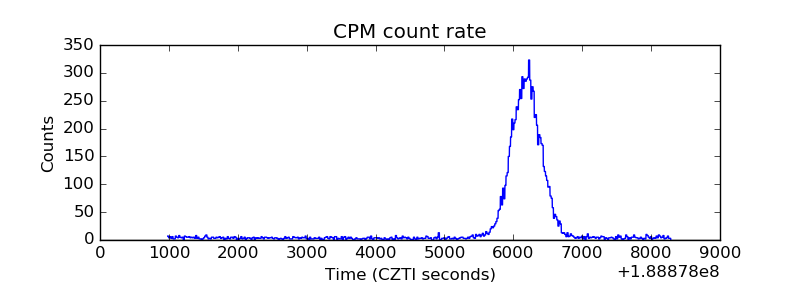 |
| CZT Counter | 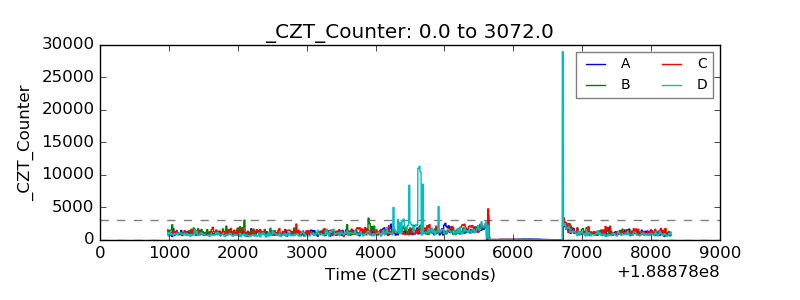 |
| +2.5 Volts monitor |  |
| +5 Volts monitor |  |
| _ROLL_ROT | 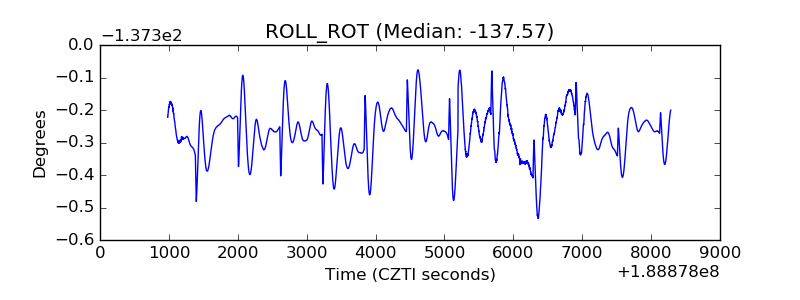 |
| _Roll_DEC | 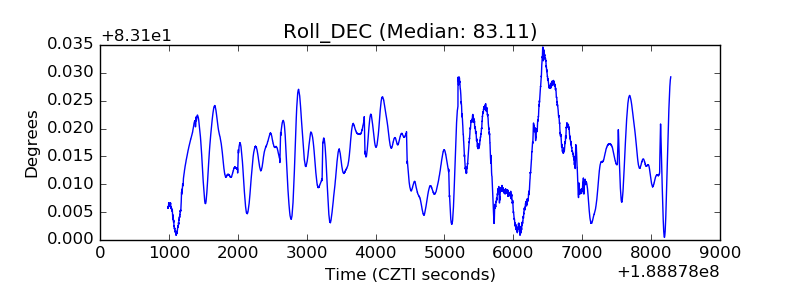 |
| _Roll_RA | 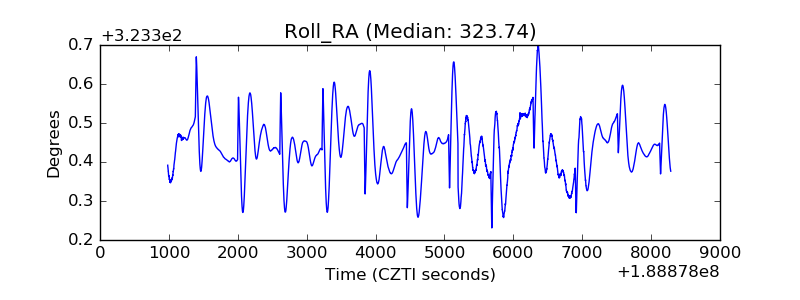 |
| Veto Counter | 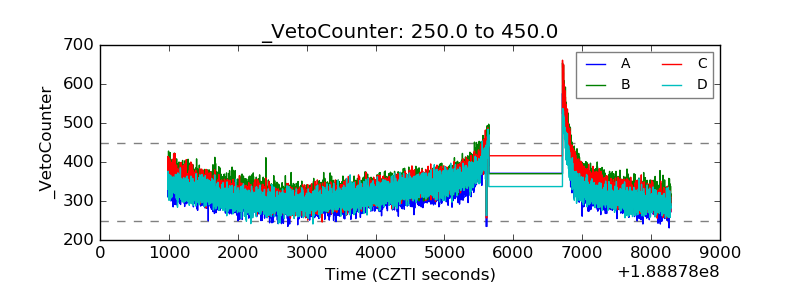 |