| Param | Original file | Final file |
|---|---|---|
| Filename | modeM0/AS1G04_002T02_9000000230_01334cztM0_level2.evt | modeM0/AS1G04_002T02_9000000230_01334cztM0_level2_quad_clean.evt |
| Size (bytes) | 1,062,443,520 | 98,784,000 |
| Size | 1013.2 MB | 94.2 MB |
| Events in quadrant A | 7,919,232 | 641,078 |
| Events in quadrant B | 8,279,878 | 645,511 |
| Events in quadrant C | 8,201,790 | 629,952 |
| Events in quadrant D | 7,338,160 | 615,445 |
| Mode M9 | |||
|---|---|---|---|
| Quadrant | BADHDUFLAG | Total packets | Discarded packets |
| A | 0 | 7 | 0 |
| B | 0 | 7 | 0 |
| C | 0 | 7 | 0 |
| D | 0 | 7 | 0 |
| Mode M0 | |||
|---|---|---|---|
| Quadrant | BADHDUFLAG | Total packets | Discarded packets |
| A | 0 | 28191 | 2 |
| B | 0 | 29306 | 1 |
| C | 0 | 28994 | 1 |
| D | 0 | 26551 | 1 |
| Mode SS | |||
|---|---|---|---|
| Quadrant | BADHDUFLAG | Total packets | Discarded packets |
| A | 0 | 136 | 0 |
| B | 0 | 136 | 0 |
| C | 0 | 136 | 0 |
| D | 0 | 136 | 0 |
| Quadrant | Total seconds | Saturated seconds | Saturation percentage |
|---|---|---|---|
| A | 6584 | 20 | 0.303767% |
| B | 6584 | 35 | 0.531592% |
| C | 6584 | 14 | 0.212637% |
| D | 6584 | 144 | 2.187120% |
Noise dominated data is calculated using 1-second bins in cleaned event files. If a bin has >2000 counts, and if more than 50% of those come from <1% of pixels, then it is considered to be noise-dominated and hence unusable.
| Quadrant | # 1 sec bins | Bins with >0 counts | Bins with >2000 counts | High rate bins dominated by noise | Noise dominated (total time) | Noise dominated (detector-on time) | Marked lightcurve |
|---|---|---|---|---|---|---|---|
| A | 7334 | 6585 | 262 | 262 | 3.57% | 3.98% | 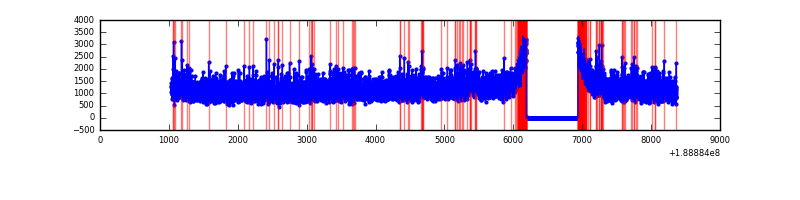 |
| B | 7334 | 6585 | 323 | 323 | 4.40% | 4.91% | 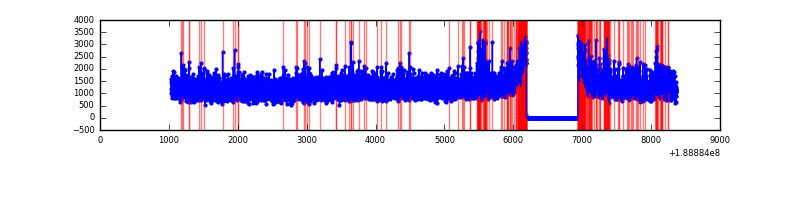 |
| C | 7334 | 6585 | 294 | 294 | 4.01% | 4.46% | 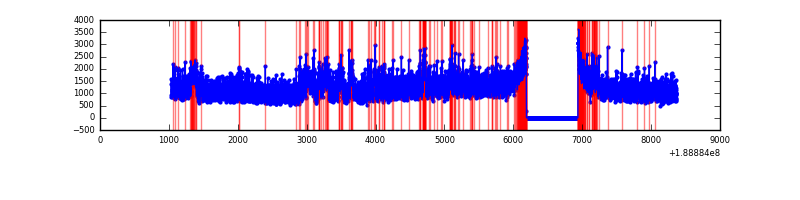 |
| D | 7334 | 6585 | 355 | 355 | 4.84% | 5.39% | 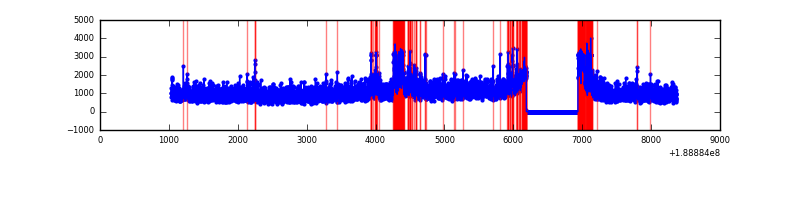 |
Top three noisy pixels from each quadrant. If the there are fewer than three noisy pixels in the level2.evt file, extra rows are filled as -1
| Pixel properties | Quadrant properties | ||||||
|---|---|---|---|---|---|---|---|
| Quadrant | DetID | PixID | Counts | Sigma | Mean | Median | Sigma |
| A | 4 | 32 | 113478 | 231.55 | 1991 | 2002 | 481.4 |
| A | 15 | 233 | 71100 | 143.52 | 1991 | 2002 | 481.4 |
| A | 12 | 243 | 49398 | 98.45 | 1991 | 2002 | 481.4 |
| B | 8 | 4 | 195367 | 394.4 | 2070 | 2076 | 490.1 |
| B | 5 | 249 | 68672 | 135.89 | 2070 | 2076 | 490.1 |
| B | 15 | 22 | 66225 | 130.89 | 2070 | 2076 | 490.1 |
| C | 3 | 9 | 561758 | 1078.46 | 1859 | 1919 | 519.1 |
| C | 15 | 241 | 323521 | 619.53 | 1859 | 1919 | 519.1 |
| C | 3 | 111 | 21659 | 38.03 | 1859 | 1919 | 519.1 |
| D | 1 | 83 | 334889 | 600.86 | 1775 | 1834 | 554.3 |
| D | 10 | 84 | 289272 | 518.56 | 1775 | 1834 | 554.3 |
| D | 10 | 125 | 30096 | 50.99 | 1775 | 1834 | 554.3 |
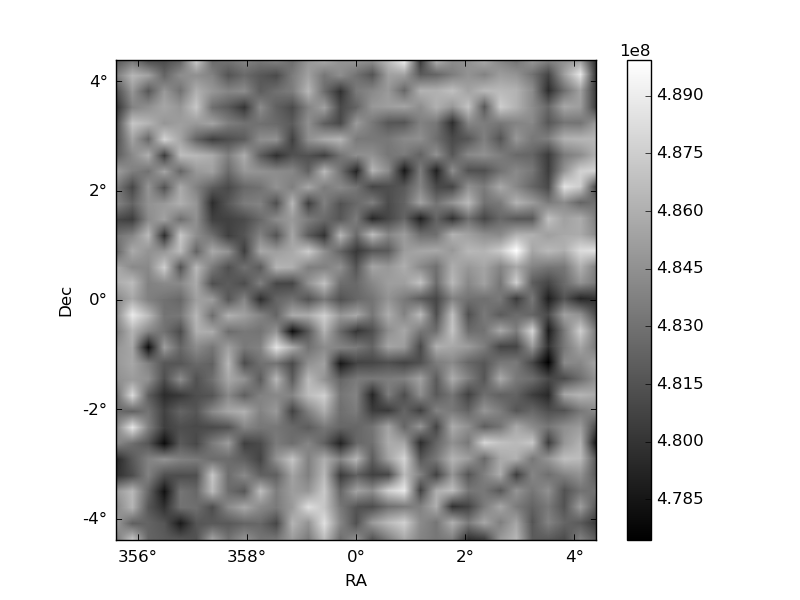
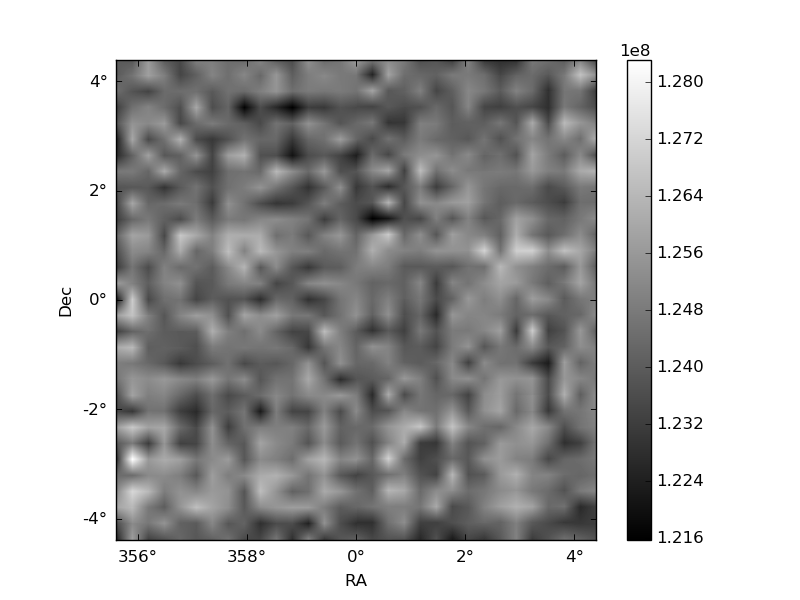
Histogram calculated using DETX and DETY for each event in the final _common_clean file
| Quadrant A | 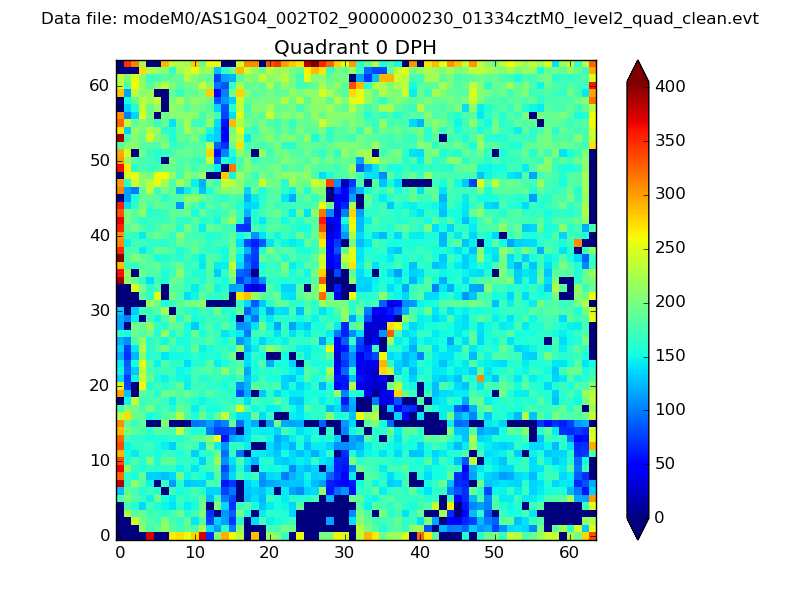 |
 |
Quadrant B |
|---|---|---|---|
| Quadrant D | 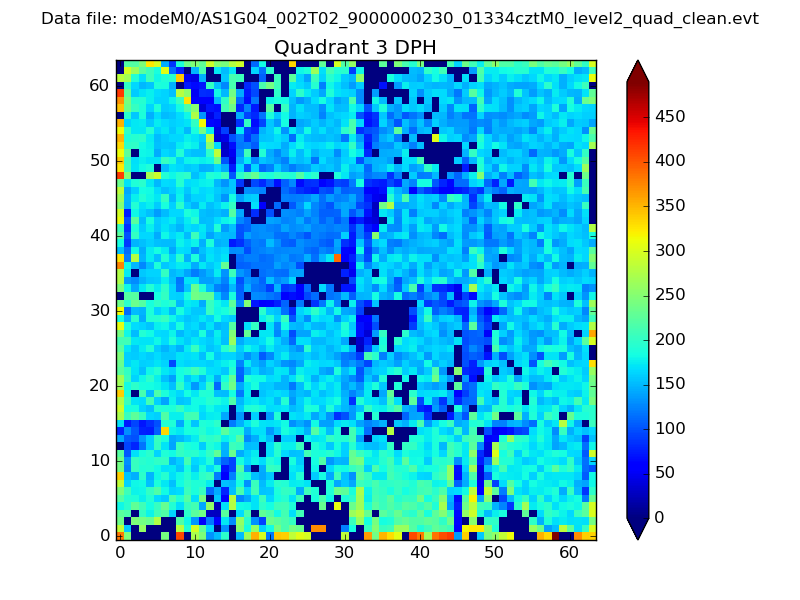 |
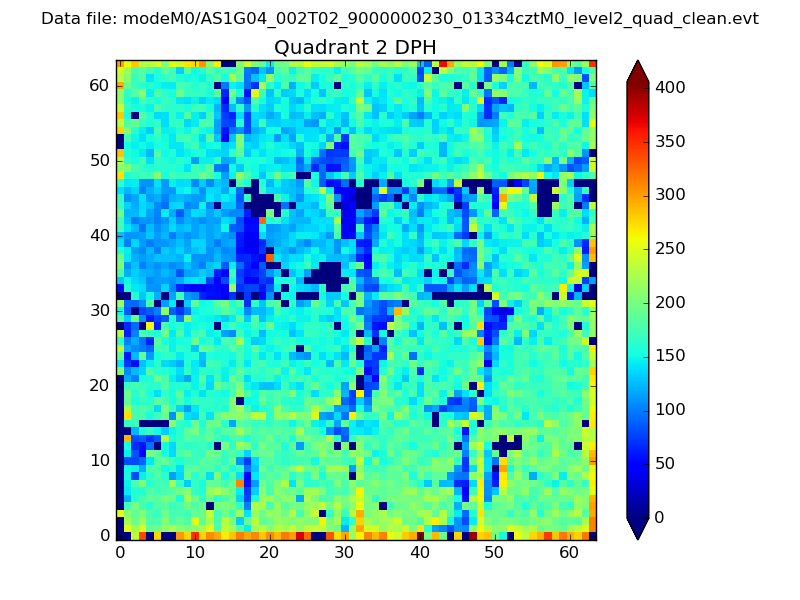 |
Quadrant C |
| Plot type | Count rate plots | Images |
|---|---|---|
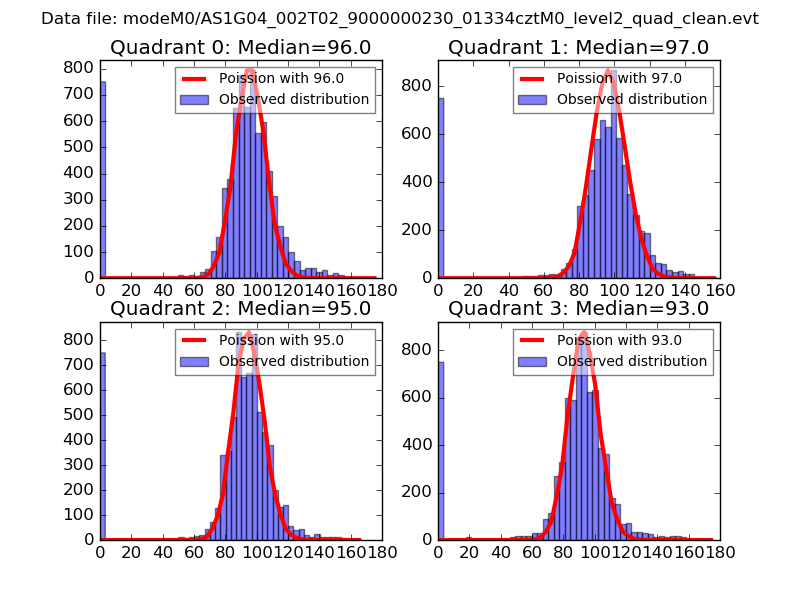
| Comparison with Poisson distribution Blue bars denote a histogram of data divided into 1 sec bins. Red curve is a Poisson curve with rate = median count rate of data. |
 |
 |
| Quadrant-wise count rates Data is divided into 100 sec bins |
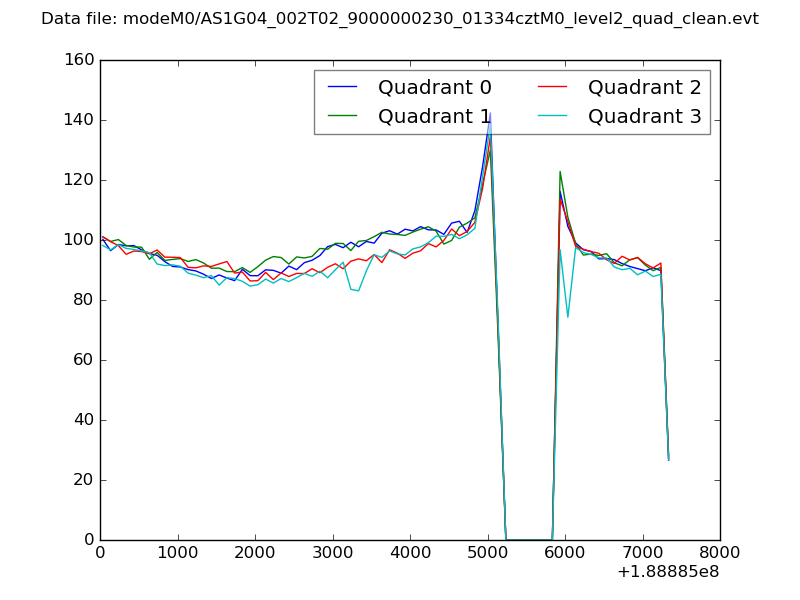 |
|
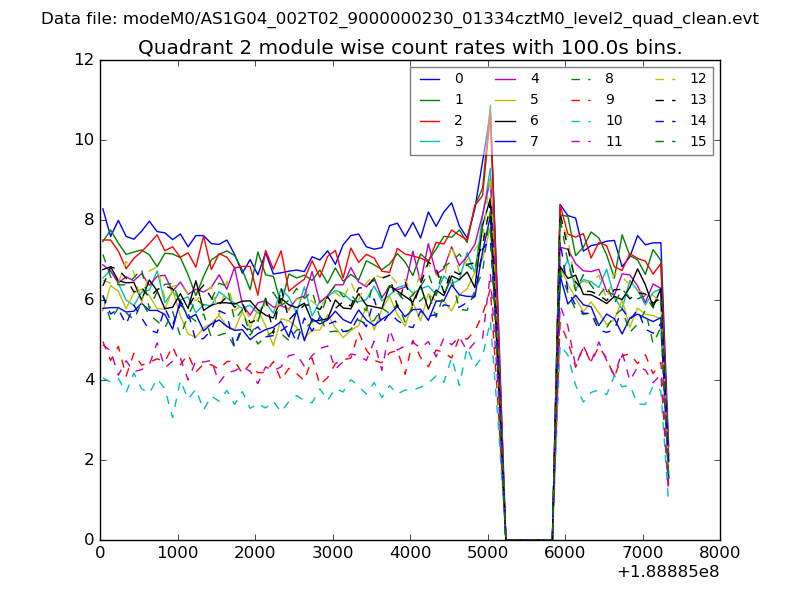
| Module-wise count rates for Quadrant A Data is divided into 100 sec bins |
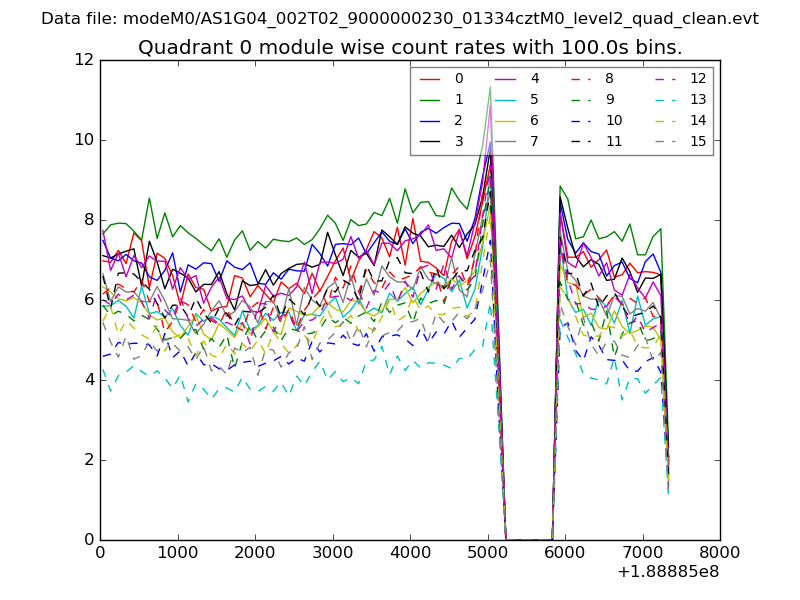 |
 |
| Module-wise count rates for Quadrant B Data is divided into 100 sec bins |
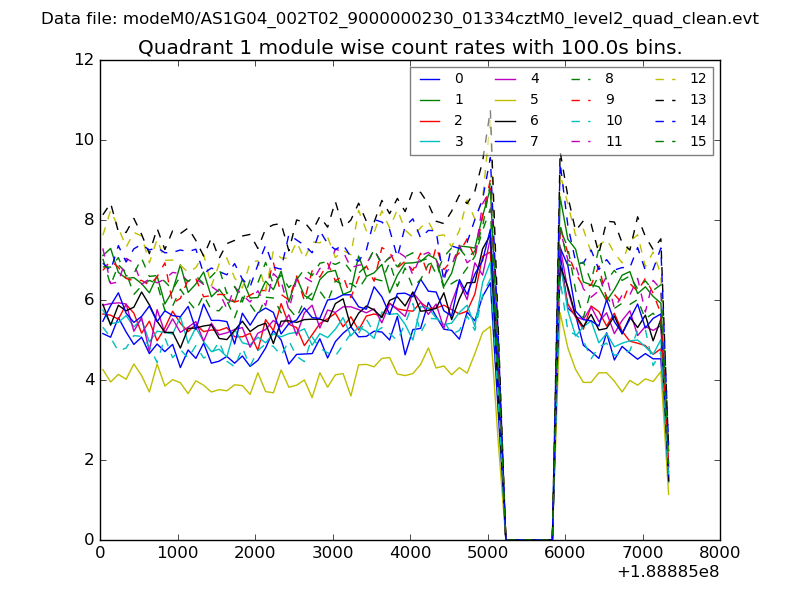 |
 |
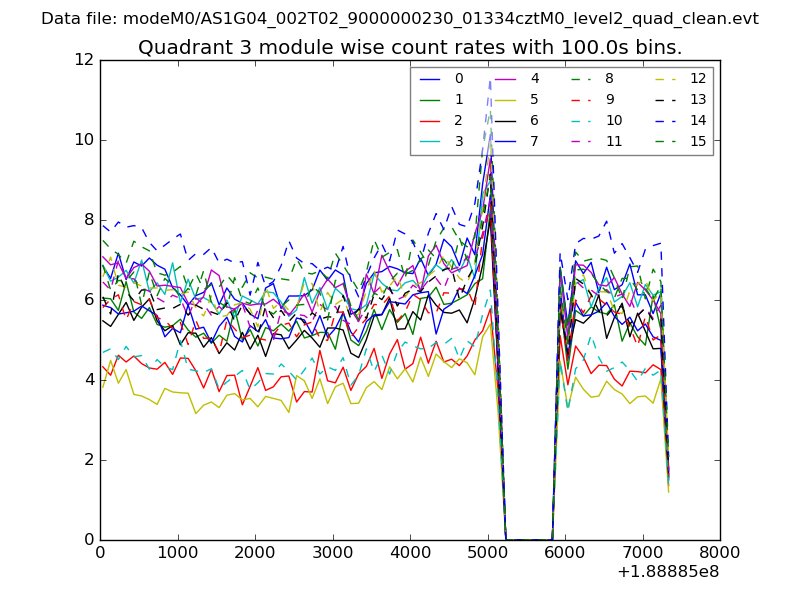
| Module-wise count rates for Quadrant C Data is divided into 100 sec bins |
 |
 |
| Module-wise count rates for Quadrant D Data is divided into 100 sec bins |
 |
 |
| Parameter | Plot |
|---|---|
| CZT HV Monitor | 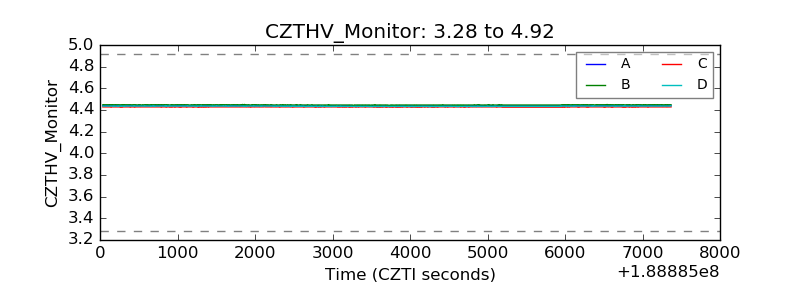 |
| D_VDD | 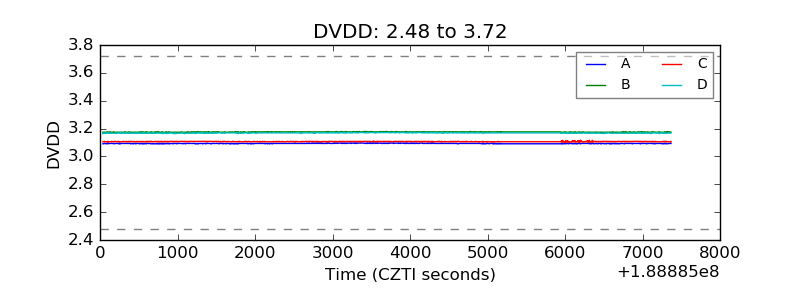 |
| Temperature 1 | 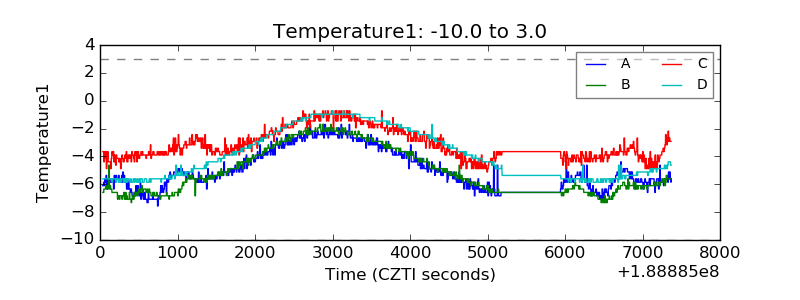 |
| Veto HV Monitor | 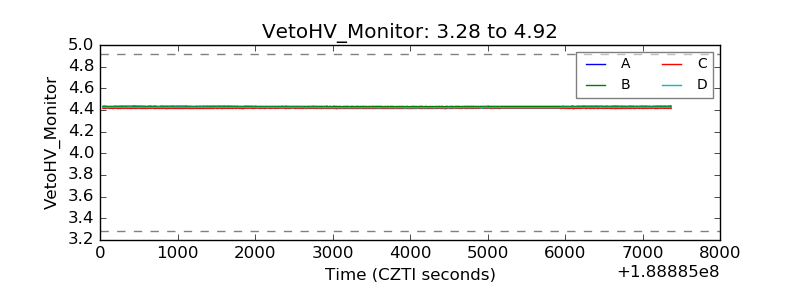 |
| Veto LLD |  |
| Alpha Counter | 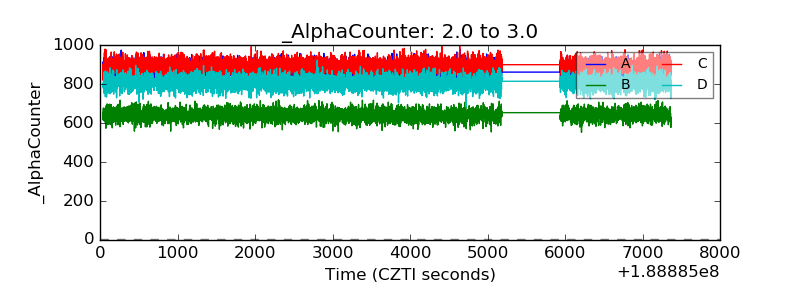 |
| _CPM_Rate | 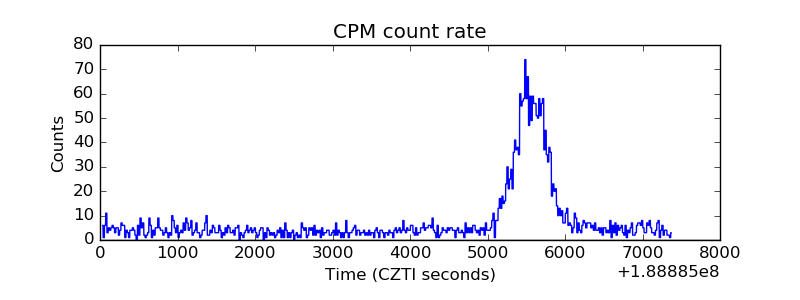 |
| CZT Counter | 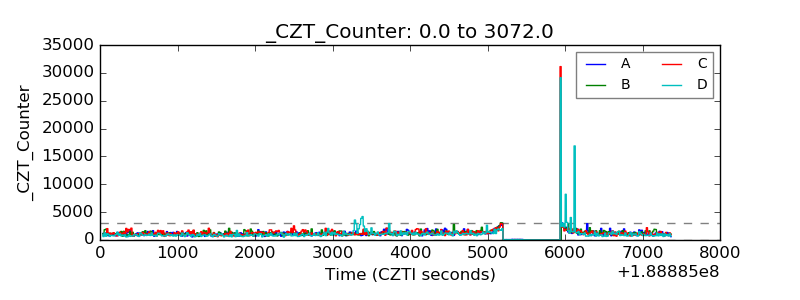 |
| +2.5 Volts monitor |  |
| +5 Volts monitor |  |
| _ROLL_ROT | 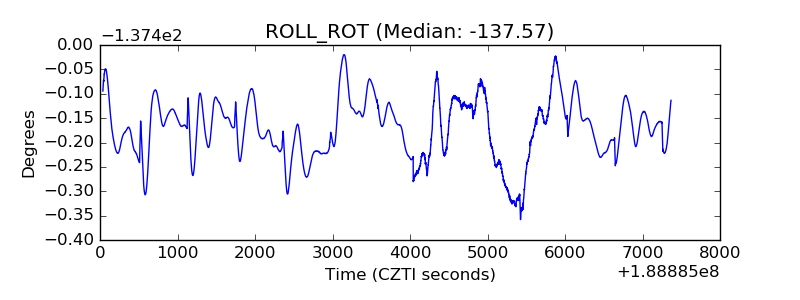 |
| _Roll_DEC | 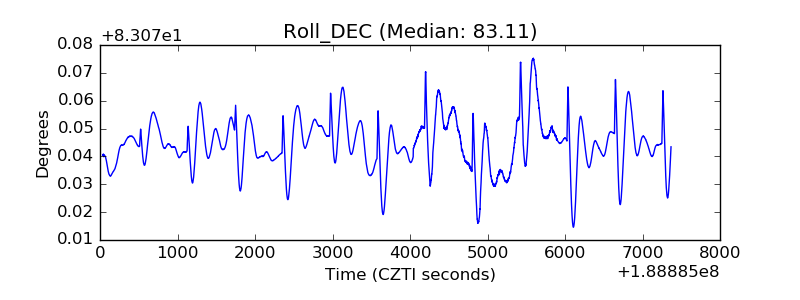 |
| _Roll_RA | 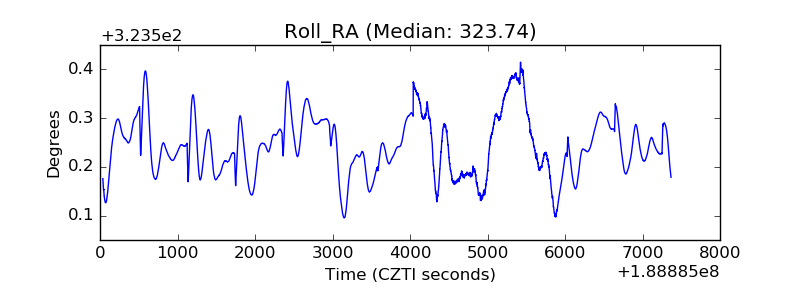 |
| Veto Counter | 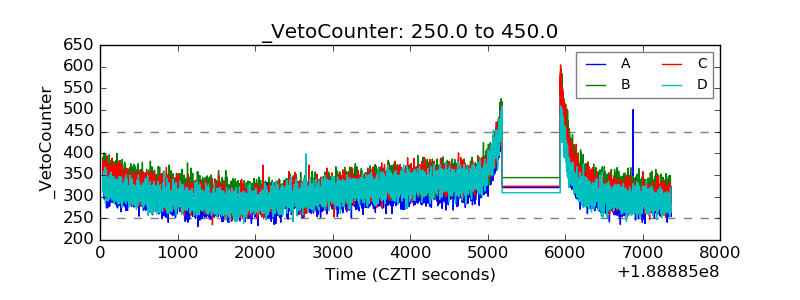 |