| Param | Original file | Final file |
|---|---|---|
| Filename | modeM0/AS1G04_002T02_9000000230_01335cztM0_level2.evt | modeM0/AS1G04_002T02_9000000230_01335cztM0_level2_quad_clean.evt |
| Size (bytes) | 1,292,538,240 | 113,149,440 |
| Size | 1.2 GB | 107.9 MB |
| Events in quadrant A | 9,696,700 | 733,297 |
| Events in quadrant B | 10,816,730 | 735,630 |
| Events in quadrant C | 9,342,427 | 723,651 |
| Events in quadrant D | 8,788,509 | 707,479 |
| Mode M0 | |||
|---|---|---|---|
| Quadrant | BADHDUFLAG | Total packets | Discarded packets |
| A | 0 | 34174 | 2 |
| B | 0 | 37506 | 1 |
| C | 0 | 33145 | 1 |
| D | 0 | 31524 | 1 |
| Mode SS | |||
|---|---|---|---|
| Quadrant | BADHDUFLAG | Total packets | Discarded packets |
| A | 0 | 152 | 0 |
| B | 0 | 152 | 0 |
| C | 0 | 152 | 0 |
| D | 0 | 152 | 0 |
| Quadrant | Total seconds | Saturated seconds | Saturation percentage |
|---|---|---|---|
| A | 7567 | 147 | 1.942646% |
| B | 7567 | 107 | 1.414035% |
| C | 7567 | 19 | 0.251090% |
| D | 7567 | 108 | 1.427250% |
Noise dominated data is calculated using 1-second bins in cleaned event files. If a bin has >2000 counts, and if more than 50% of those come from <1% of pixels, then it is considered to be noise-dominated and hence unusable.
| Quadrant | # 1 sec bins | Bins with >0 counts | Bins with >2000 counts | High rate bins dominated by noise | Noise dominated (total time) | Noise dominated (detector-on time) | Marked lightcurve |
|---|---|---|---|---|---|---|---|
| A | 7607 | 7568 | 558 | 558 | 7.34% | 7.37% | 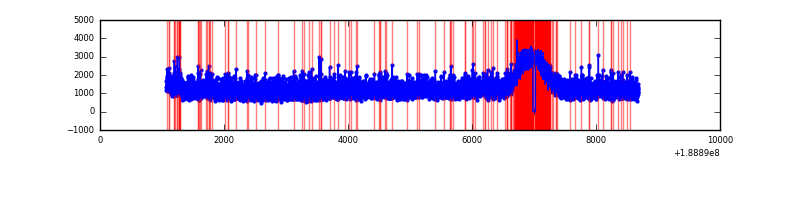 |
| B | 7607 | 7568 | 904 | 904 | 11.88% | 11.95% | 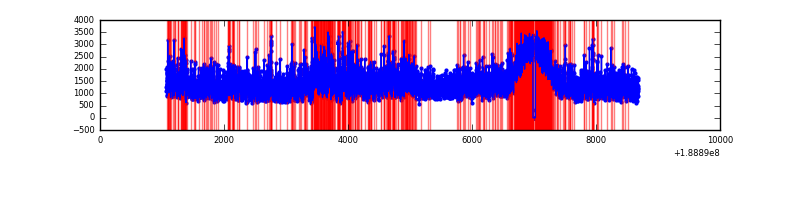 |
| C | 7607 | 7568 | 484 | 484 | 6.36% | 6.40% | 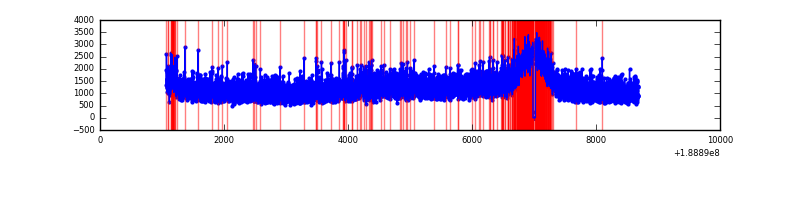 |
| D | 7607 | 7568 | 521 | 521 | 6.85% | 6.88% | 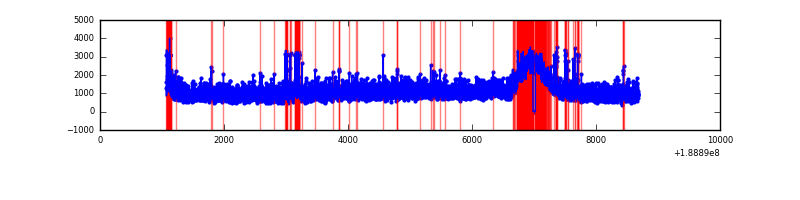 |
Top three noisy pixels from each quadrant. If the there are fewer than three noisy pixels in the level2.evt file, extra rows are filled as -1
| Pixel properties | Quadrant properties | ||||||
|---|---|---|---|---|---|---|---|
| Quadrant | DetID | PixID | Counts | Sigma | Mean | Median | Sigma |
| A | 4 | 32 | 159646 | 262.9 | 2449 | 2463 | 597.9 |
| A | 15 | 127 | 101655 | 165.9 | 2449 | 2463 | 597.9 |
| A | 0 | 214 | 19474 | 28.45 | 2449 | 2463 | 597.9 |
| B | 8 | 4 | 635224 | 1056.29 | 2506 | 2516 | 599.0 |
| B | 6 | 53 | 328146 | 543.63 | 2506 | 2516 | 599.0 |
| B | 5 | 249 | 206495 | 340.54 | 2506 | 2516 | 599.0 |
| C | 15 | 241 | 363500 | 572.31 | 2246 | 2321 | 631.1 |
| C | 3 | 9 | 147328 | 229.77 | 2246 | 2321 | 631.1 |
| C | 3 | 79 | 29315 | 42.77 | 2246 | 2321 | 631.1 |
| D | 1 | 83 | 146122 | 217.25 | 2235 | 2289 | 662.1 |
| D | 13 | 252 | 117138 | 173.47 | 2235 | 2289 | 662.1 |
| D | 10 | 84 | 45543 | 65.33 | 2235 | 2289 | 662.1 |
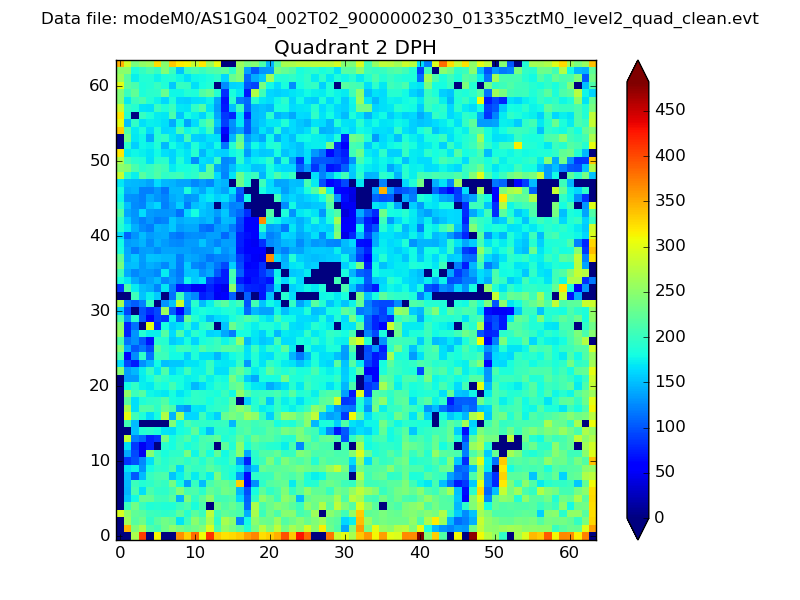
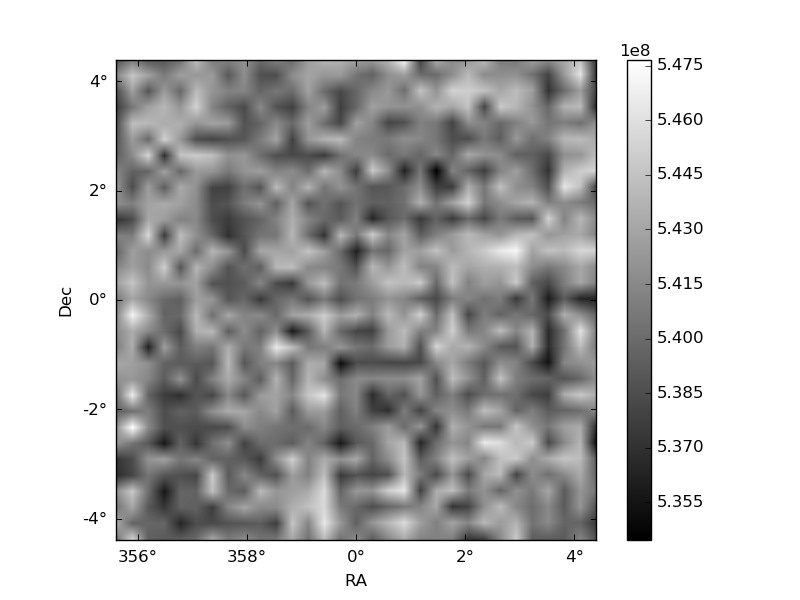
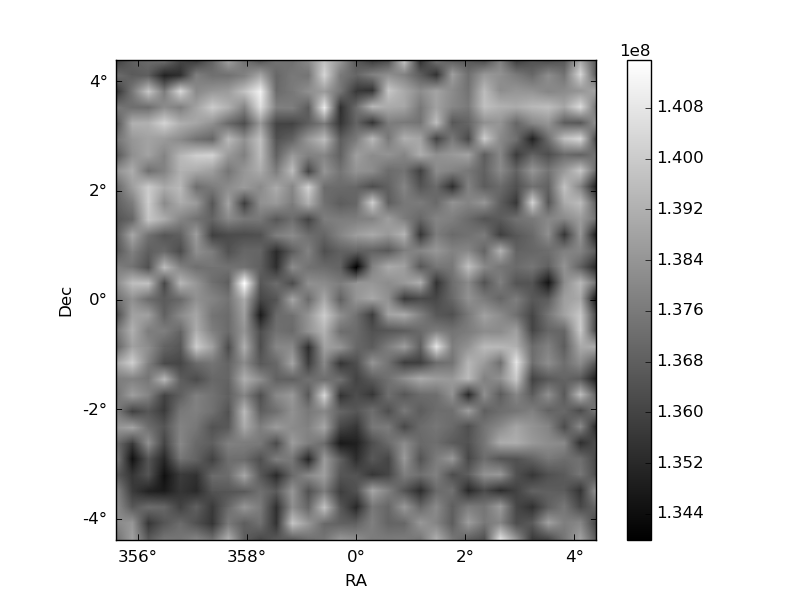
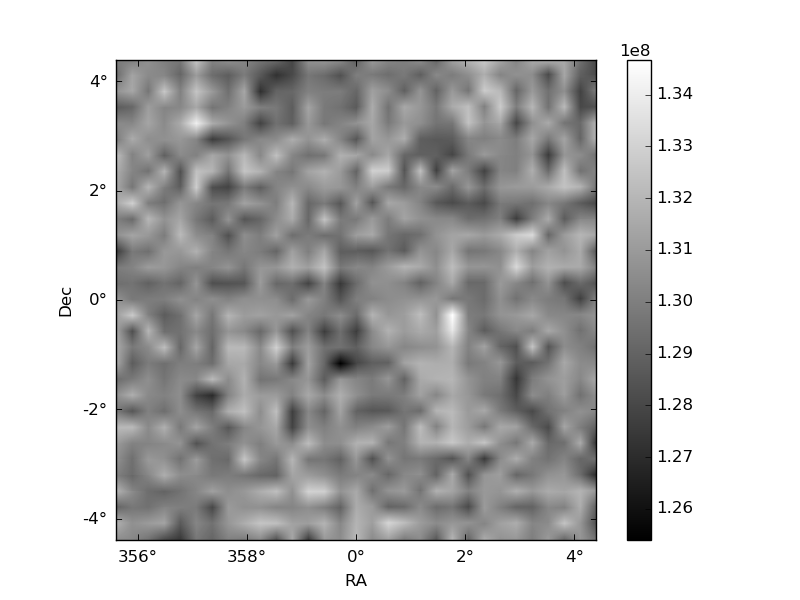
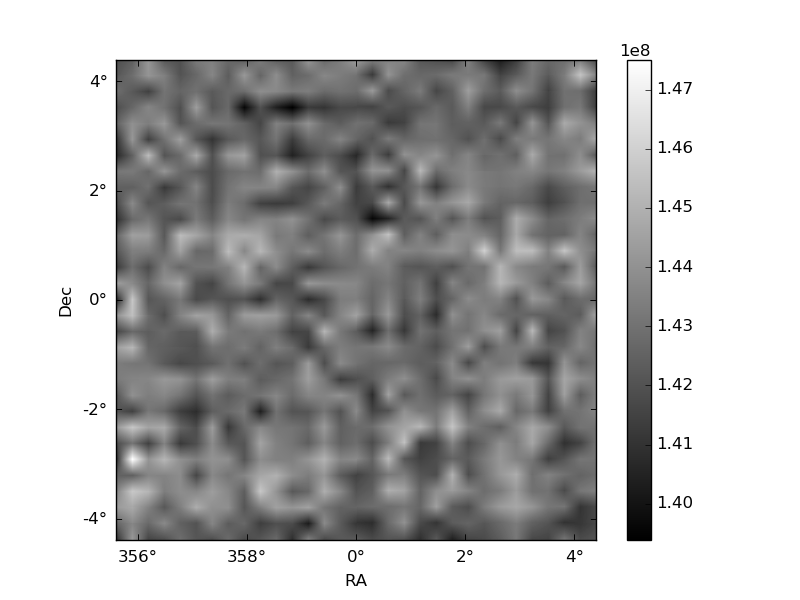
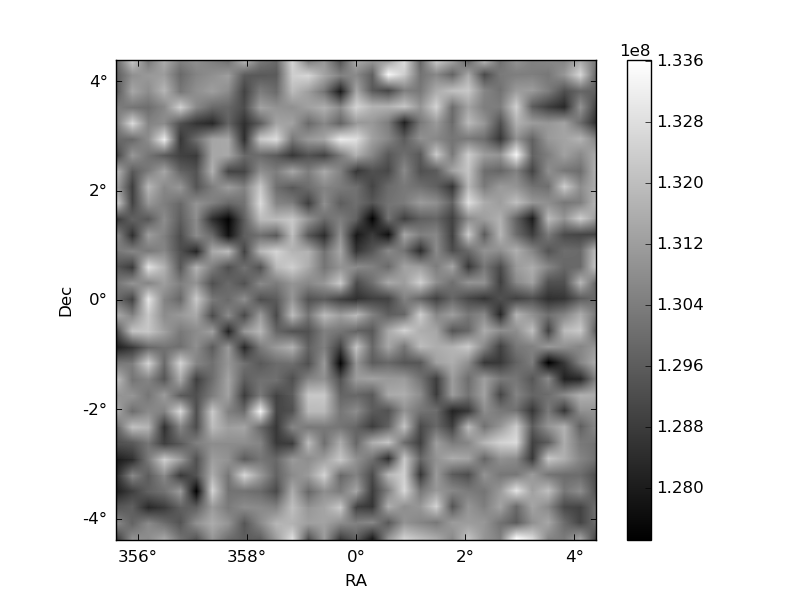
Histogram calculated using DETX and DETY for each event in the final _common_clean file
| Quadrant A | 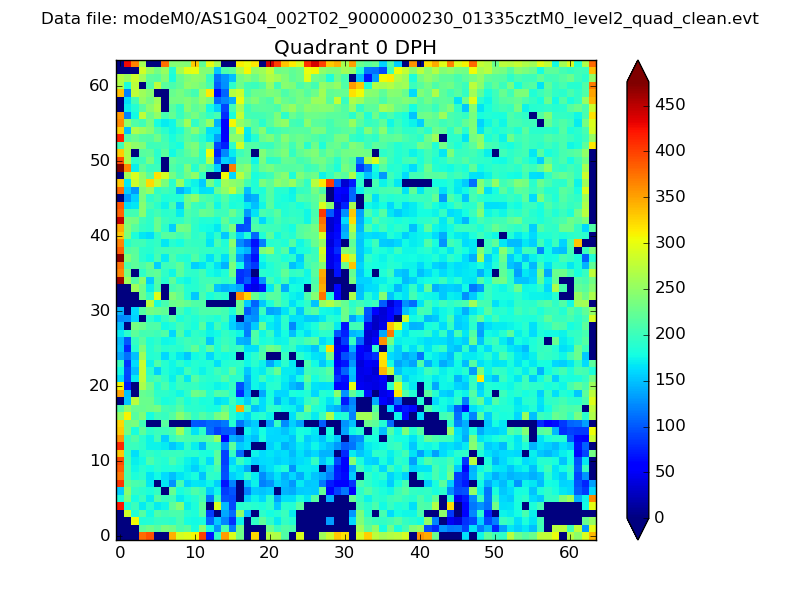 |
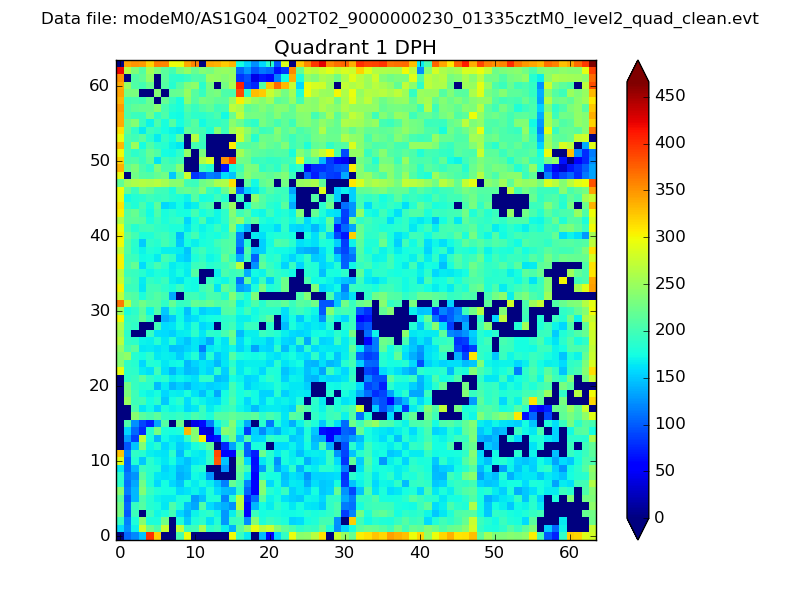 |
Quadrant B |
|---|---|---|---|
| Quadrant D | 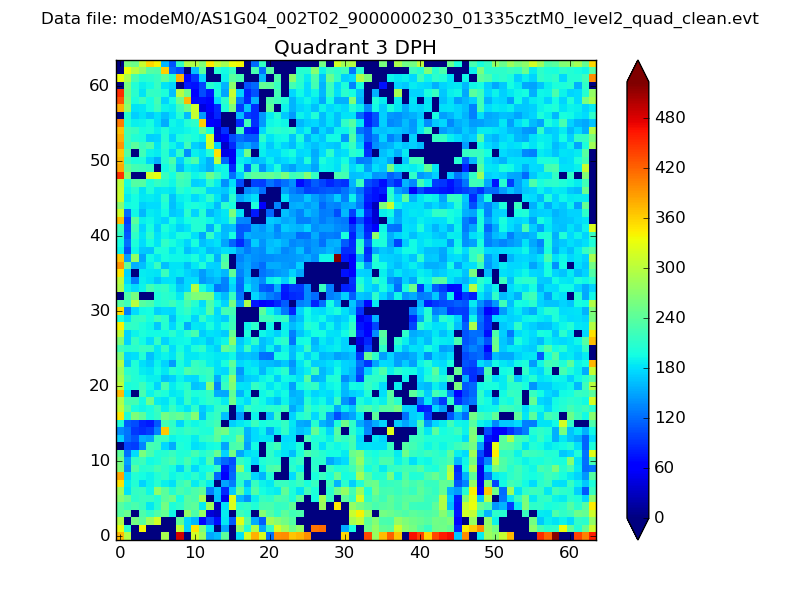 |
 |
Quadrant C |
| Plot type | Count rate plots | Images |
|---|---|---|
| Comparison with Poisson distribution Blue bars denote a histogram of data divided into 1 sec bins. Red curve is a Poisson curve with rate = median count rate of data. |
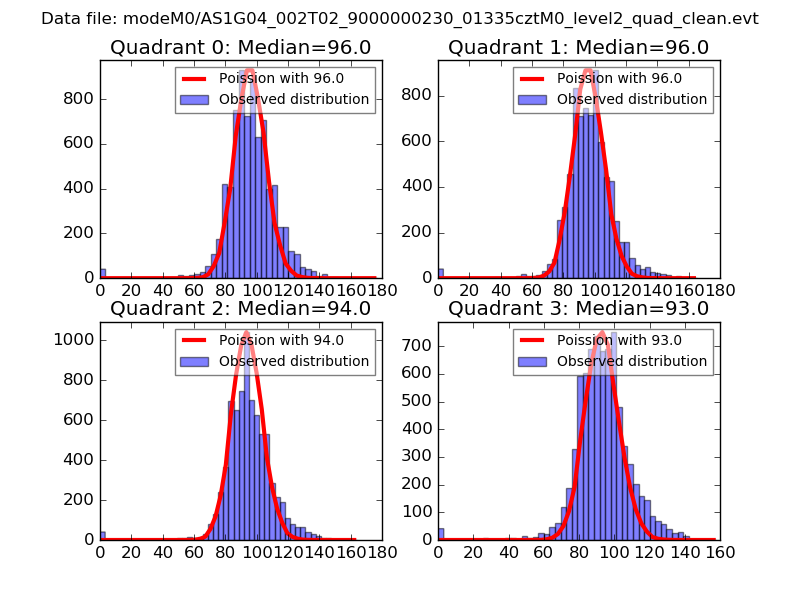 |
 |
| Quadrant-wise count rates Data is divided into 100 sec bins |
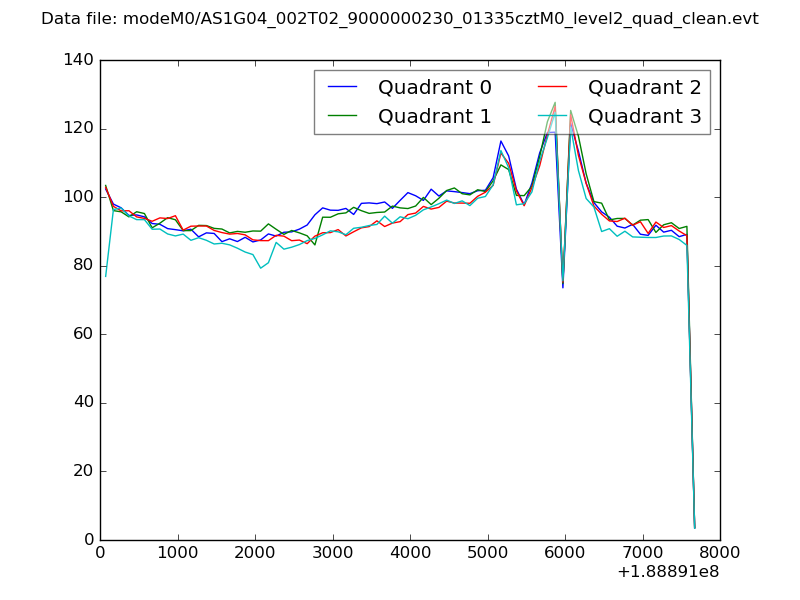 |
|
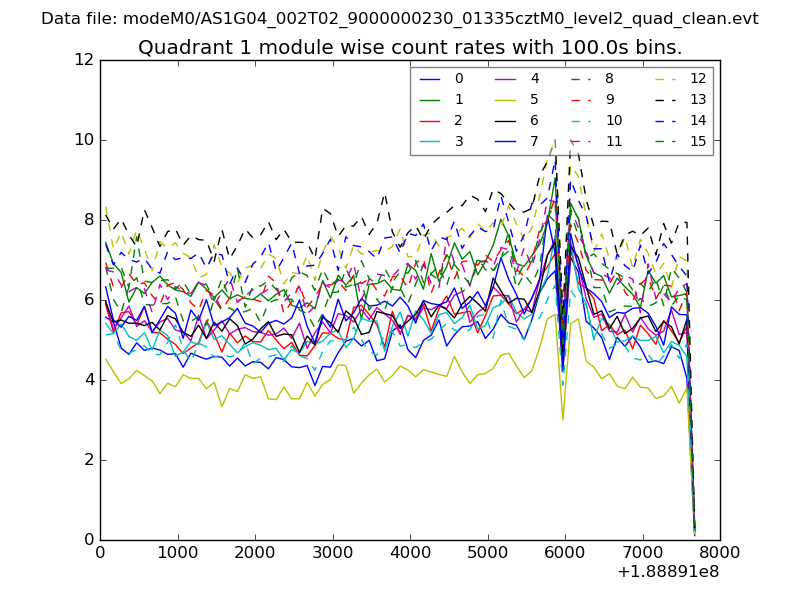
| Module-wise count rates for Quadrant A Data is divided into 100 sec bins |
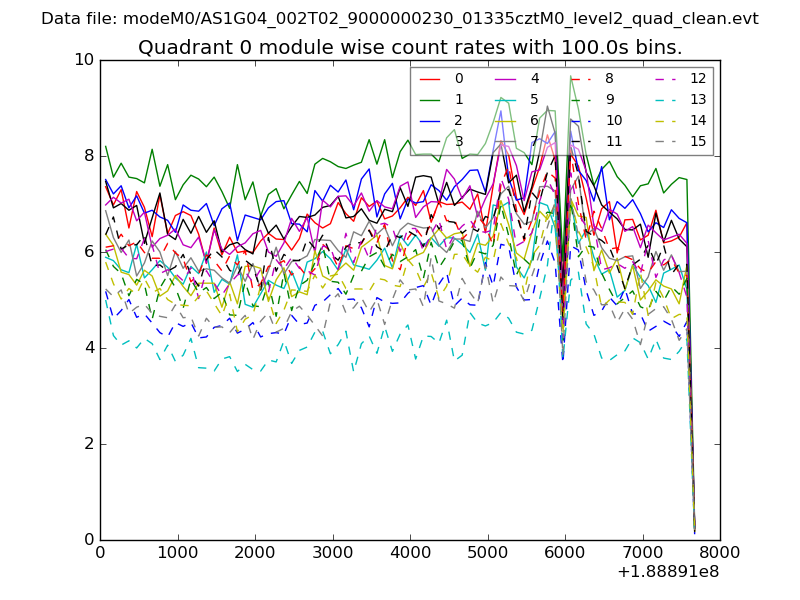 |
 |
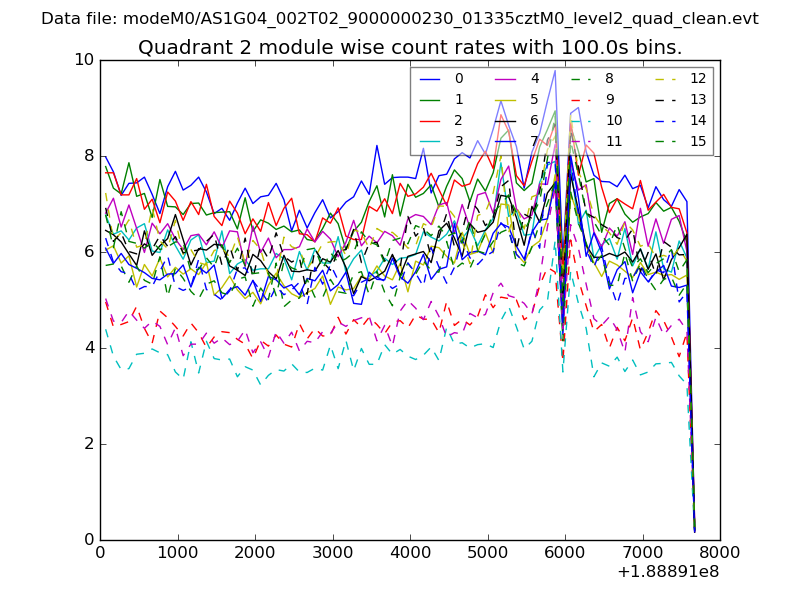
| Module-wise count rates for Quadrant B Data is divided into 100 sec bins |
 |
 |
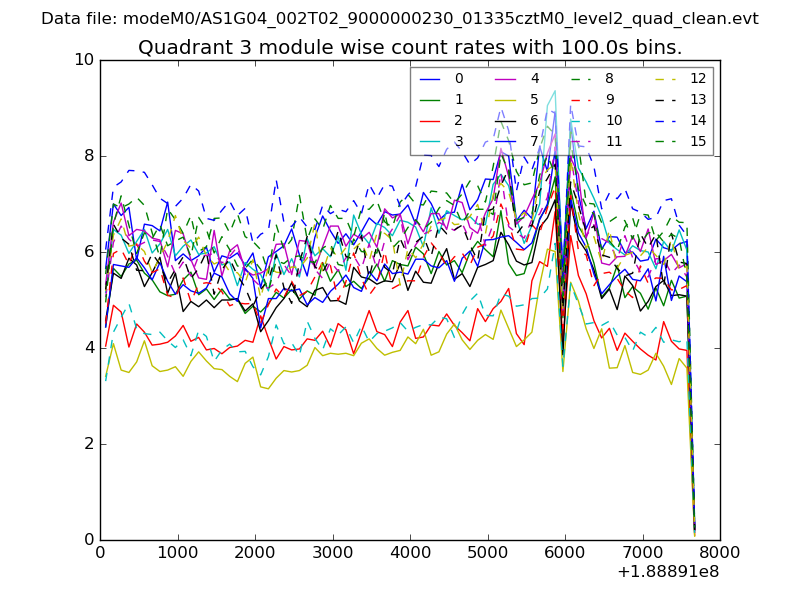
| Module-wise count rates for Quadrant C Data is divided into 100 sec bins |
 |
 |
| Module-wise count rates for Quadrant D Data is divided into 100 sec bins |
 |
 |
| Parameter | Plot |
|---|---|
| CZT HV Monitor | 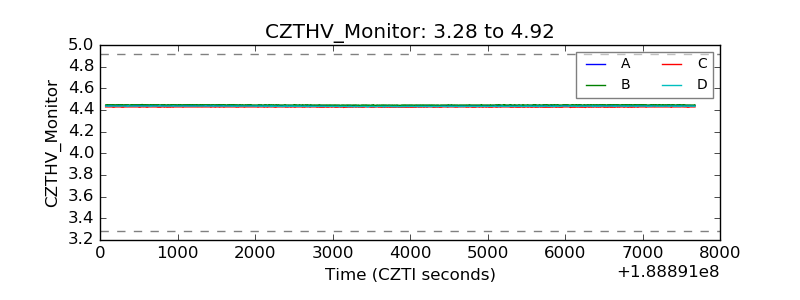 |
| D_VDD | 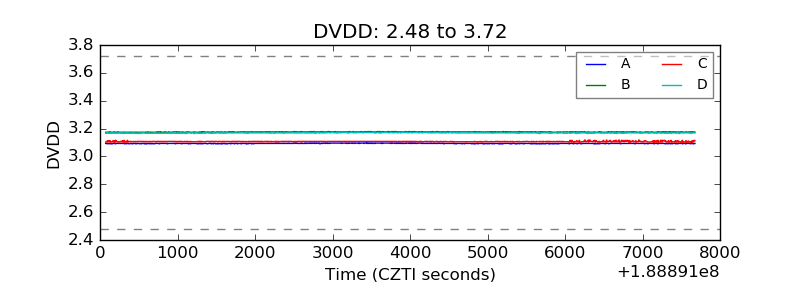 |
| Temperature 1 | 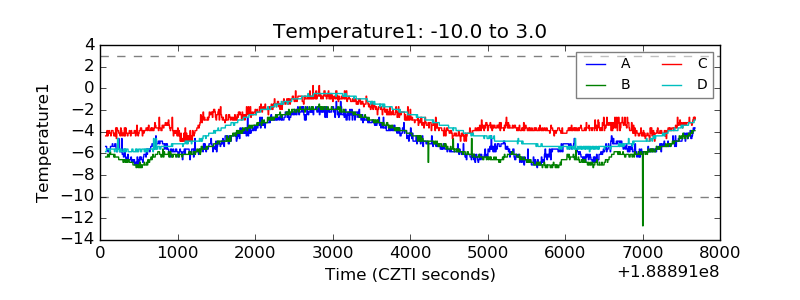 |
| Veto HV Monitor | 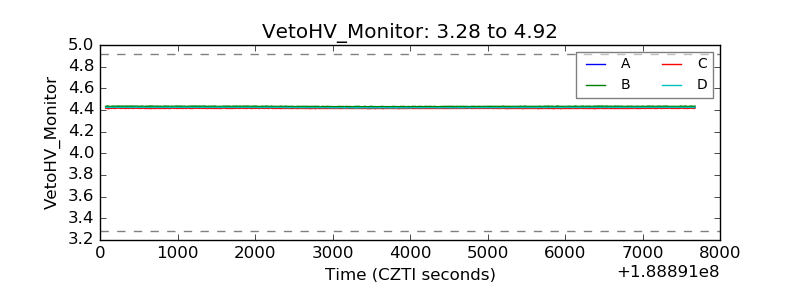 |
| Veto LLD | 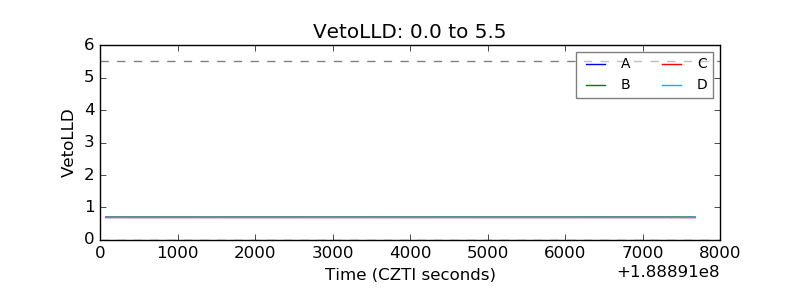 |
| Alpha Counter | 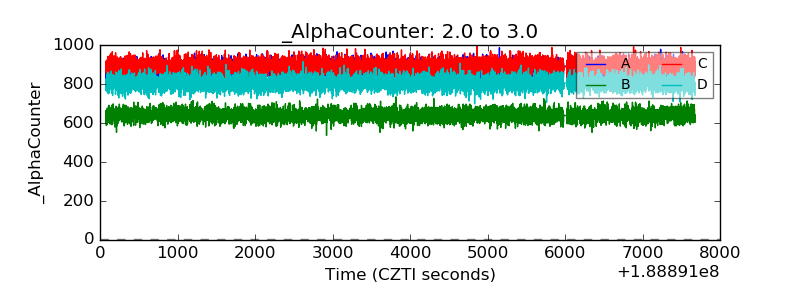 |
| _CPM_Rate | 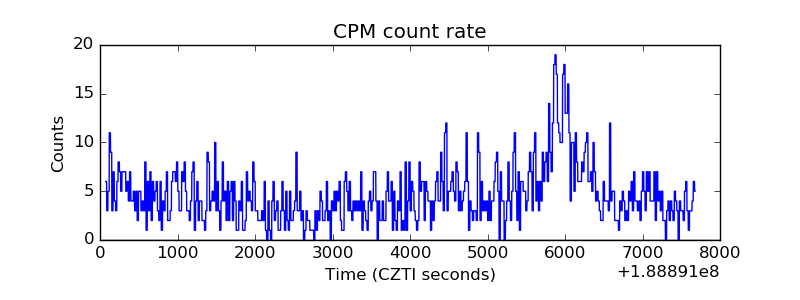 |
| CZT Counter | 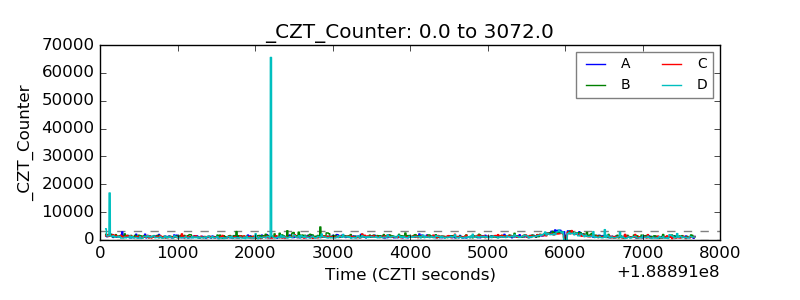 |
| +2.5 Volts monitor | 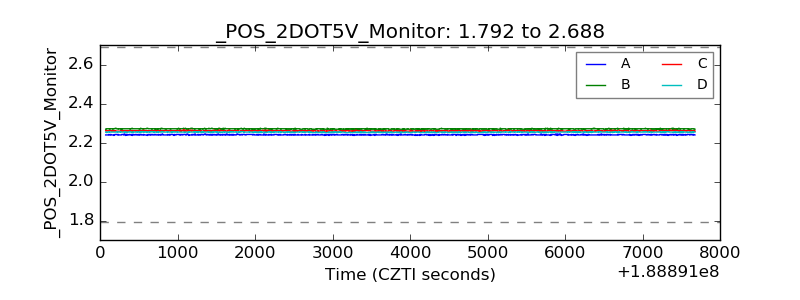 |
| +5 Volts monitor | 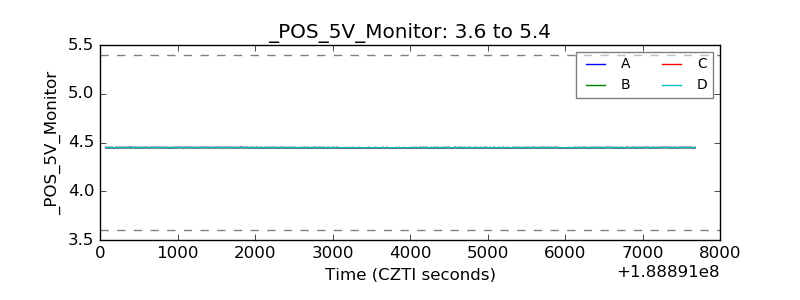 |
| _ROLL_ROT | 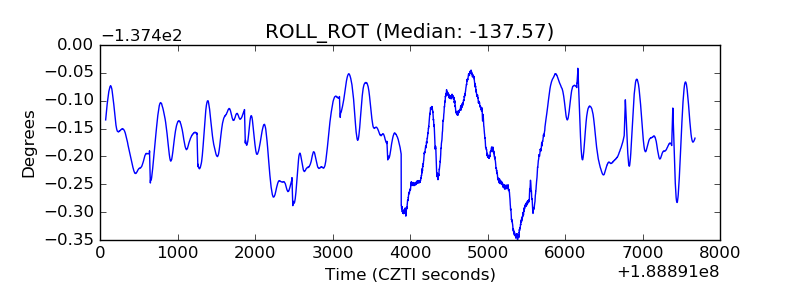 |
| _Roll_DEC | 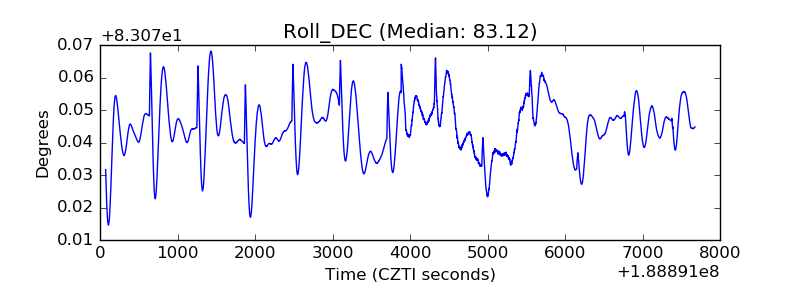 |
| _Roll_RA | 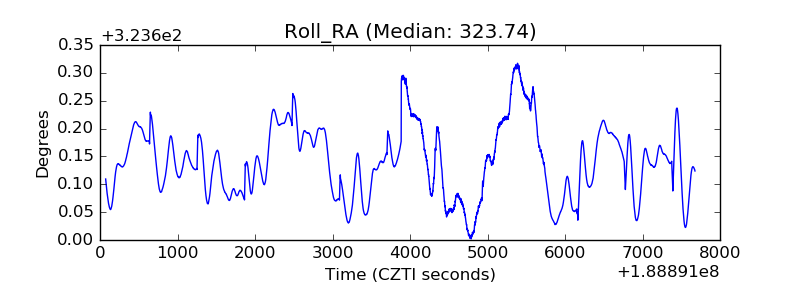 |
| Veto Counter | 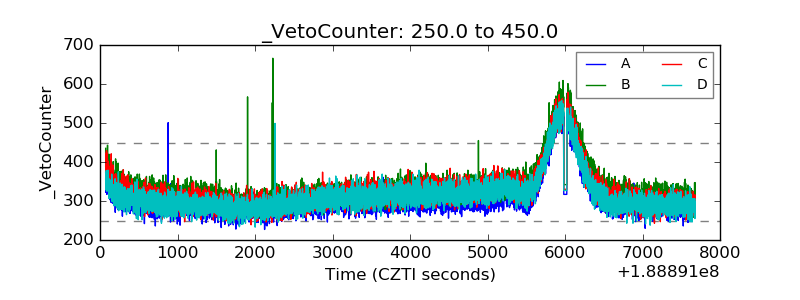 |