| Param | Original file | Final file |
|---|---|---|
| Filename | modeM0/AS1G04_002T02_9000000230_01336cztM0_level2.evt | modeM0/AS1G04_002T02_9000000230_01336cztM0_level2_quad_clean.evt |
| Size (bytes) | 1,179,504,000 | 102,335,040 |
| Size | 1.1 GB | 97.6 MB |
| Events in quadrant A | 8,816,358 | 662,233 |
| Events in quadrant B | 9,273,681 | 666,829 |
| Events in quadrant C | 8,667,520 | 650,331 |
| Events in quadrant D | 8,503,809 | 635,152 |
| Mode M0 | |||
|---|---|---|---|
| Quadrant | BADHDUFLAG | Total packets | Discarded packets |
| A | 0 | 31113 | 2 |
| B | 0 | 32475 | 1 |
| C | 0 | 30674 | 1 |
| D | 0 | 30210 | 1 |
| Mode SS | |||
|---|---|---|---|
| Quadrant | BADHDUFLAG | Total packets | Discarded packets |
| A | 0 | 140 | 0 |
| B | 0 | 140 | 0 |
| C | 0 | 140 | 0 |
| D | 0 | 140 | 0 |
| Quadrant | Total seconds | Saturated seconds | Saturation percentage |
|---|---|---|---|
| A | 6954 | 54 | 0.776531% |
| B | 6954 | 20 | 0.287604% |
| C | 6954 | 13 | 0.186943% |
| D | 6954 | 148 | 2.128271% |
Noise dominated data is calculated using 1-second bins in cleaned event files. If a bin has >2000 counts, and if more than 50% of those come from <1% of pixels, then it is considered to be noise-dominated and hence unusable.
| Quadrant | # 1 sec bins | Bins with >0 counts | Bins with >2000 counts | High rate bins dominated by noise | Noise dominated (total time) | Noise dominated (detector-on time) | Marked lightcurve |
|---|---|---|---|---|---|---|---|
| A | 6969 | 6955 | 433 | 433 | 6.21% | 6.23% | 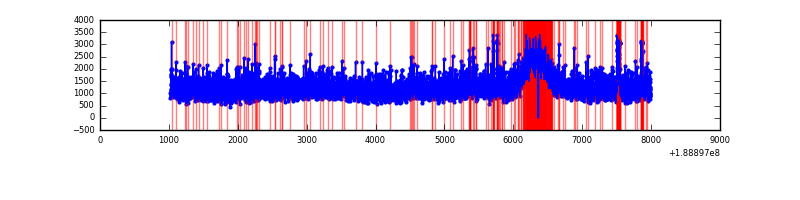 |
| B | 6969 | 6955 | 451 | 451 | 6.47% | 6.48% | 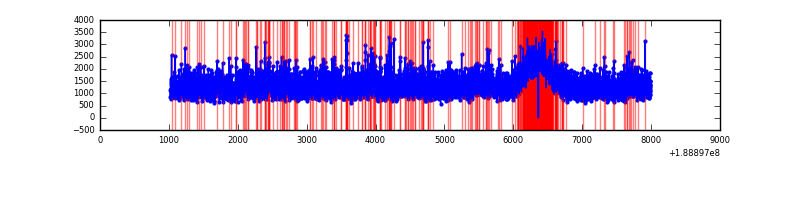 |
| C | 6969 | 6955 | 415 | 415 | 5.95% | 5.97% | 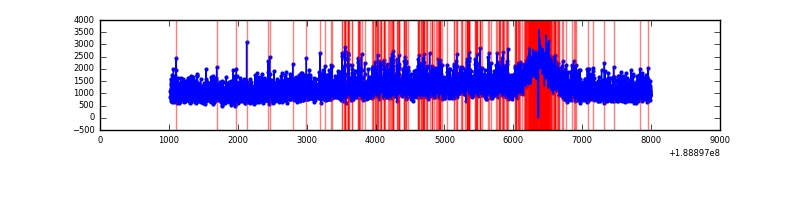 |
| D | 6969 | 6955 | 597 | 597 | 8.57% | 8.58% | 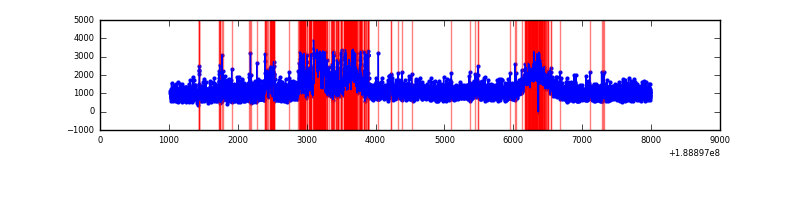 |
Top three noisy pixels from each quadrant. If the there are fewer than three noisy pixels in the level2.evt file, extra rows are filled as -1
| Pixel properties | Quadrant properties | ||||||
|---|---|---|---|---|---|---|---|
| Quadrant | DetID | PixID | Counts | Sigma | Mean | Median | Sigma |
| A | 4 | 32 | 235831 | 439.73 | 2177 | 2190 | 531.3 |
| A | 15 | 127 | 158914 | 294.97 | 2177 | 2190 | 531.3 |
| A | 14 | 5 | 61774 | 112.14 | 2177 | 2190 | 531.3 |
| B | 8 | 4 | 509574 | 950.07 | 2243 | 2252 | 534.0 |
| B | 12 | 52 | 97184 | 177.78 | 2243 | 2252 | 534.0 |
| B | 6 | 53 | 65717 | 118.85 | 2243 | 2252 | 534.0 |
| C | 3 | 9 | 433870 | 771.37 | 2002 | 2068 | 559.8 |
| C | 15 | 241 | 334373 | 593.63 | 2002 | 2068 | 559.8 |
| C | 3 | 79 | 33252 | 55.71 | 2002 | 2068 | 559.8 |
| D | 10 | 84 | 962999 | 1572.96 | 1966 | 2029 | 610.9 |
| D | 1 | 83 | 110558 | 177.64 | 1966 | 2029 | 610.9 |
| D | 13 | 252 | 41010 | 63.81 | 1966 | 2029 | 610.9 |
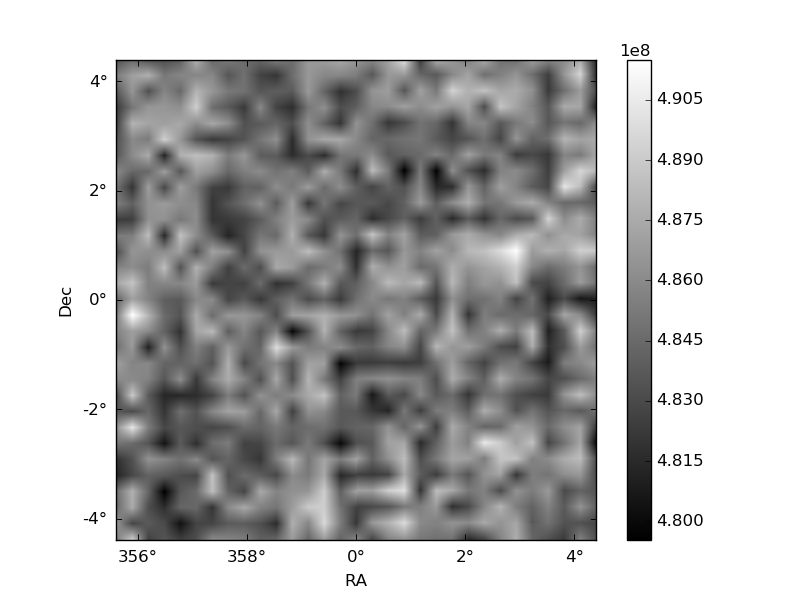
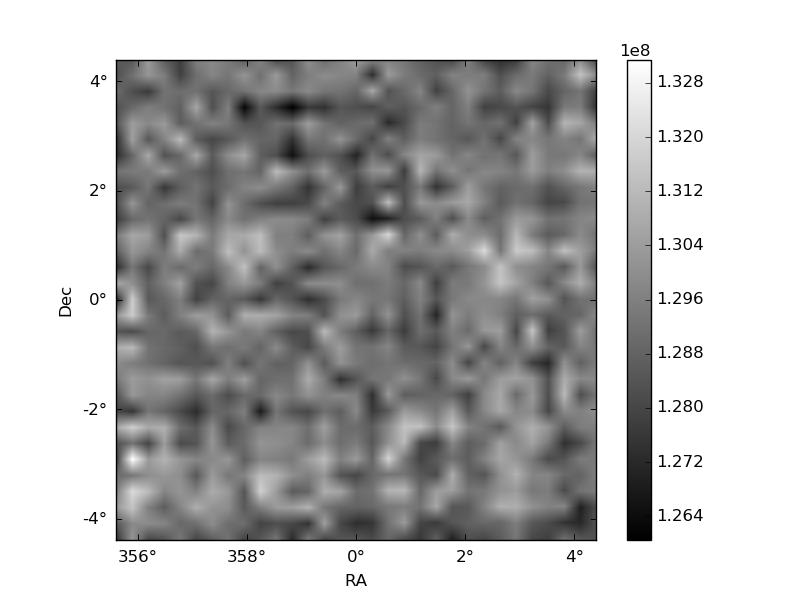
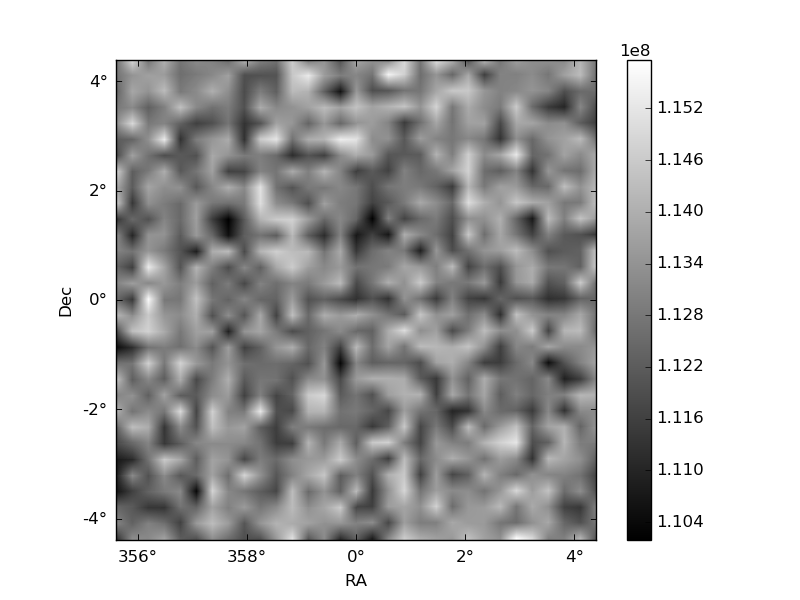
Histogram calculated using DETX and DETY for each event in the final _common_clean file
| Quadrant A | 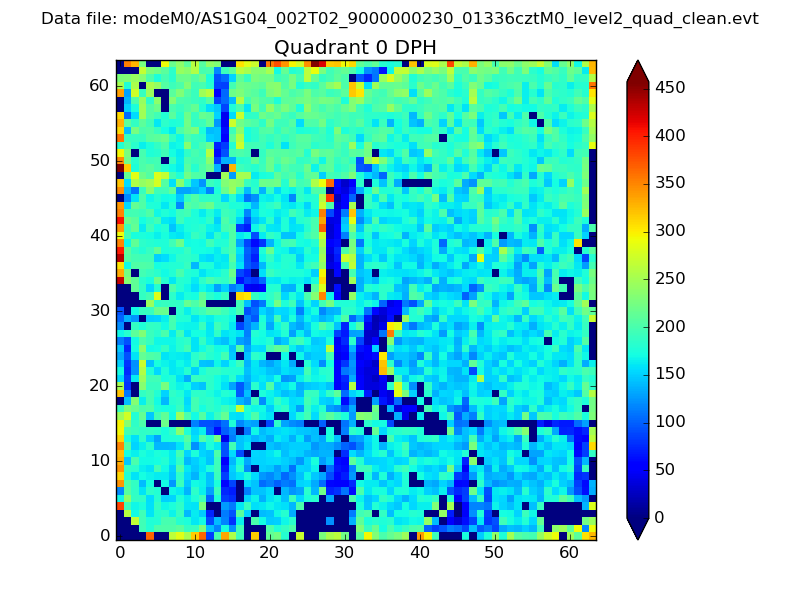 |
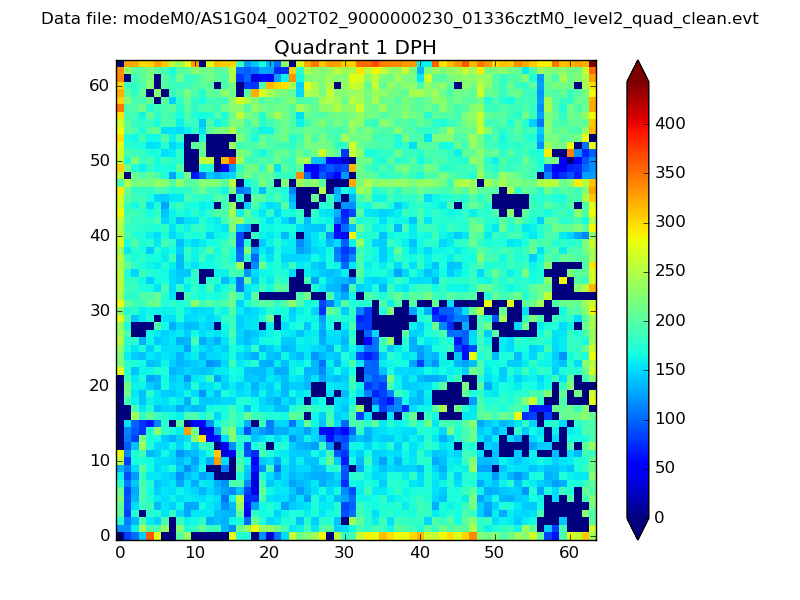 |
Quadrant B |
|---|---|---|---|
| Quadrant D | 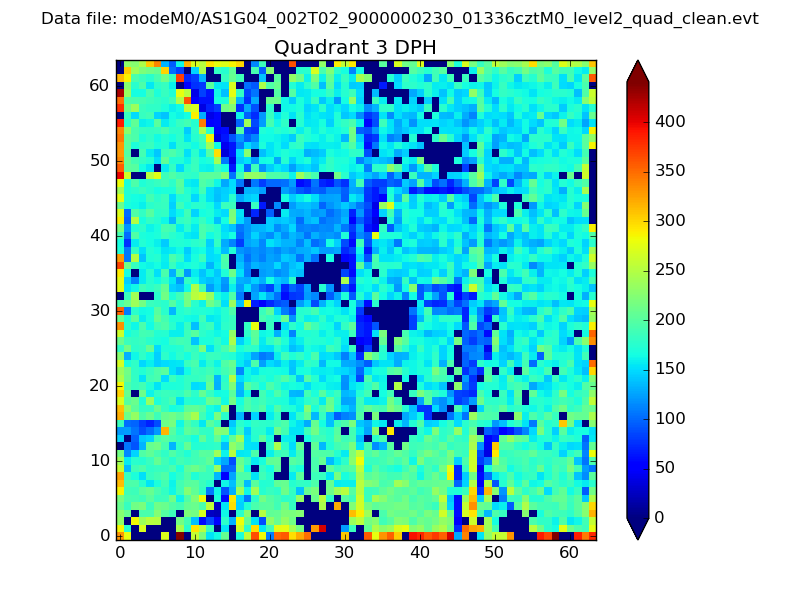 |
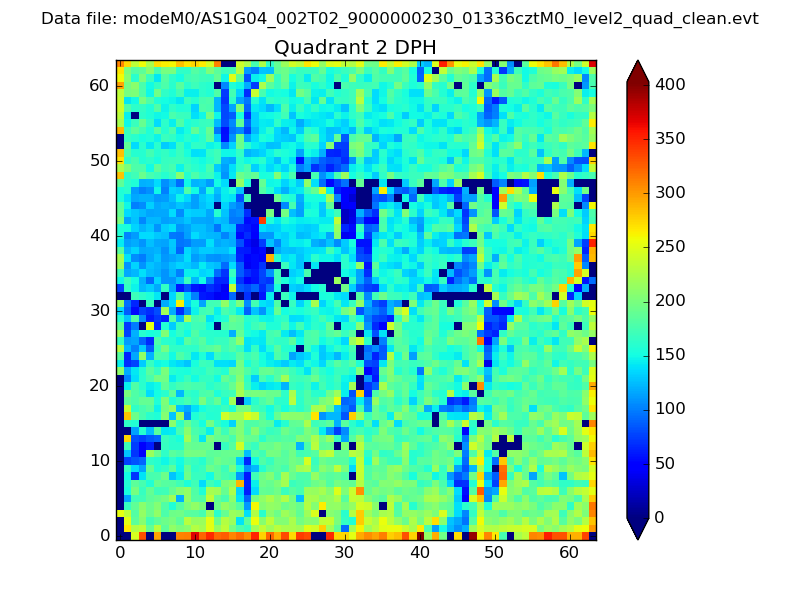 |
Quadrant C |
| Plot type | Count rate plots | Images |
|---|---|---|
| Comparison with Poisson distribution Blue bars denote a histogram of data divided into 1 sec bins. Red curve is a Poisson curve with rate = median count rate of data. |
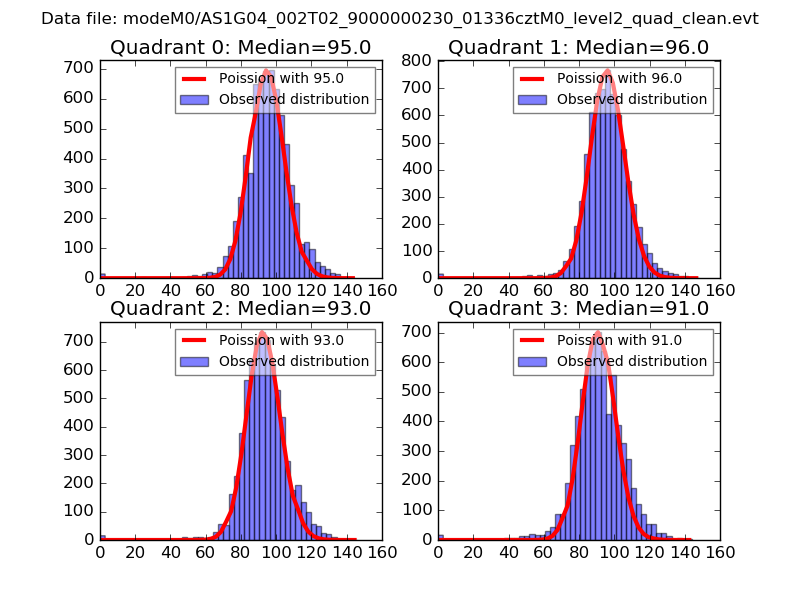 |
 |
| Quadrant-wise count rates Data is divided into 100 sec bins |
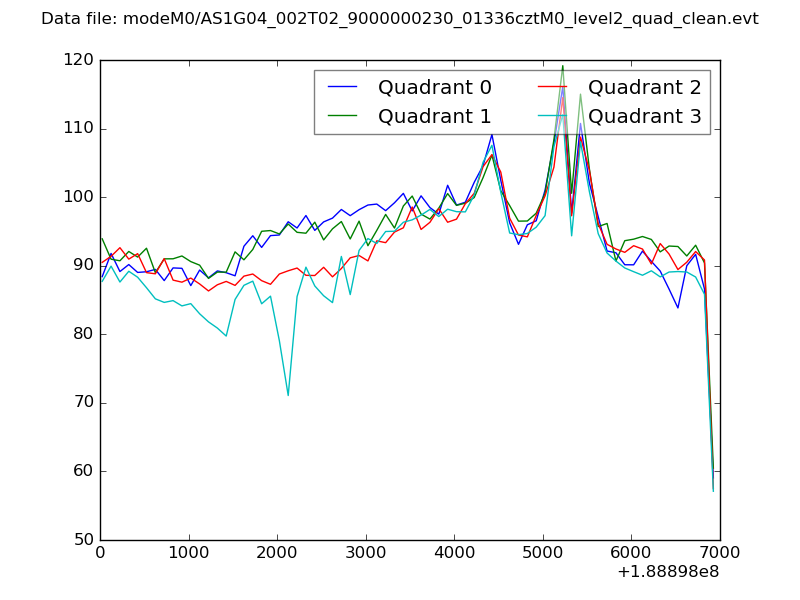 |
|
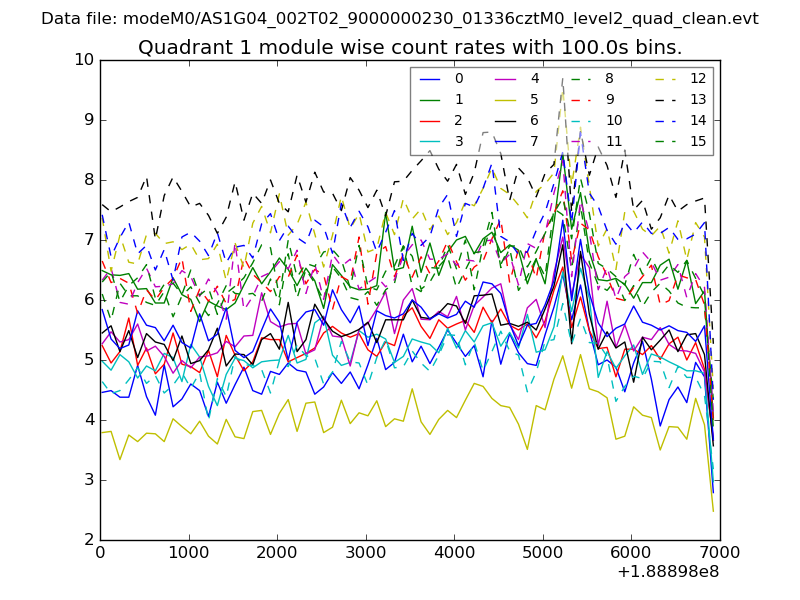
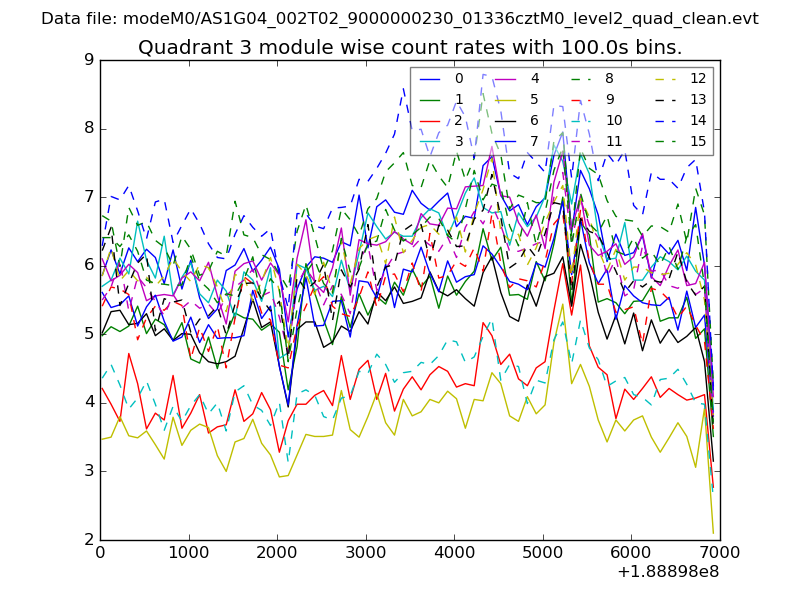
| Module-wise count rates for Quadrant A Data is divided into 100 sec bins |
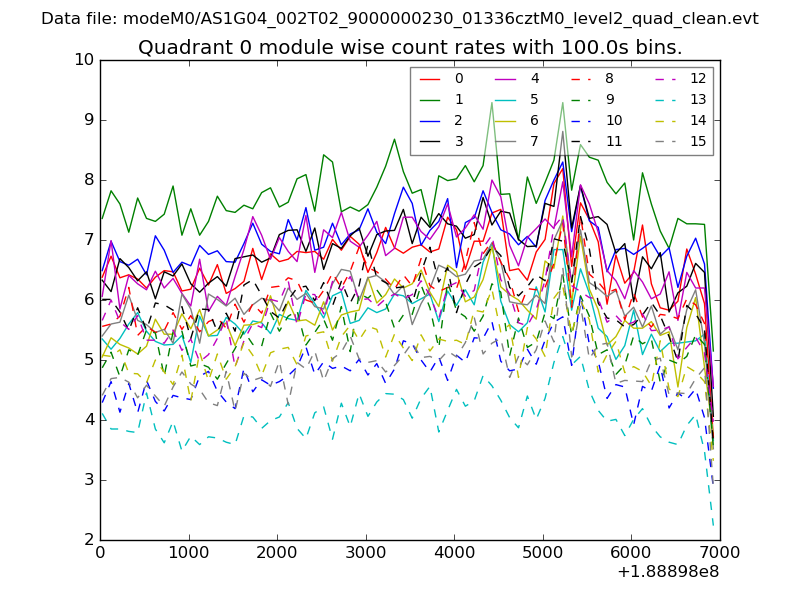 |
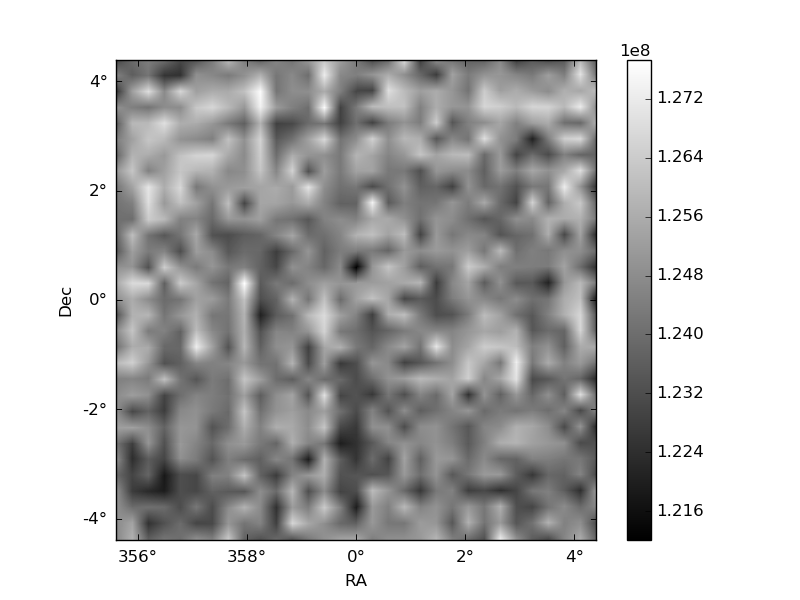 |
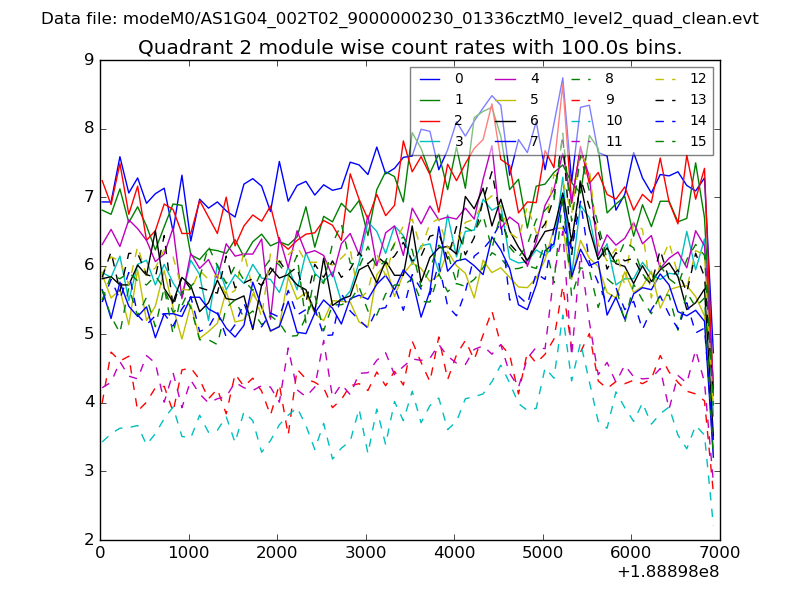
| Module-wise count rates for Quadrant B Data is divided into 100 sec bins |
 |
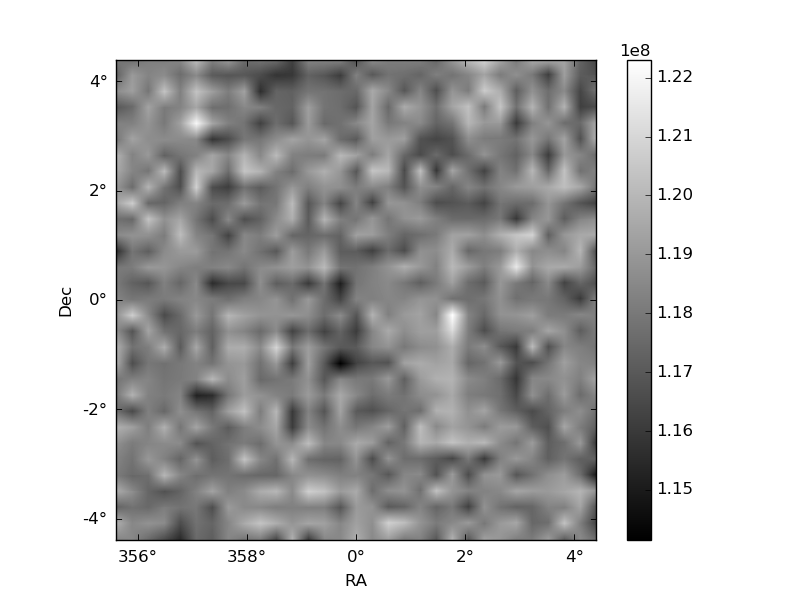 |
| Module-wise count rates for Quadrant C Data is divided into 100 sec bins |
 |
 |
| Module-wise count rates for Quadrant D Data is divided into 100 sec bins |
 |
 |
| Parameter | Plot |
|---|---|
| CZT HV Monitor | 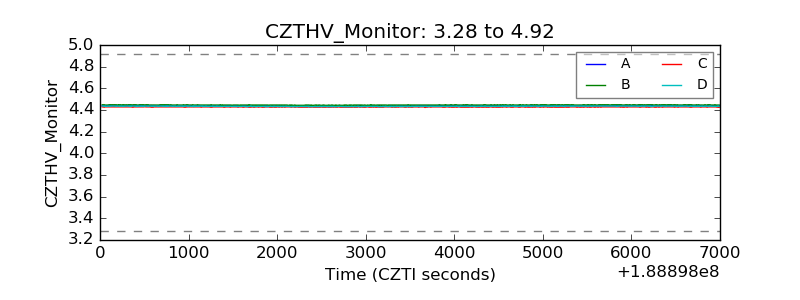 |
| D_VDD | 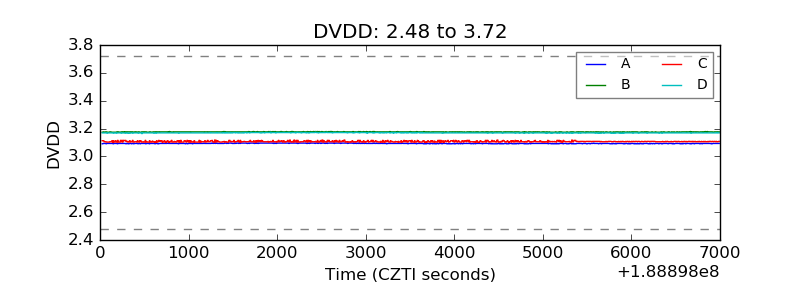 |
| Temperature 1 | 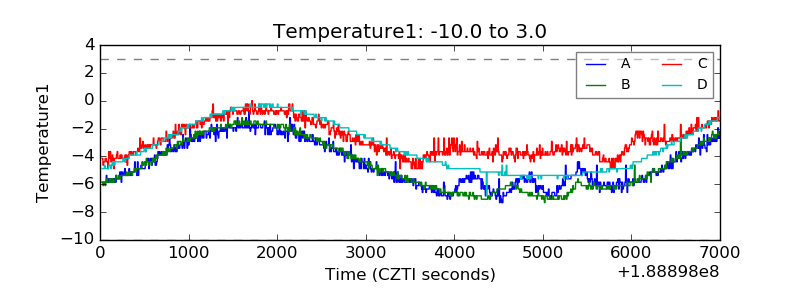 |
| Veto HV Monitor | 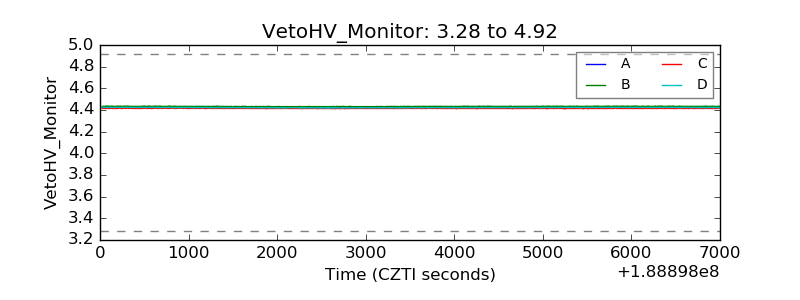 |
| Veto LLD | 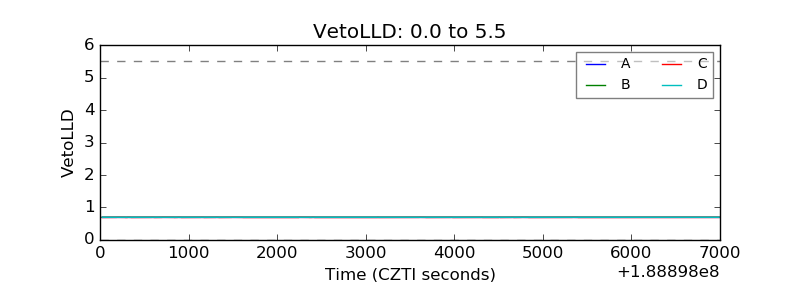 |
| Alpha Counter | 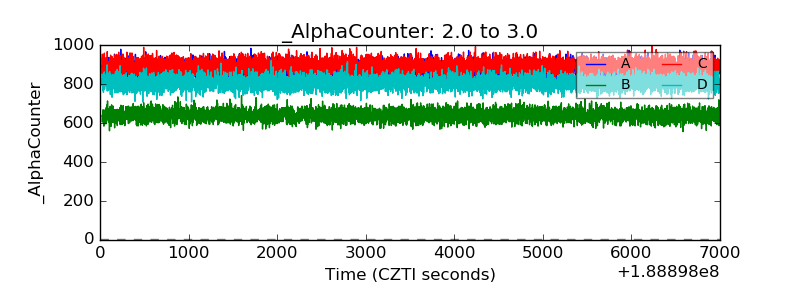 |
| _CPM_Rate | 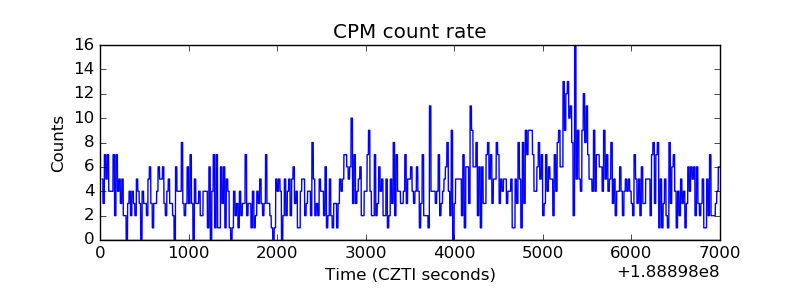 |
| CZT Counter | 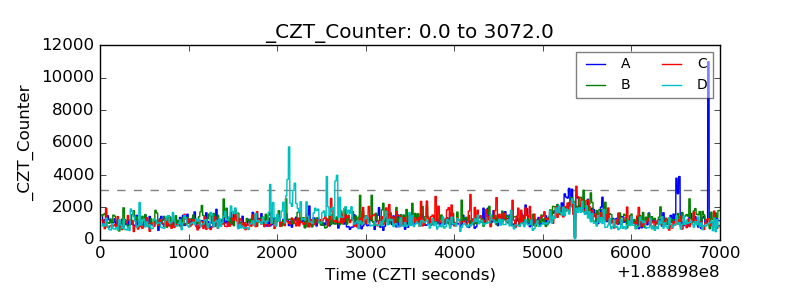 |
| +2.5 Volts monitor |  |
| +5 Volts monitor |  |
| _ROLL_ROT | 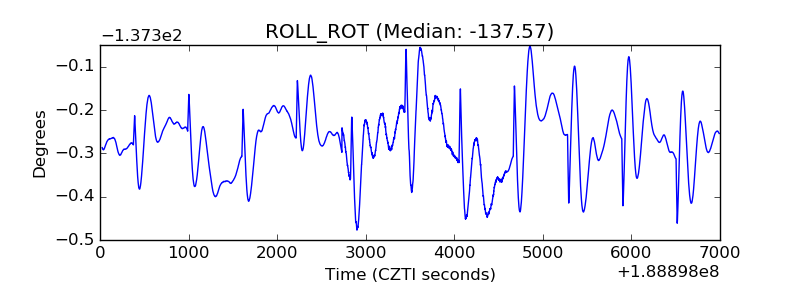 |
| _Roll_DEC | 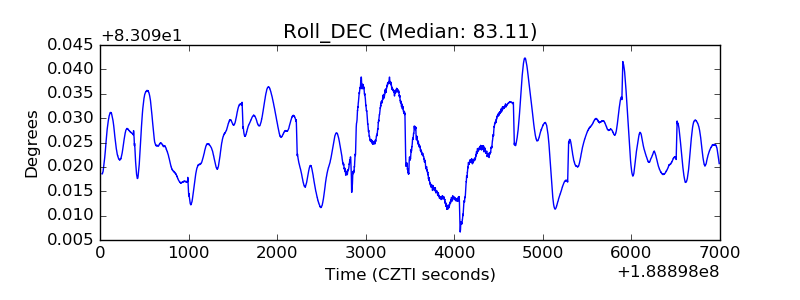 |
| _Roll_RA | 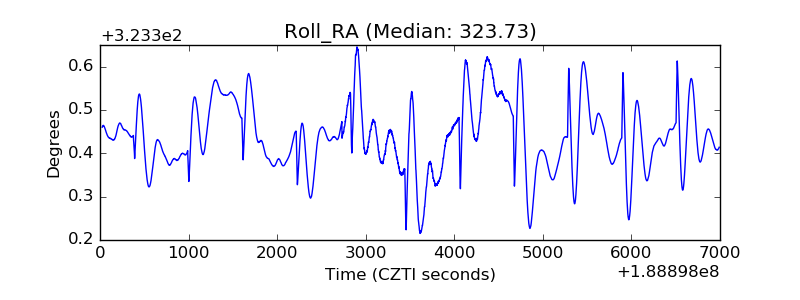 |
| Veto Counter | 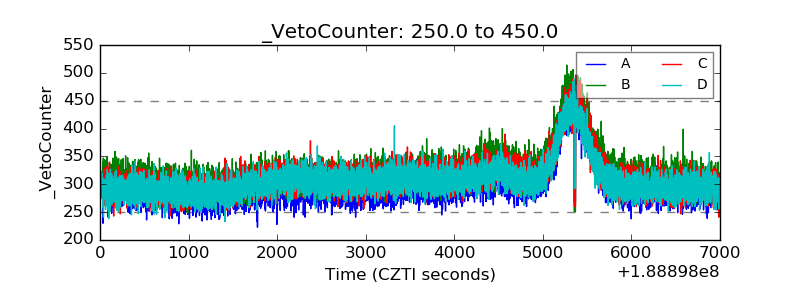 |