| Param | Original file | Final file |
|---|---|---|
| Filename | modeM0/AS1G04_002T02_9000000230_01337cztM0_level2.evt | modeM0/AS1G04_002T02_9000000230_01337cztM0_level2_quad_clean.evt |
| Size (bytes) | 1,197,717,120 | 104,785,920 |
| Size | 1.1 GB | 99.9 MB |
| Events in quadrant A | 8,977,404 | 680,373 |
| Events in quadrant B | 9,799,076 | 682,971 |
| Events in quadrant C | 8,942,981 | 665,212 |
| Events in quadrant D | 8,087,788 | 654,347 |
| Mode M0 | |||
|---|---|---|---|
| Quadrant | BADHDUFLAG | Total packets | Discarded packets |
| A | 0 | 31685 | 1 |
| B | 0 | 34084 | 0 |
| C | 0 | 31541 | 0 |
| D | 0 | 29045 | 0 |
| Mode SS | |||
|---|---|---|---|
| Quadrant | BADHDUFLAG | Total packets | Discarded packets |
| A | 0 | 140 | 0 |
| B | 0 | 140 | 0 |
| C | 0 | 140 | 0 |
| D | 0 | 140 | 0 |
| Quadrant | Total seconds | Saturated seconds | Saturation percentage |
|---|---|---|---|
| A | 7047 | 119 | 1.688662% |
| B | 7047 | 73 | 1.035902% |
| C | 7047 | 23 | 0.326380% |
| D | 7047 | 48 | 0.681141% |
Noise dominated data is calculated using 1-second bins in cleaned event files. If a bin has >2000 counts, and if more than 50% of those come from <1% of pixels, then it is considered to be noise-dominated and hence unusable.
| Quadrant | # 1 sec bins | Bins with >0 counts | Bins with >2000 counts | High rate bins dominated by noise | Noise dominated (total time) | Noise dominated (detector-on time) | Marked lightcurve |
|---|---|---|---|---|---|---|---|
| A | 7047 | 7047 | 526 | 526 | 7.46% | 7.46% | 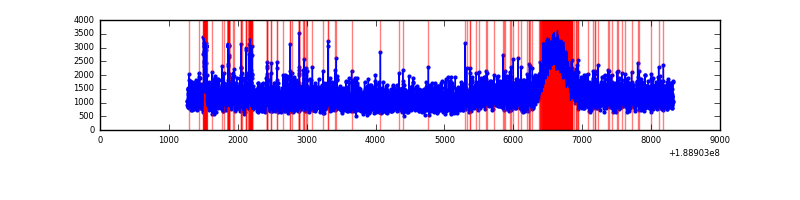 |
| B | 7047 | 7047 | 636 | 636 | 9.03% | 9.03% |  |
| C | 7047 | 7047 | 534 | 534 | 7.58% | 7.58% |  |
| D | 7047 | 7047 | 402 | 402 | 5.70% | 5.70% |  |
Top three noisy pixels from each quadrant. If the there are fewer than three noisy pixels in the level2.evt file, extra rows are filled as -1
| Pixel properties | Quadrant properties | ||||||
|---|---|---|---|---|---|---|---|
| Quadrant | DetID | PixID | Counts | Sigma | Mean | Median | Sigma |
| A | 4 | 32 | 214994 | 386.37 | 2269 | 2287 | 550.5 |
| A | 15 | 127 | 27208 | 45.27 | 2269 | 2287 | 550.5 |
| A | 15 | 233 | 11490 | 16.72 | 2269 | 2287 | 550.5 |
| B | 8 | 4 | 580444 | 1031.52 | 2331 | 2340 | 560.4 |
| B | 12 | 52 | 115210 | 201.4 | 2331 | 2340 | 560.4 |
| B | 15 | 22 | 106819 | 186.42 | 2331 | 2340 | 560.4 |
| C | 15 | 241 | 337323 | 571.12 | 2100 | 2176 | 586.8 |
| C | 3 | 9 | 332584 | 563.05 | 2100 | 2176 | 586.8 |
| C | 3 | 79 | 37467 | 60.14 | 2100 | 2176 | 586.8 |
| D | 10 | 84 | 163304 | 252.13 | 2082 | 2147 | 639.2 |
| D | 13 | 252 | 61176 | 92.35 | 2082 | 2147 | 639.2 |
| D | 1 | 83 | 35814 | 52.67 | 2082 | 2147 | 639.2 |
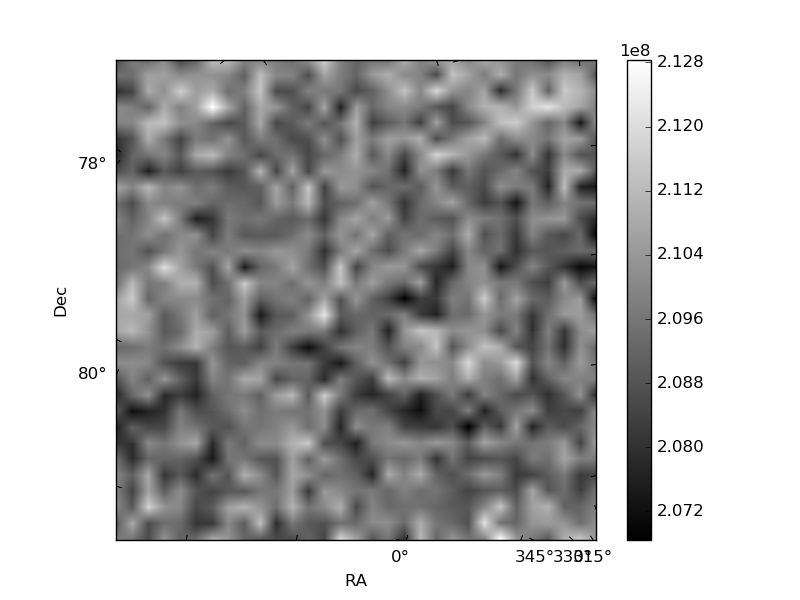
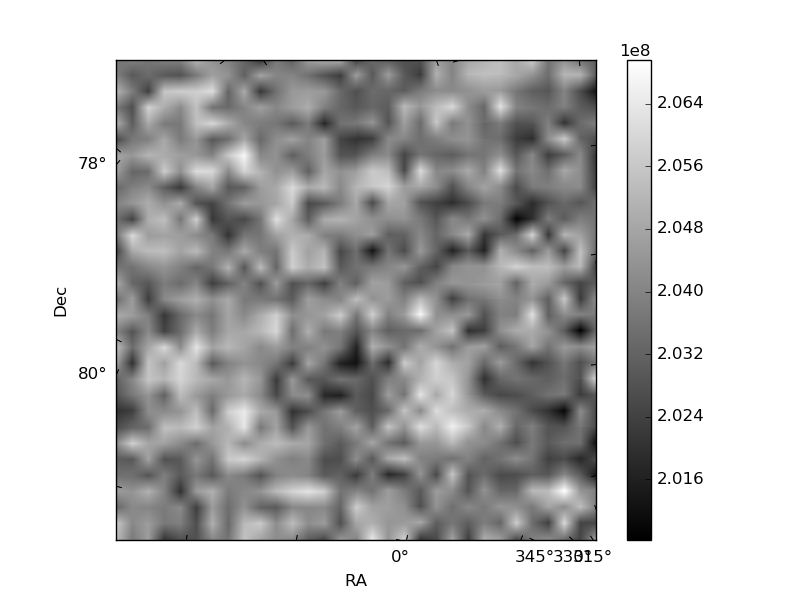
Histogram calculated using DETX and DETY for each event in the final _common_clean file
| Quadrant A | 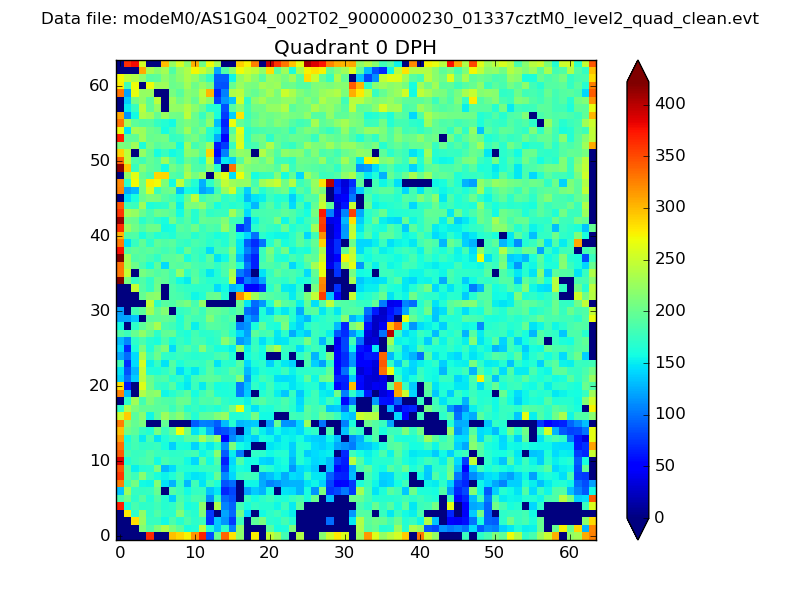 |
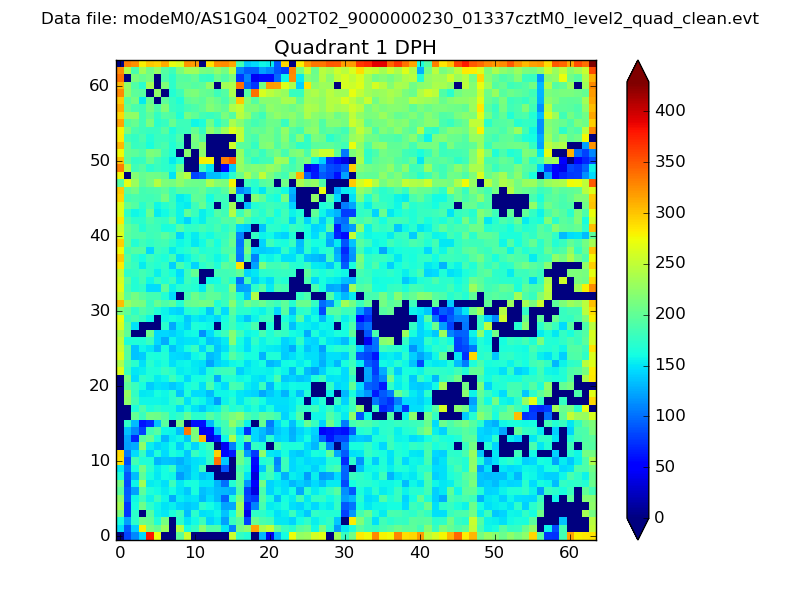 |
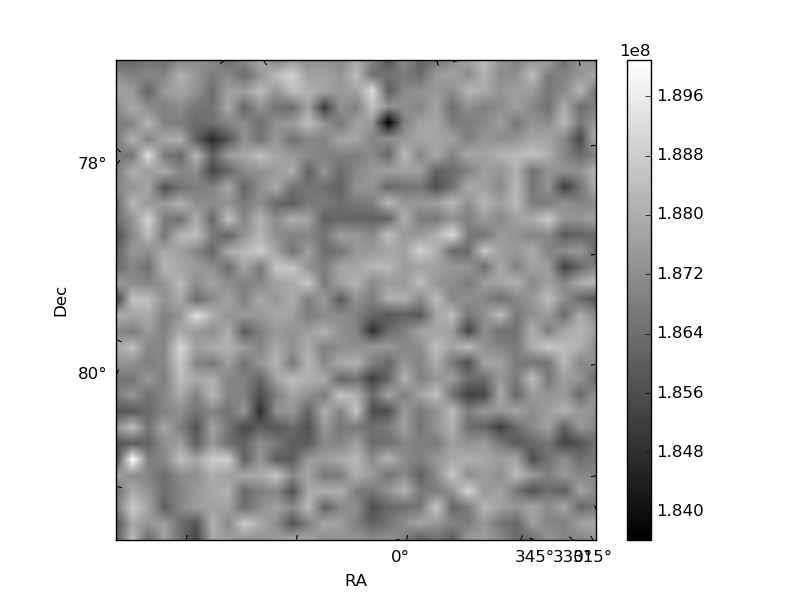
Quadrant B |
|---|---|---|---|
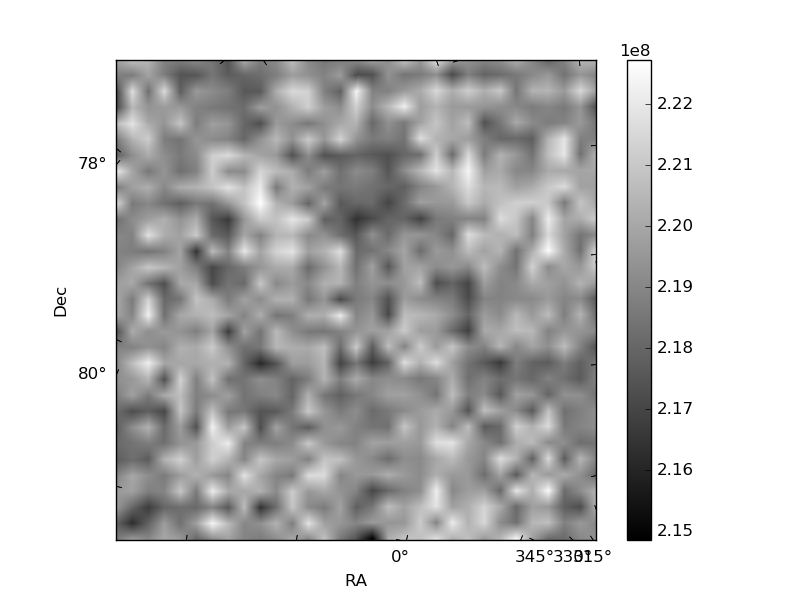
| Quadrant D | 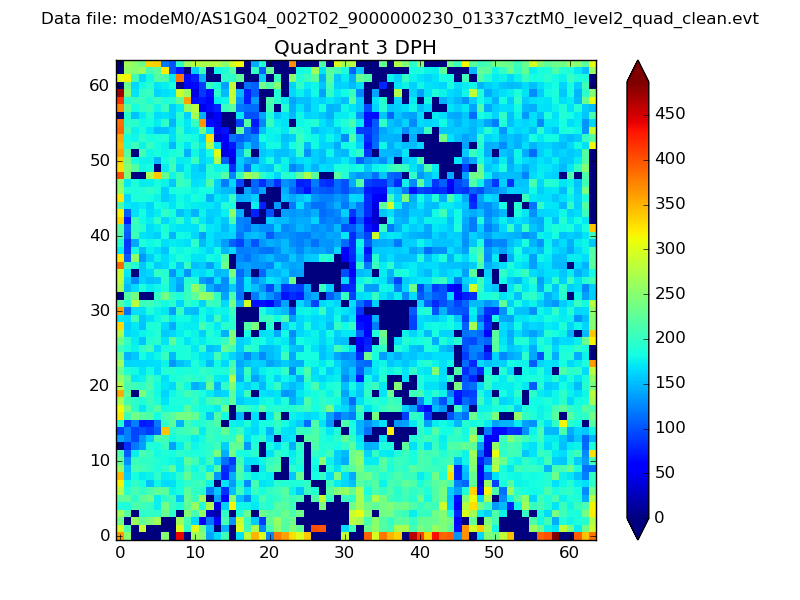 |
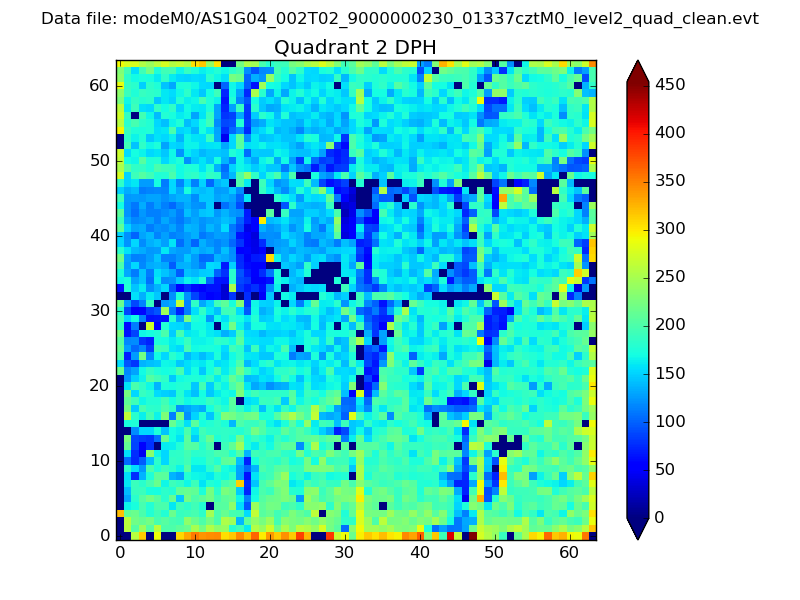 |
Quadrant C |
| Plot type | Count rate plots | Images |
|---|---|---|
| Comparison with Poisson distribution Blue bars denote a histogram of data divided into 1 sec bins. Red curve is a Poisson curve with rate = median count rate of data. |
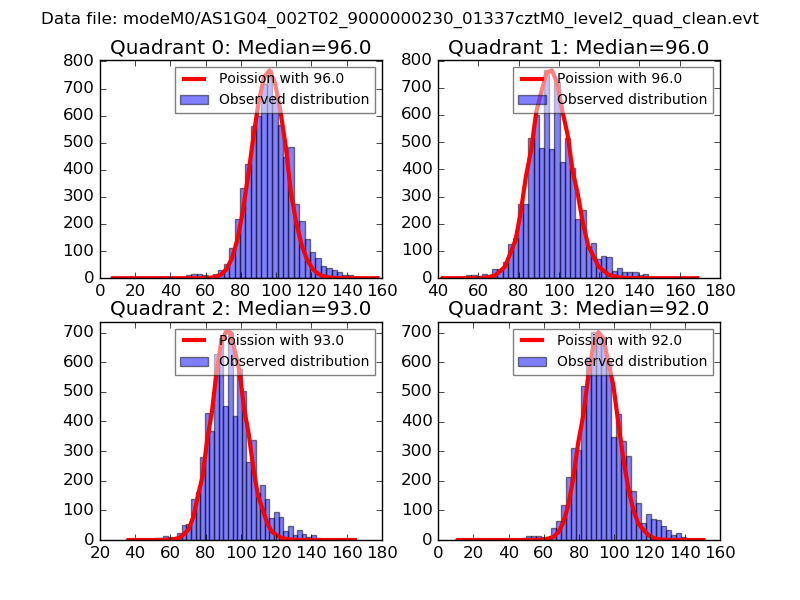 |
 |
| Quadrant-wise count rates Data is divided into 100 sec bins |
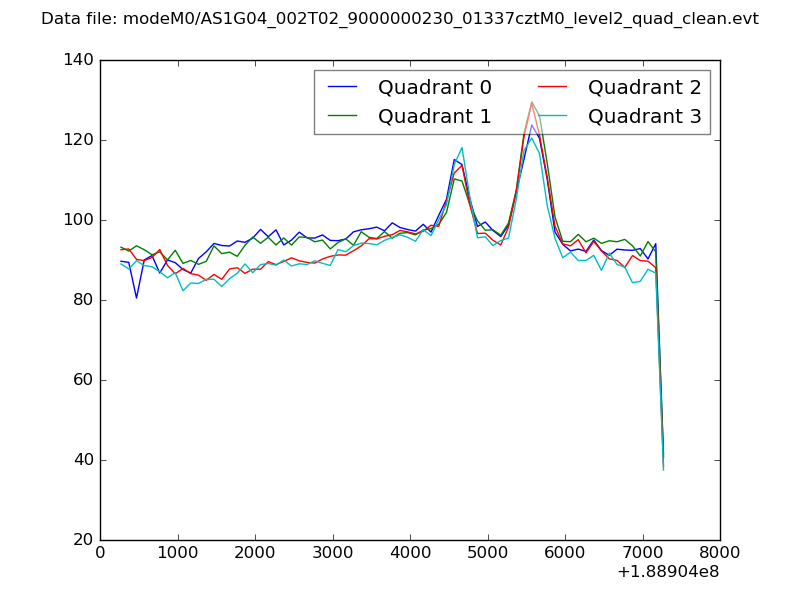 |
|
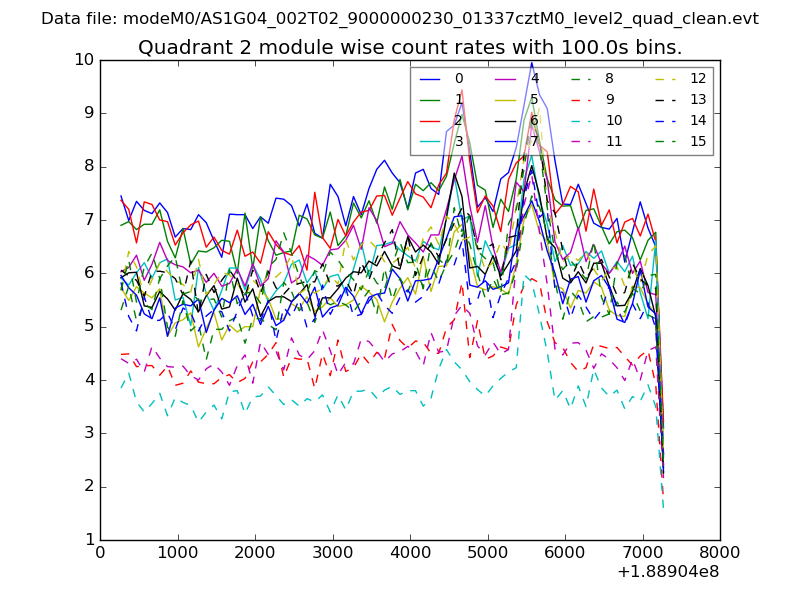
| Module-wise count rates for Quadrant A Data is divided into 100 sec bins |
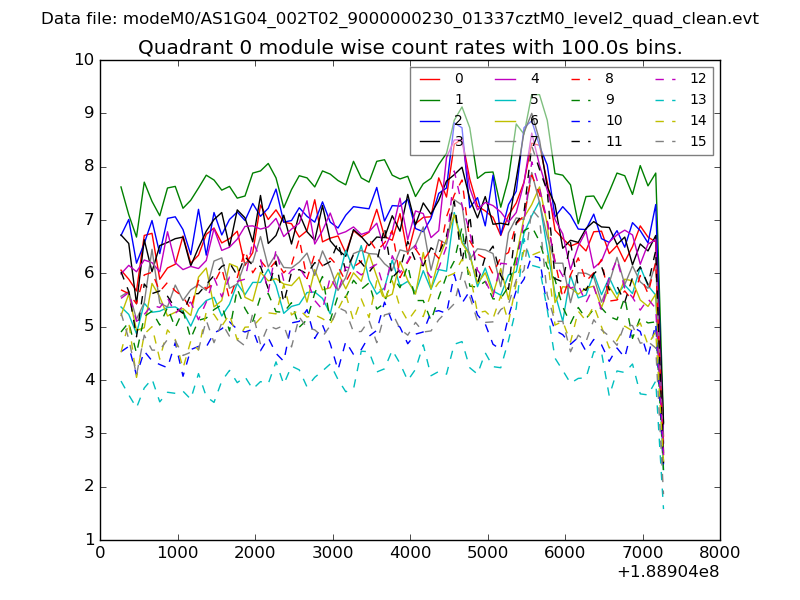 |
 |
| Module-wise count rates for Quadrant B Data is divided into 100 sec bins |
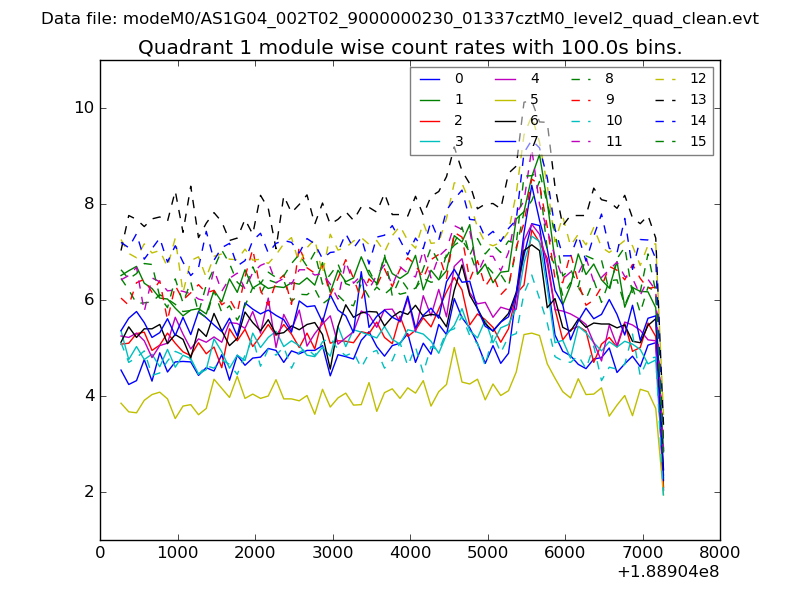 |
 |
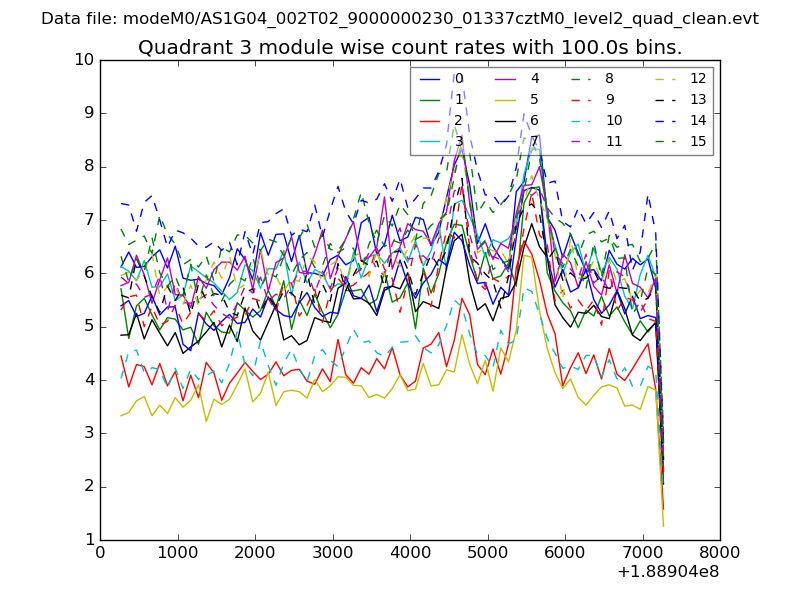
| Module-wise count rates for Quadrant C Data is divided into 100 sec bins |
 |
 |
| Module-wise count rates for Quadrant D Data is divided into 100 sec bins |
 |
 |
| Parameter | Plot |
|---|---|
| CZT HV Monitor | 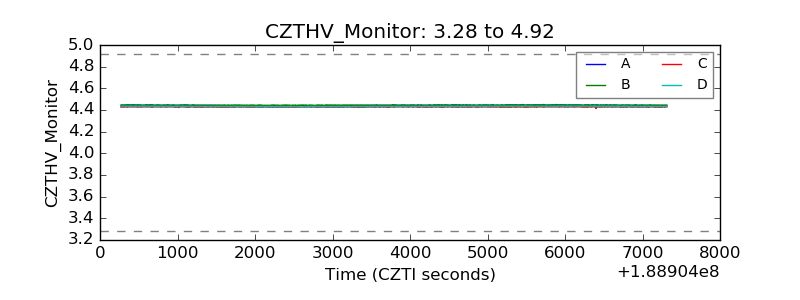 |
| D_VDD | 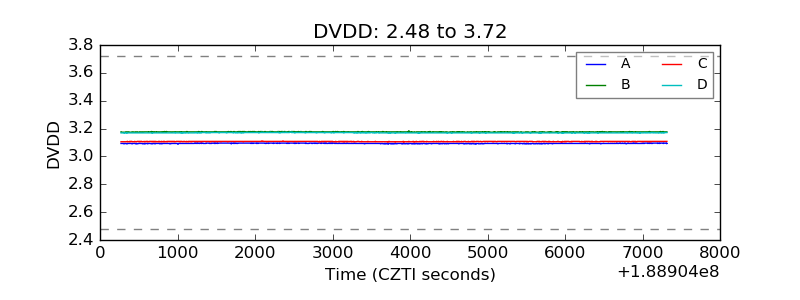 |
| Temperature 1 | 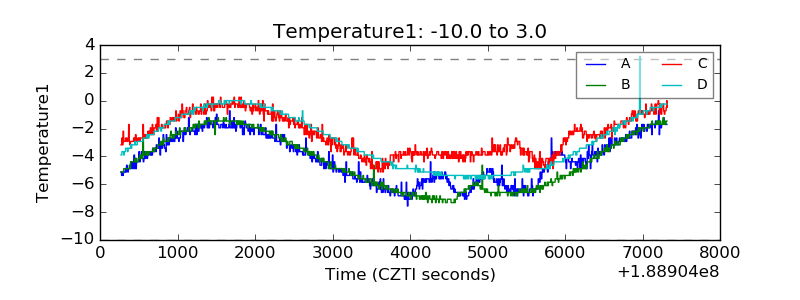 |
| Veto HV Monitor | 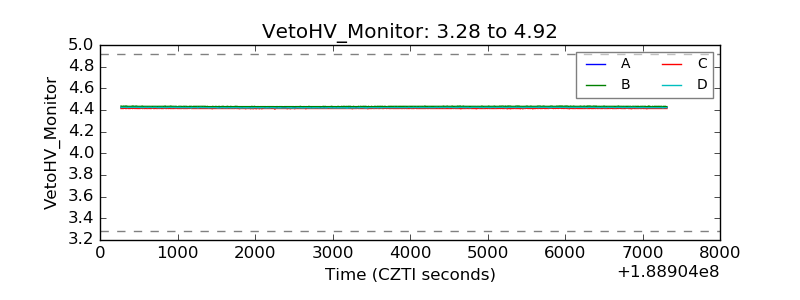 |
| Veto LLD | 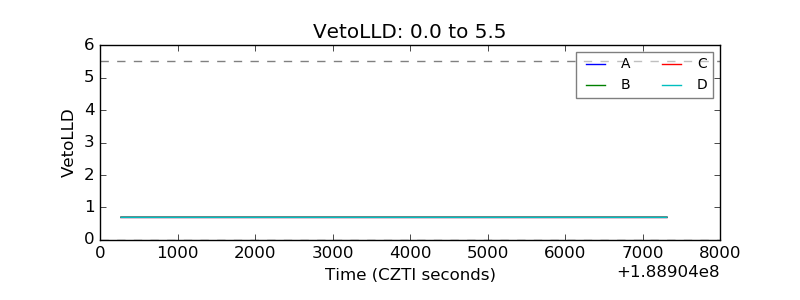 |
| Alpha Counter | 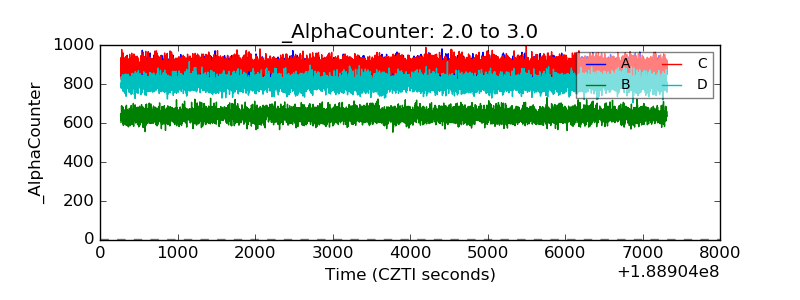 |
| _CPM_Rate | 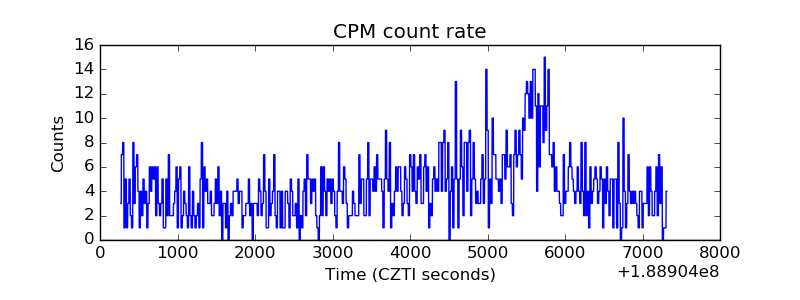 |
| CZT Counter | 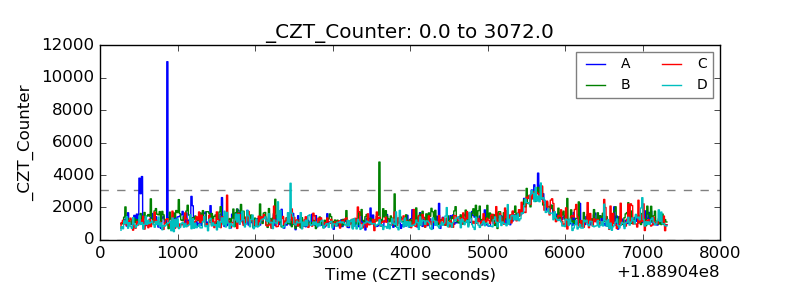 |
| +2.5 Volts monitor |  |
| +5 Volts monitor |  |
| _ROLL_ROT | 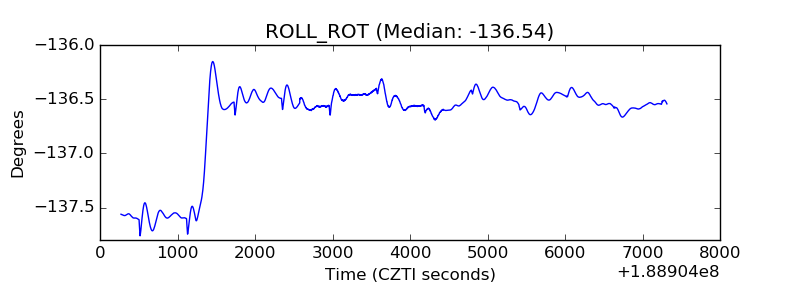 |
| _Roll_DEC | 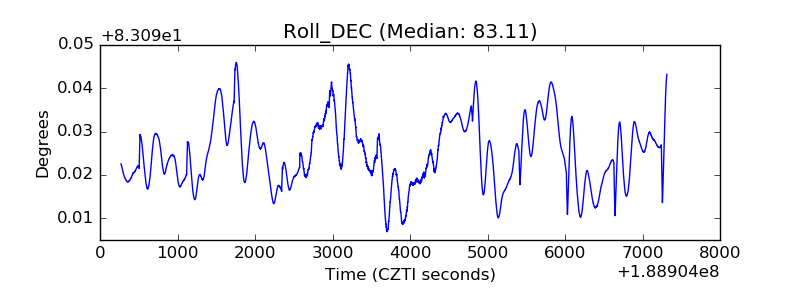 |
| _Roll_RA | 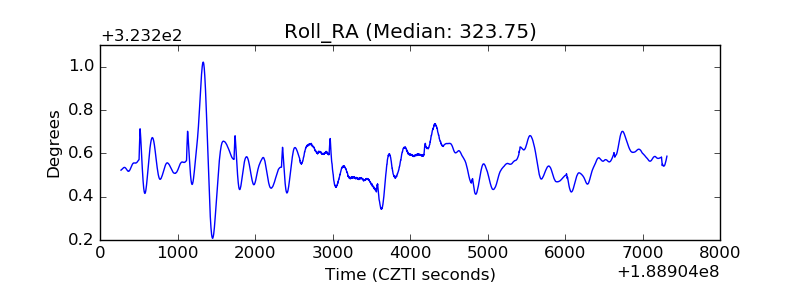 |
| Veto Counter | 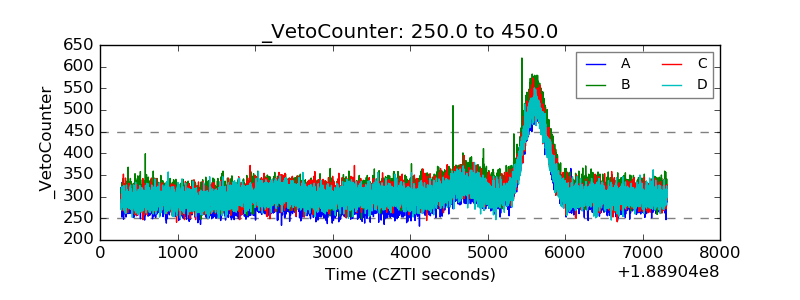 |