| Param | Original file | Final file |
|---|---|---|
| Filename | modeM0/AS1G04_002T02_9000000230_01338cztM0_level2.evt | modeM0/AS1G04_002T02_9000000230_01338cztM0_level2_quad_clean.evt |
| Size (bytes) | 1,131,681,600 | 99,645,120 |
| Size | 1.1 GB | 95.0 MB |
| Events in quadrant A | 8,722,261 | 643,738 |
| Events in quadrant B | 8,991,570 | 649,946 |
| Events in quadrant C | 8,461,947 | 629,832 |
| Events in quadrant D | 7,649,673 | 622,701 |
| Mode M9 | |||
|---|---|---|---|
| Quadrant | BADHDUFLAG | Total packets | Discarded packets |
| A | 0 | 4 | 0 |
| B | 0 | 4 | 0 |
| C | 0 | 4 | 0 |
| D | 0 | 4 | 0 |
| Mode M0 | |||
|---|---|---|---|
| Quadrant | BADHDUFLAG | Total packets | Discarded packets |
| A | 0 | 30717 | 2 |
| B | 0 | 31546 | 1 |
| C | 0 | 29932 | 1 |
| D | 0 | 27524 | 1 |
| Mode SS | |||
|---|---|---|---|
| Quadrant | BADHDUFLAG | Total packets | Discarded packets |
| A | 0 | 138 | 0 |
| B | 0 | 138 | 0 |
| C | 0 | 138 | 0 |
| D | 0 | 138 | 0 |
| Quadrant | Total seconds | Saturated seconds | Saturation percentage |
|---|---|---|---|
| A | 6761 | 169 | 2.499630% |
| B | 6761 | 88 | 1.301583% |
| C | 6761 | 62 | 0.917024% |
| D | 6761 | 73 | 1.079722% |
Noise dominated data is calculated using 1-second bins in cleaned event files. If a bin has >2000 counts, and if more than 50% of those come from <1% of pixels, then it is considered to be noise-dominated and hence unusable.
| Quadrant | # 1 sec bins | Bins with >0 counts | Bins with >2000 counts | High rate bins dominated by noise | Noise dominated (total time) | Noise dominated (detector-on time) | Marked lightcurve |
|---|---|---|---|---|---|---|---|
| A | 7131 | 6761 | 514 | 514 | 7.21% | 7.60% | 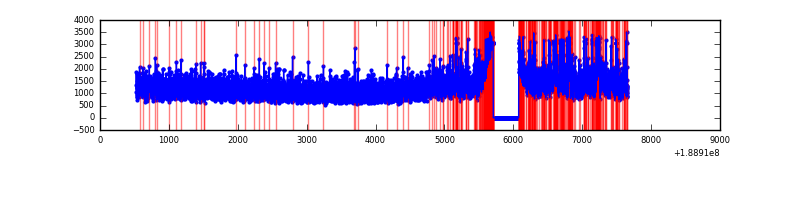 |
| B | 7131 | 6761 | 415 | 415 | 5.82% | 6.14% | 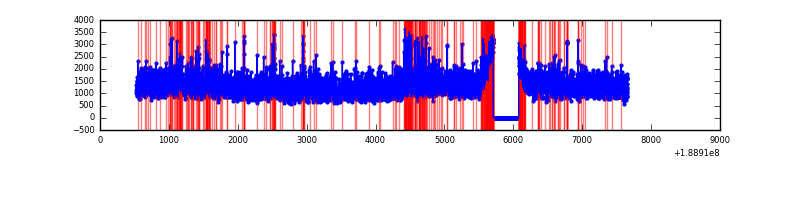 |
| C | 7131 | 6761 | 308 | 308 | 4.32% | 4.56% | 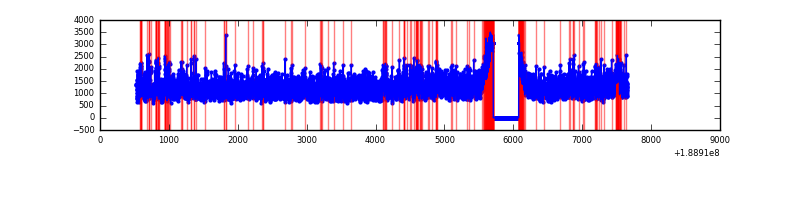 |
| D | 7131 | 6761 | 224 | 224 | 3.14% | 3.31% | 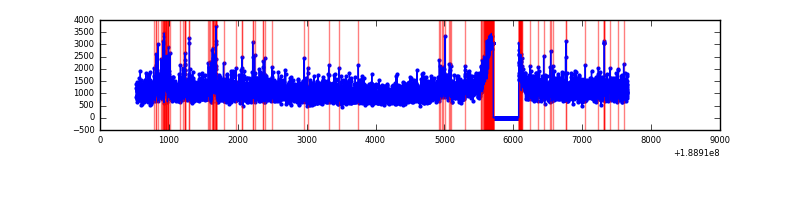 |
Top three noisy pixels from each quadrant. If the there are fewer than three noisy pixels in the level2.evt file, extra rows are filled as -1
| Pixel properties | Quadrant properties | ||||||
|---|---|---|---|---|---|---|---|
| Quadrant | DetID | PixID | Counts | Sigma | Mean | Median | Sigma |
| A | 4 | 32 | 672659 | 1325.47 | 2092 | 2112 | 505.9 |
| A | 14 | 5 | 9091 | 13.8 | 2092 | 2112 | 505.9 |
| A | 0 | 214 | 7640 | 10.93 | 2092 | 2112 | 505.9 |
| B | 8 | 4 | 211697 | 405.34 | 2174 | 2185 | 516.9 |
| B | 5 | 191 | 144058 | 274.48 | 2174 | 2185 | 516.9 |
| B | 15 | 22 | 127107 | 241.68 | 2174 | 2185 | 516.9 |
| C | 3 | 9 | 332742 | 601.95 | 1970 | 2040 | 549.4 |
| C | 15 | 241 | 328075 | 593.46 | 1970 | 2040 | 549.4 |
| C | 3 | 79 | 35995 | 61.8 | 1970 | 2040 | 549.4 |
| D | 10 | 84 | 200639 | 335.98 | 1946 | 2016 | 591.2 |
| D | 13 | 252 | 56850 | 92.75 | 1946 | 2016 | 591.2 |
| D | 9 | 66 | 24888 | 38.69 | 1946 | 2016 | 591.2 |
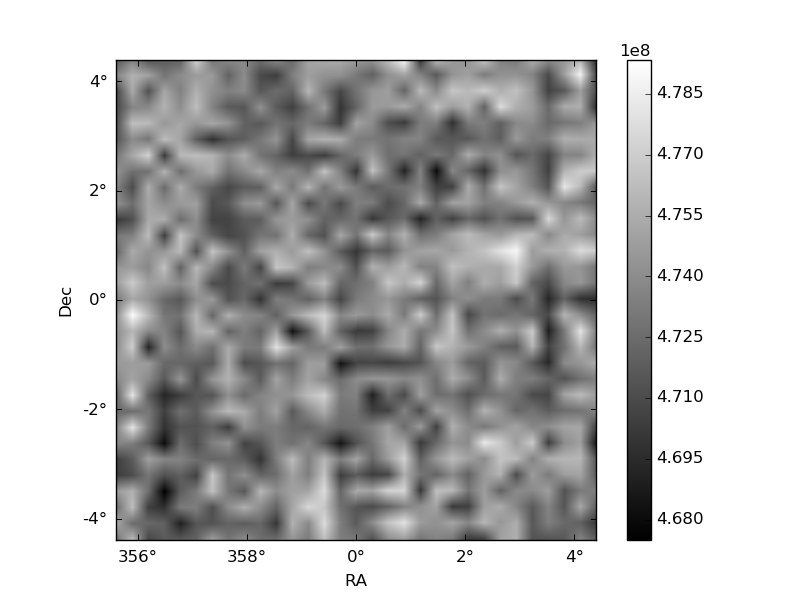
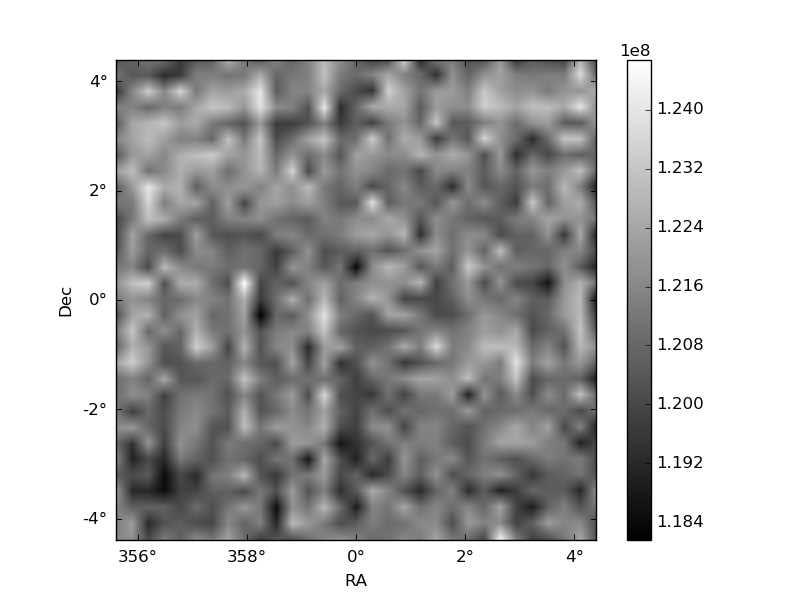
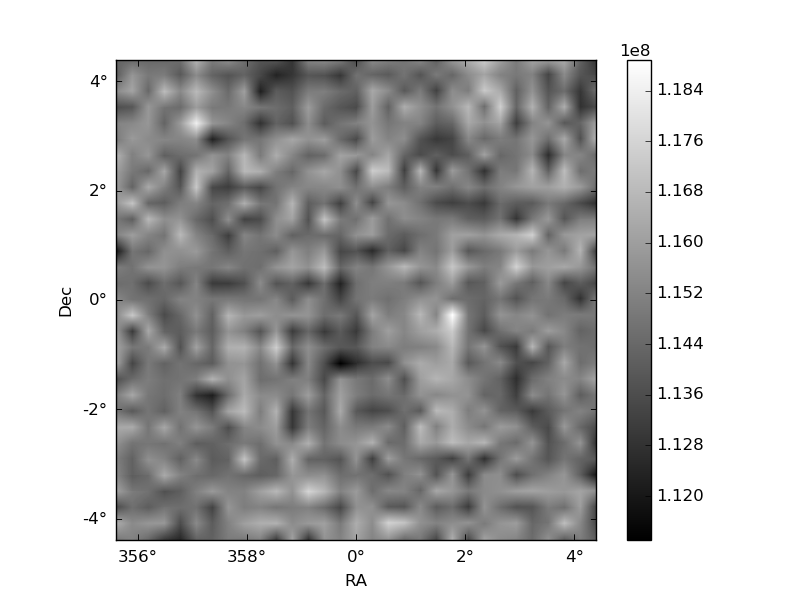
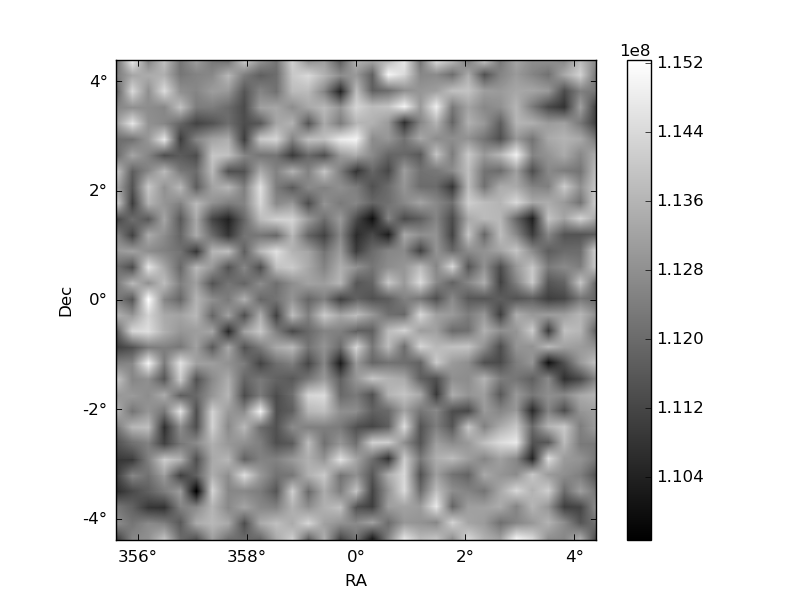
Histogram calculated using DETX and DETY for each event in the final _common_clean file
| Quadrant A | 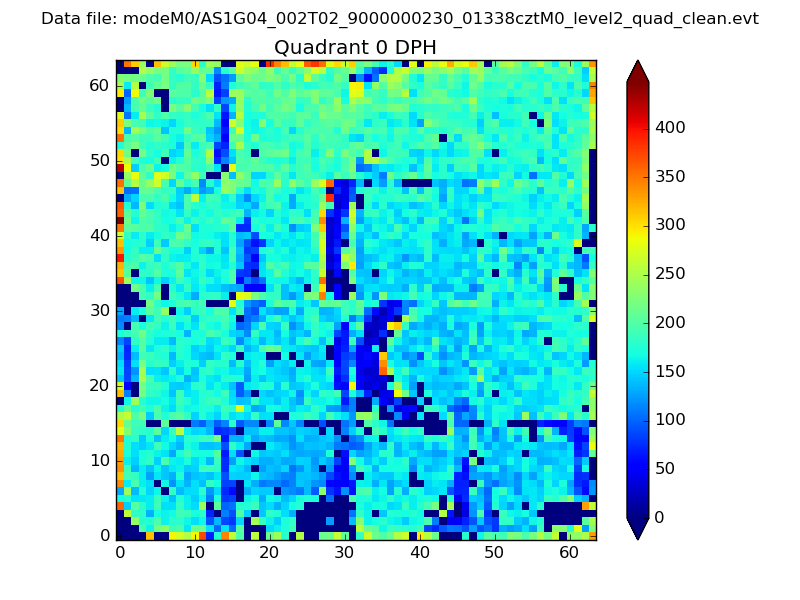 |
 |
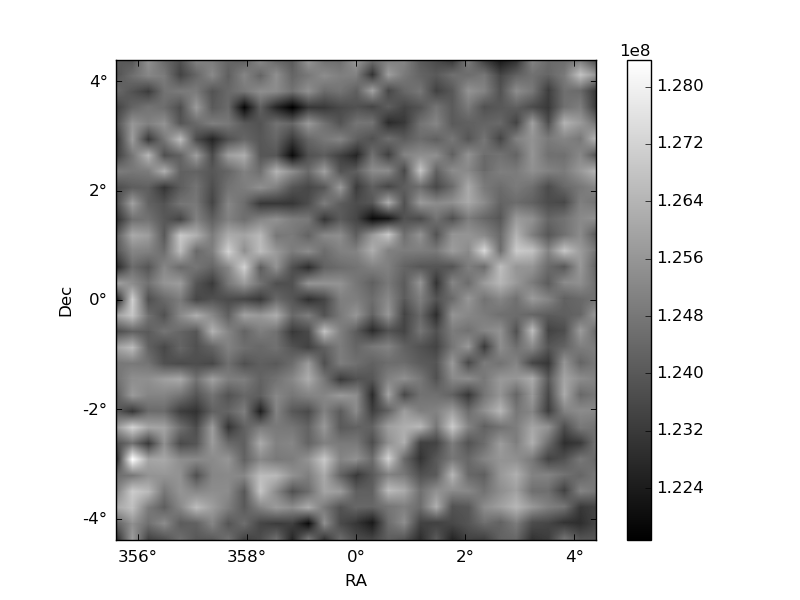
Quadrant B |
|---|---|---|---|
| Quadrant D | 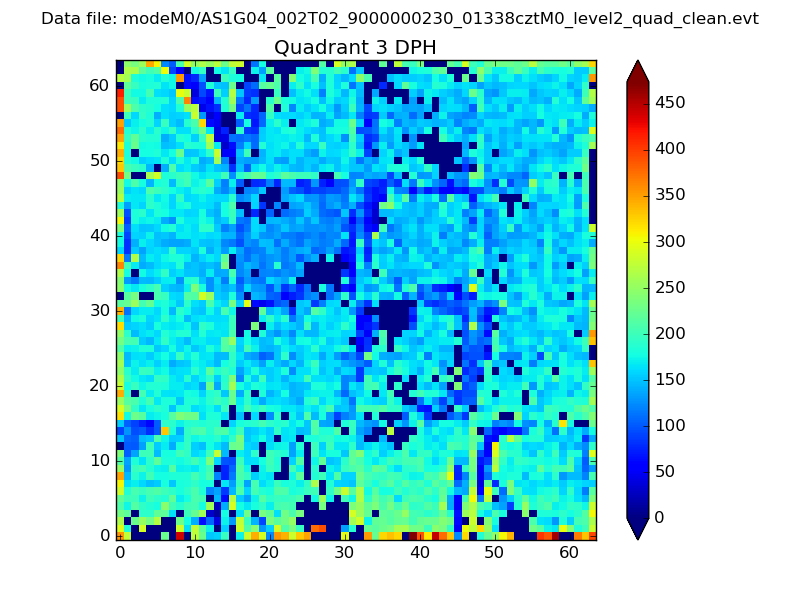 |
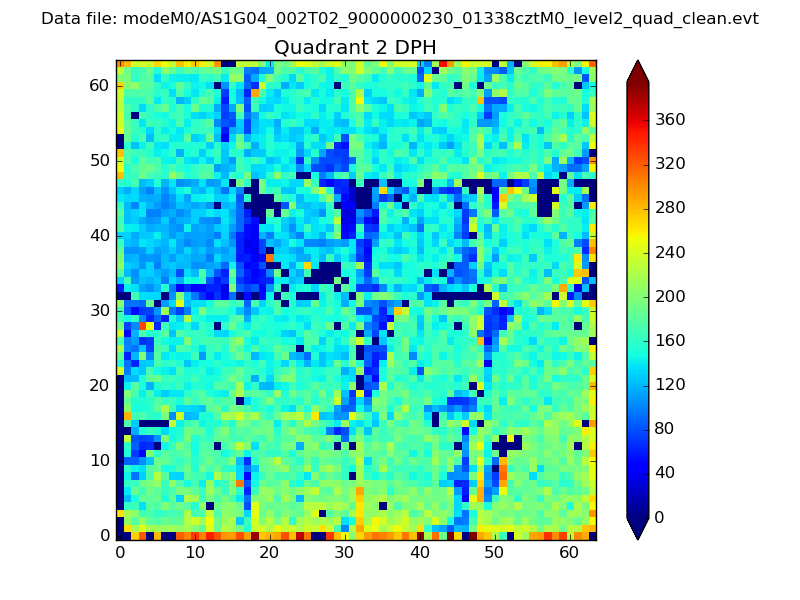 |
Quadrant C |
| Plot type | Count rate plots | Images |
|---|---|---|
| Comparison with Poisson distribution Blue bars denote a histogram of data divided into 1 sec bins. Red curve is a Poisson curve with rate = median count rate of data. |
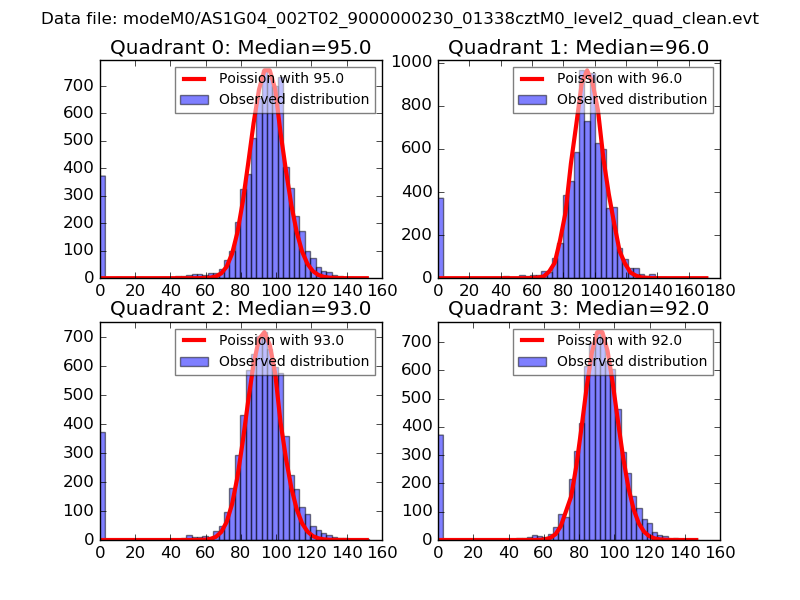 |
 |
| Quadrant-wise count rates Data is divided into 100 sec bins |
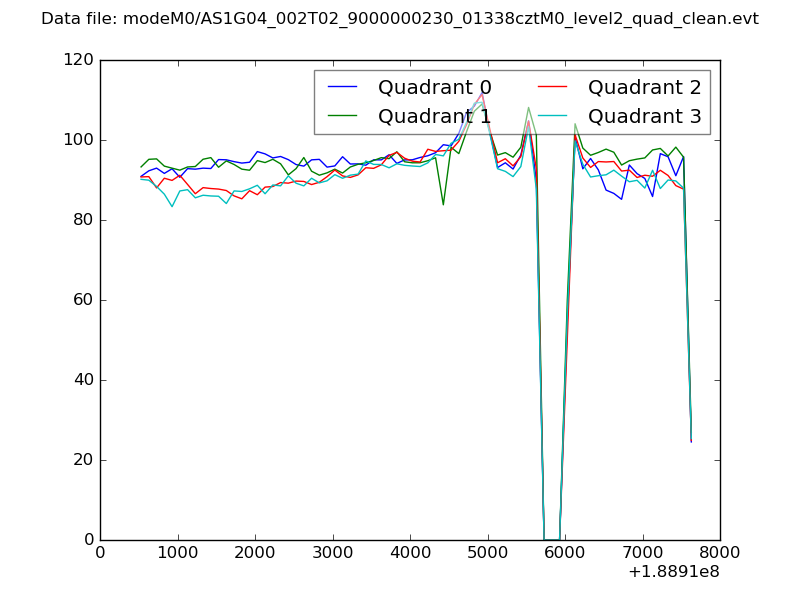 |
|
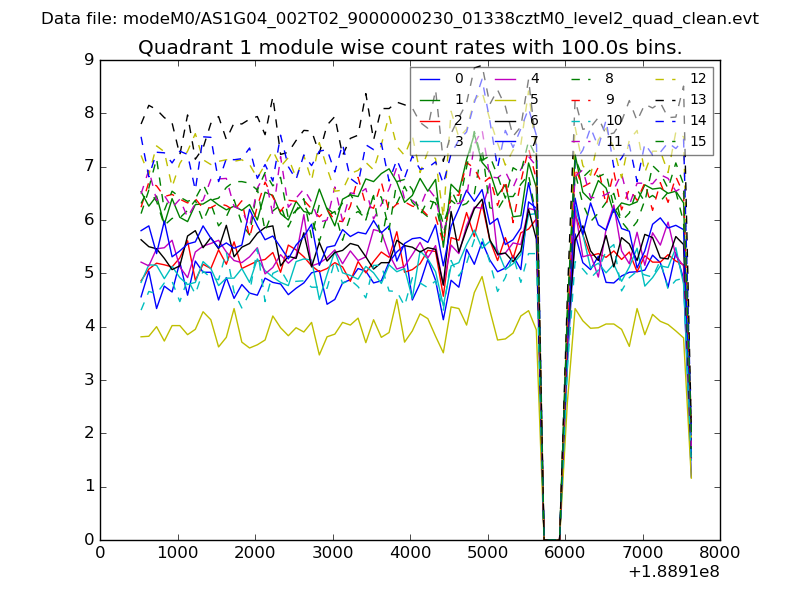
| Module-wise count rates for Quadrant A Data is divided into 100 sec bins |
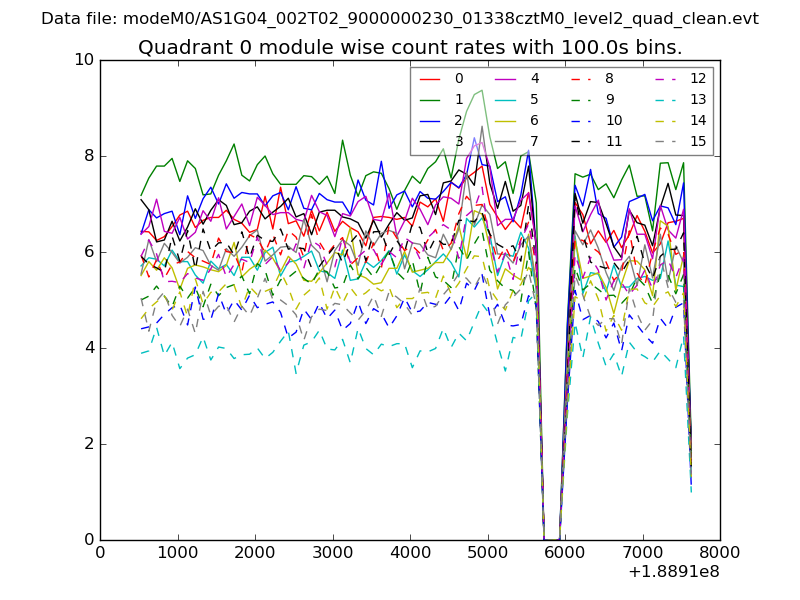 |
 |
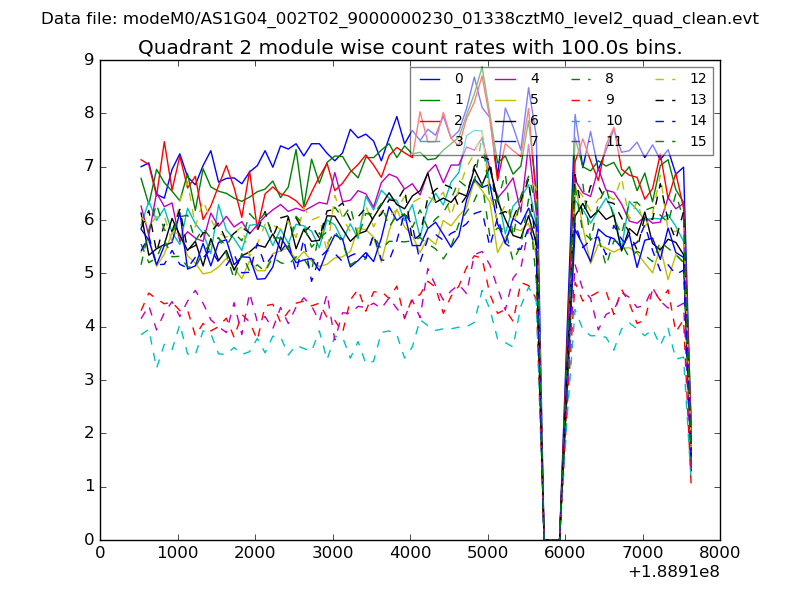
| Module-wise count rates for Quadrant B Data is divided into 100 sec bins |
 |
 |
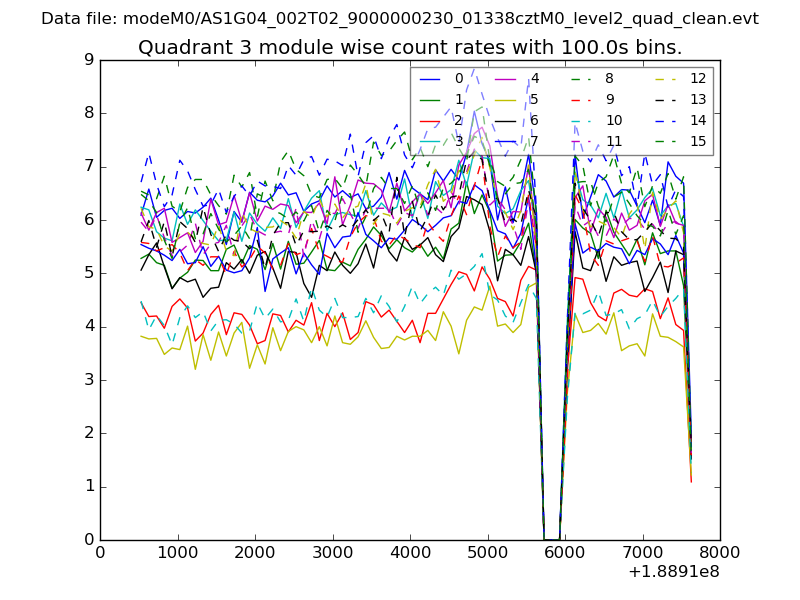
| Module-wise count rates for Quadrant C Data is divided into 100 sec bins |
 |
 |
| Module-wise count rates for Quadrant D Data is divided into 100 sec bins |
 |
 |
| Parameter | Plot |
|---|---|
| CZT HV Monitor | 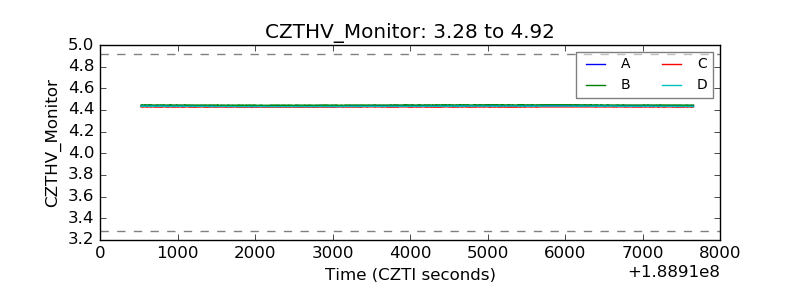 |
| D_VDD | 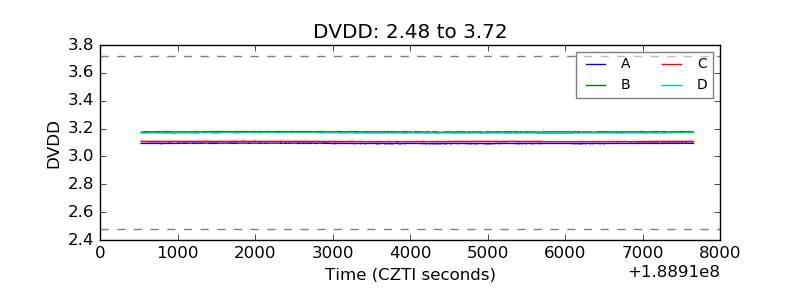 |
| Temperature 1 | 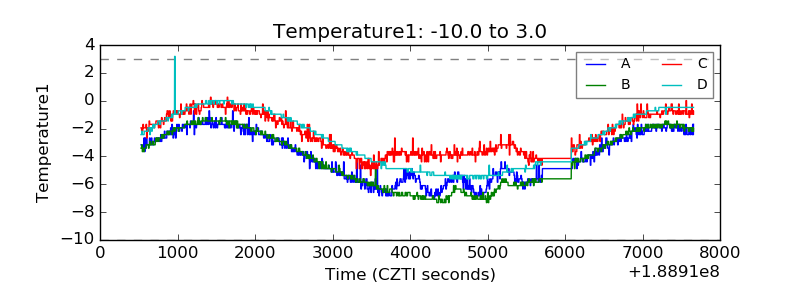 |
| Veto HV Monitor | 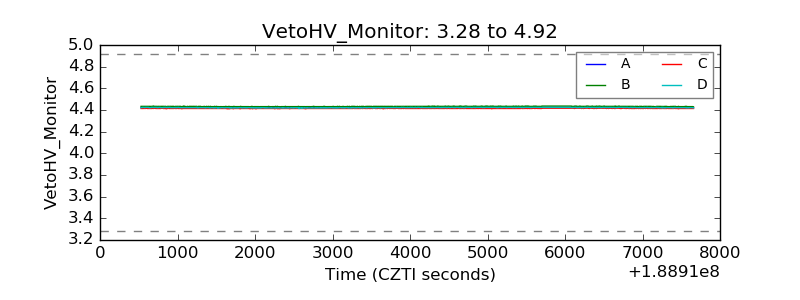 |
| Veto LLD | 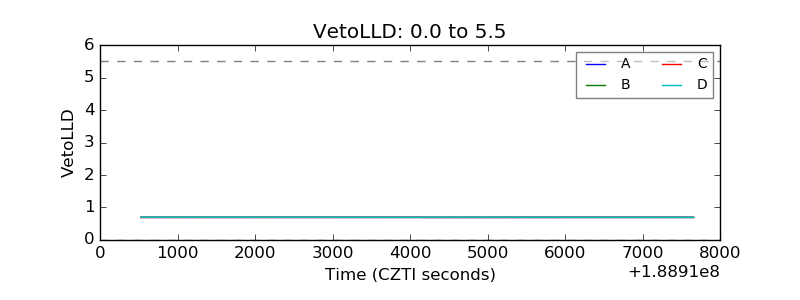 |
| Alpha Counter | 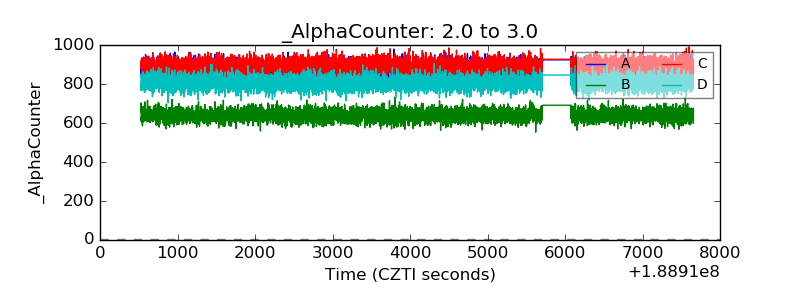 |
| _CPM_Rate | 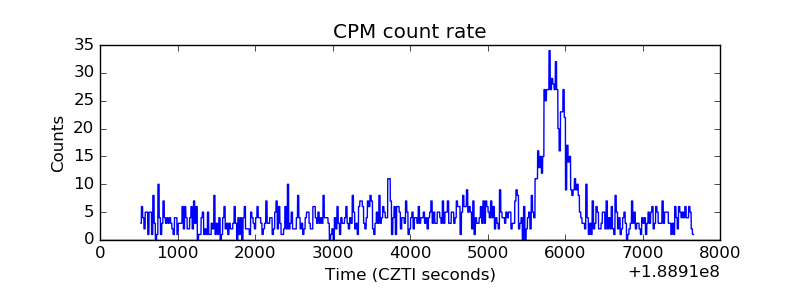 |
| CZT Counter | 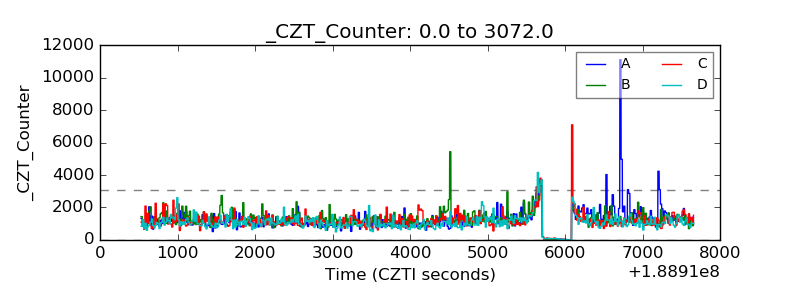 |
| +2.5 Volts monitor | 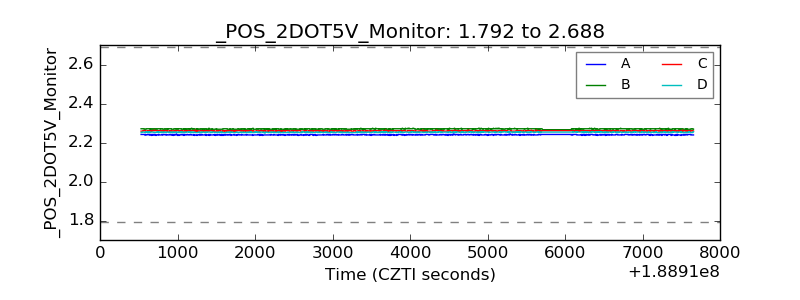 |
| +5 Volts monitor |  |
| _ROLL_ROT | 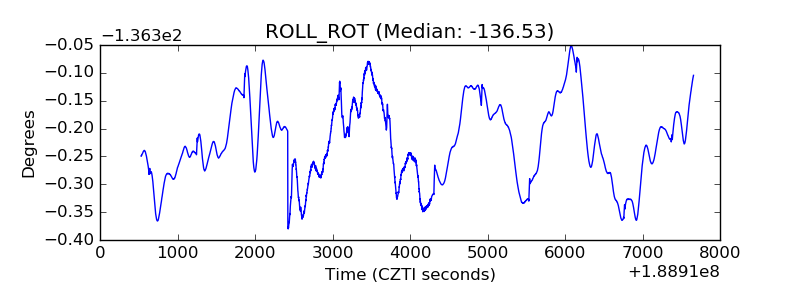 |
| _Roll_DEC | 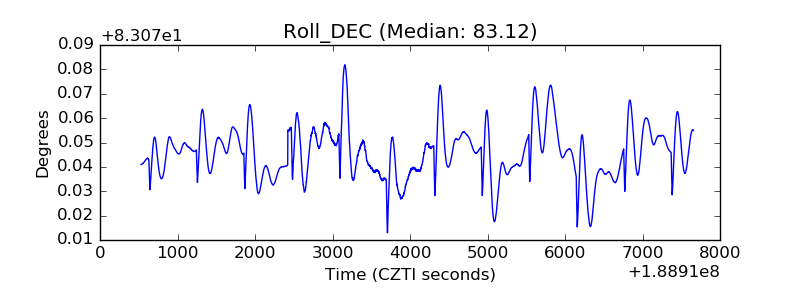 |
| _Roll_RA | 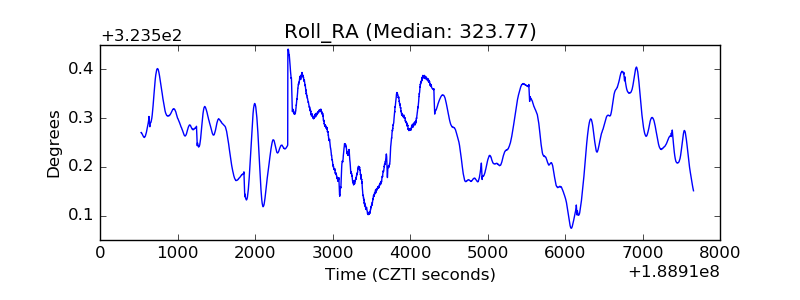 |
| Veto Counter | 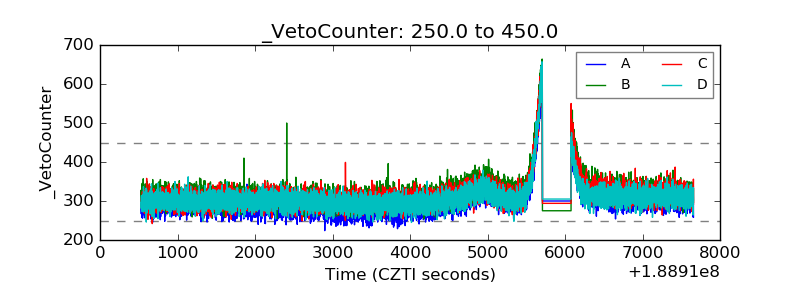 |