| Param | Original file | Final file |
|---|---|---|
| Filename | modeM0/AS1G04_002T02_9000000230_01340cztM0_level2.evt | modeM0/AS1G04_002T02_9000000230_01340cztM0_level2_quad_clean.evt |
| Size (bytes) | 1,095,955,200 | 96,264,000 |
| Size | 1.0 GB | 91.8 MB |
| Events in quadrant A | 8,257,027 | 628,151 |
| Events in quadrant B | 8,979,716 | 624,792 |
| Events in quadrant C | 7,969,451 | 608,414 |
| Events in quadrant D | 7,556,175 | 601,970 |
| Mode M9 | |||
|---|---|---|---|
| Quadrant | BADHDUFLAG | Total packets | Discarded packets |
| A | 0 | 8 | 0 |
| B | 0 | 8 | 0 |
| C | 0 | 8 | 0 |
| D | 0 | 8 | 0 |
| Mode M0 | |||
|---|---|---|---|
| Quadrant | BADHDUFLAG | Total packets | Discarded packets |
| A | 0 | 29086 | 2 |
| B | 0 | 31280 | 1 |
| C | 0 | 28283 | 1 |
| D | 0 | 27070 | 1 |
| Mode SS | |||
|---|---|---|---|
| Quadrant | BADHDUFLAG | Total packets | Discarded packets |
| A | 0 | 132 | 0 |
| B | 0 | 132 | 0 |
| C | 0 | 132 | 0 |
| D | 0 | 132 | 0 |
| Quadrant | Total seconds | Saturated seconds | Saturation percentage |
|---|---|---|---|
| A | 6478 | 18 | 0.277864% |
| B | 6478 | 67 | 1.034270% |
| C | 6478 | 23 | 0.355048% |
| D | 6478 | 68 | 1.049707% |
Noise dominated data is calculated using 1-second bins in cleaned event files. If a bin has >2000 counts, and if more than 50% of those come from <1% of pixels, then it is considered to be noise-dominated and hence unusable.
| Quadrant | # 1 sec bins | Bins with >0 counts | Bins with >2000 counts | High rate bins dominated by noise | Noise dominated (total time) | Noise dominated (detector-on time) | Marked lightcurve |
|---|---|---|---|---|---|---|---|
| A | 7283 | 6479 | 268 | 268 | 3.68% | 4.14% | 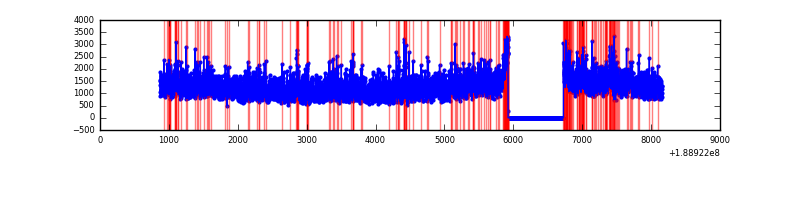 |
| B | 7283 | 6478 | 654 | 654 | 8.98% | 10.10% | 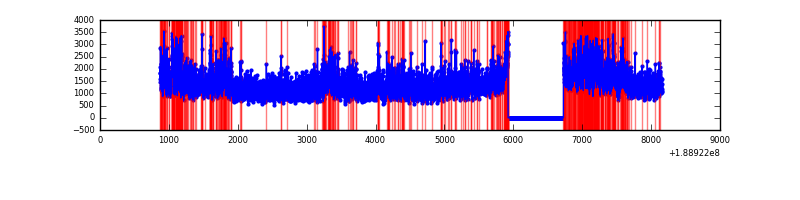 |
| C | 7283 | 6478 | 201 | 201 | 2.76% | 3.10% | 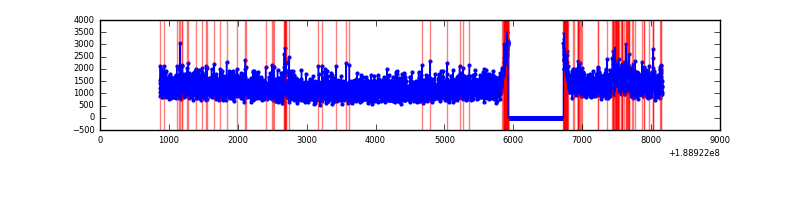 |
| D | 7283 | 6478 | 240 | 240 | 3.30% | 3.70% | 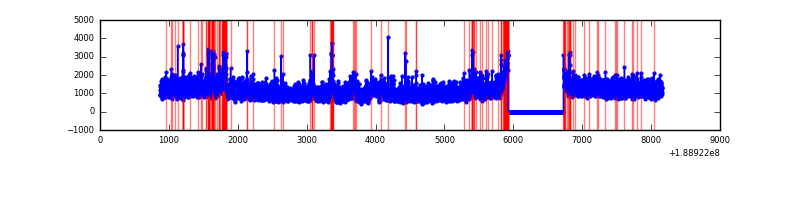 |
Top three noisy pixels from each quadrant. If the there are fewer than three noisy pixels in the level2.evt file, extra rows are filled as -1
| Pixel properties | Quadrant properties | ||||||
|---|---|---|---|---|---|---|---|
| Quadrant | DetID | PixID | Counts | Sigma | Mean | Median | Sigma |
| A | 4 | 32 | 594239 | 1240.48 | 1975 | 1990 | 477.4 |
| A | 15 | 127 | 63021 | 127.83 | 1975 | 1990 | 477.4 |
| A | 14 | 5 | 9343 | 15.4 | 1975 | 1990 | 477.4 |
| B | 8 | 4 | 844097 | 1744.67 | 2048 | 2054 | 482.6 |
| B | 6 | 53 | 173973 | 356.21 | 2048 | 2054 | 482.6 |
| B | 15 | 22 | 46816 | 92.74 | 2048 | 2054 | 482.6 |
| C | 15 | 241 | 330392 | 623.07 | 1890 | 1960 | 527.1 |
| C | 3 | 9 | 198747 | 373.33 | 1890 | 1960 | 527.1 |
| C | 3 | 79 | 31372 | 55.8 | 1890 | 1960 | 527.1 |
| D | 10 | 84 | 295929 | 520.13 | 1830 | 1894 | 565.3 |
| D | 1 | 83 | 228603 | 401.03 | 1830 | 1894 | 565.3 |
| D | 13 | 252 | 68287 | 117.44 | 1830 | 1894 | 565.3 |
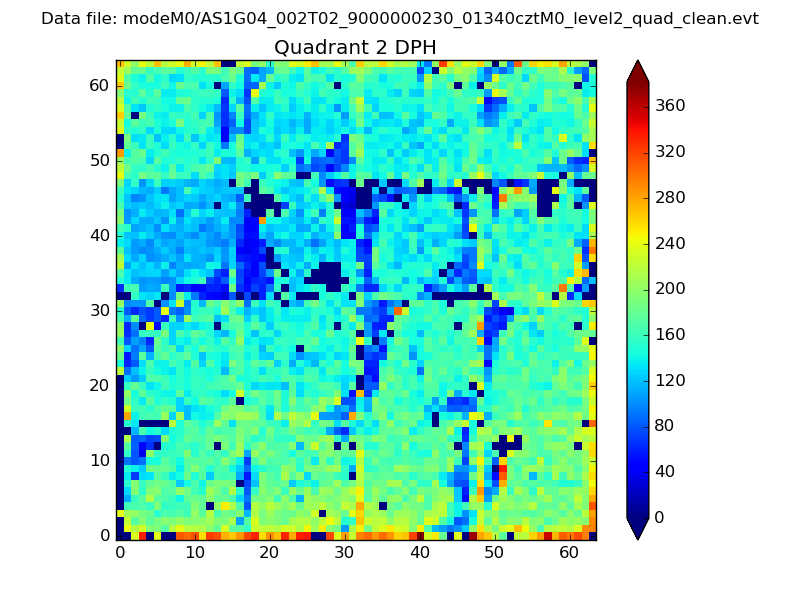
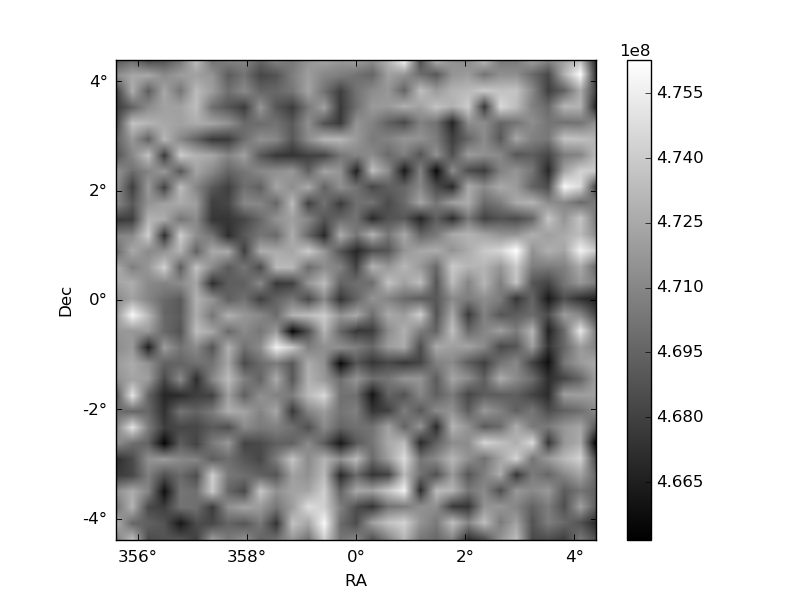
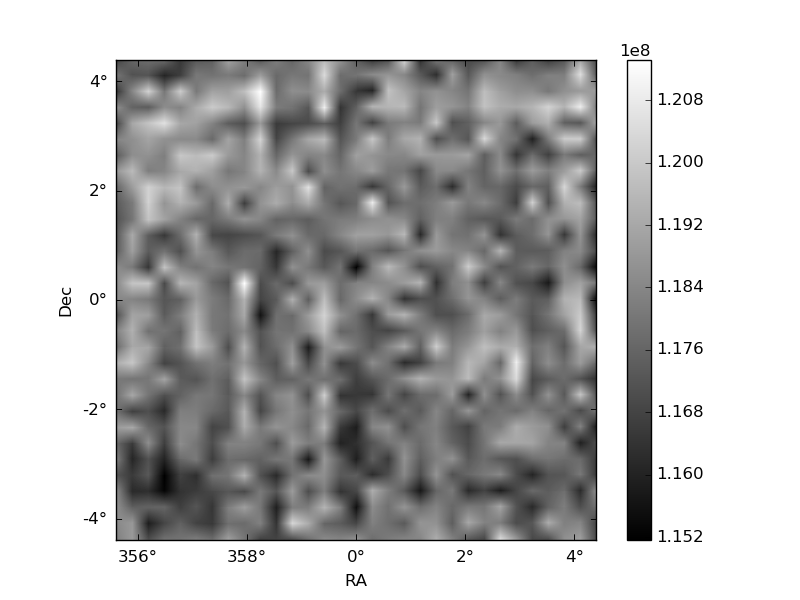
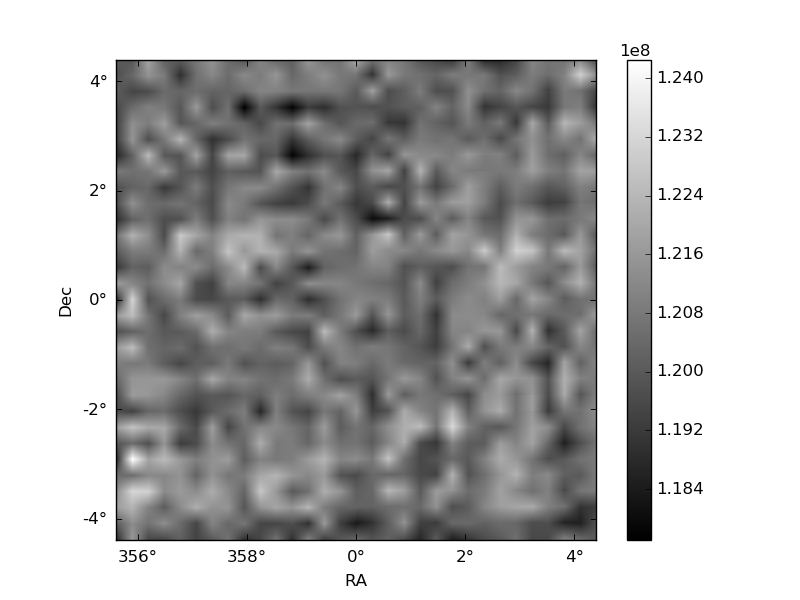
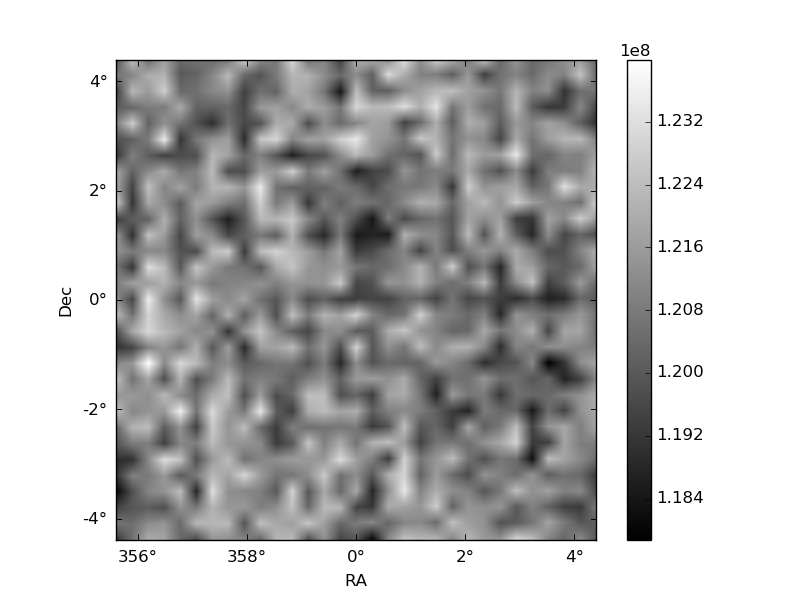
Histogram calculated using DETX and DETY for each event in the final _common_clean file
| Quadrant A | 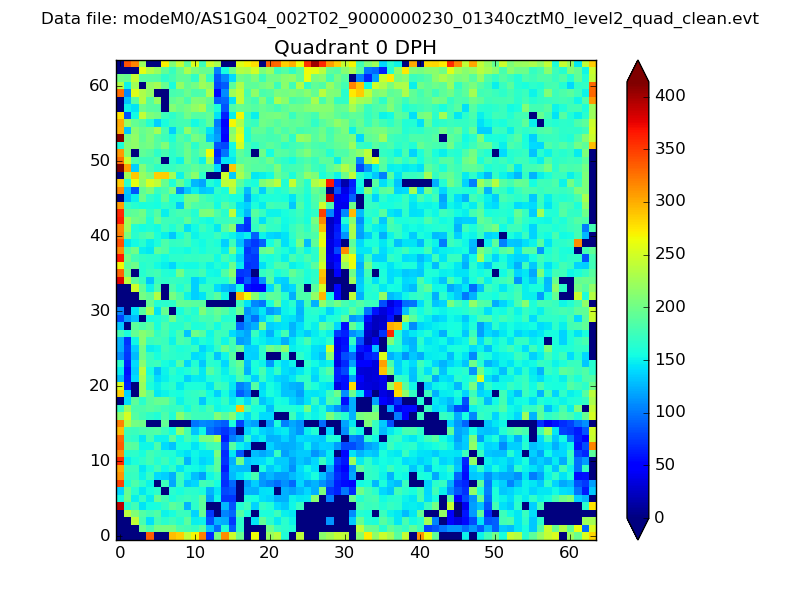 |
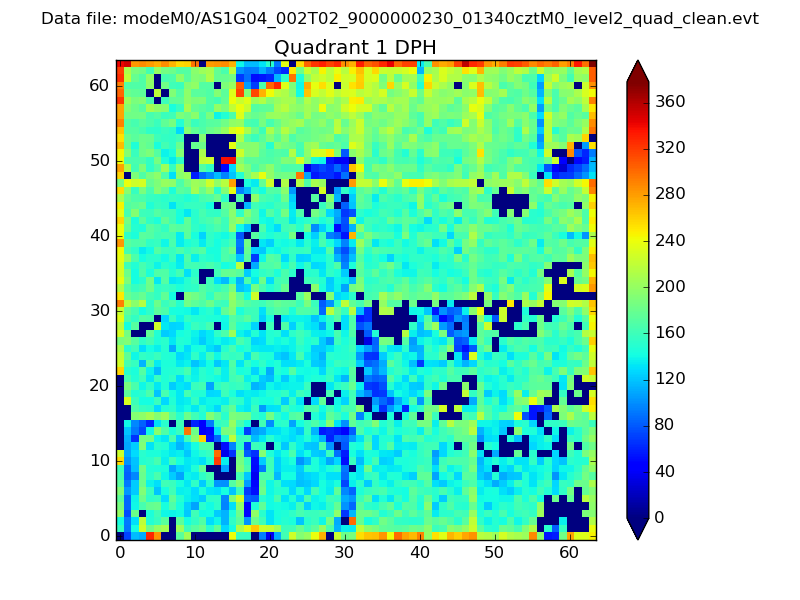 |
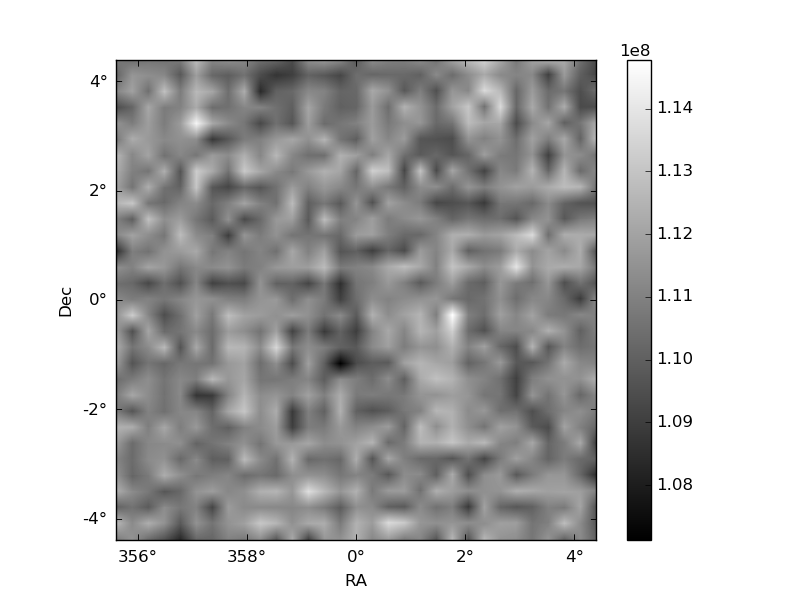
Quadrant B |
|---|---|---|---|
| Quadrant D | 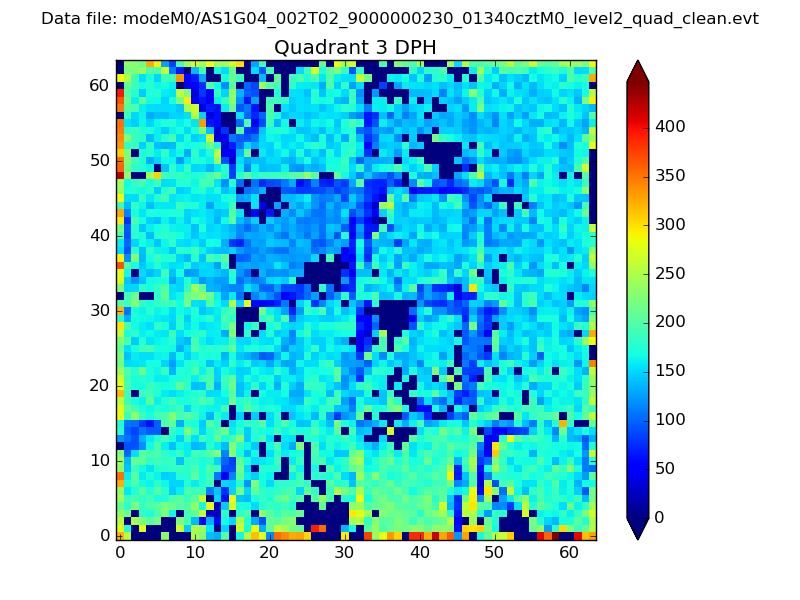 |
 |
Quadrant C |
| Plot type | Count rate plots | Images |
|---|---|---|
| Comparison with Poisson distribution Blue bars denote a histogram of data divided into 1 sec bins. Red curve is a Poisson curve with rate = median count rate of data. |
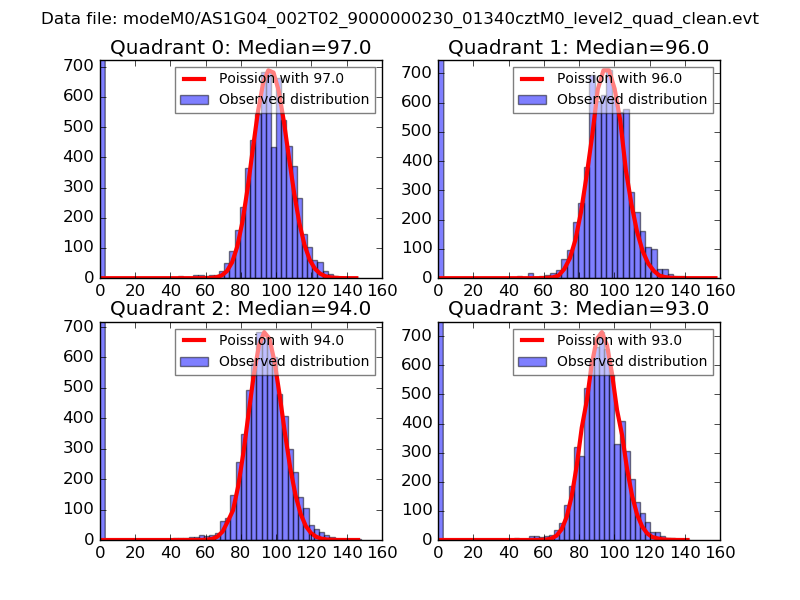 |
 |
| Quadrant-wise count rates Data is divided into 100 sec bins |
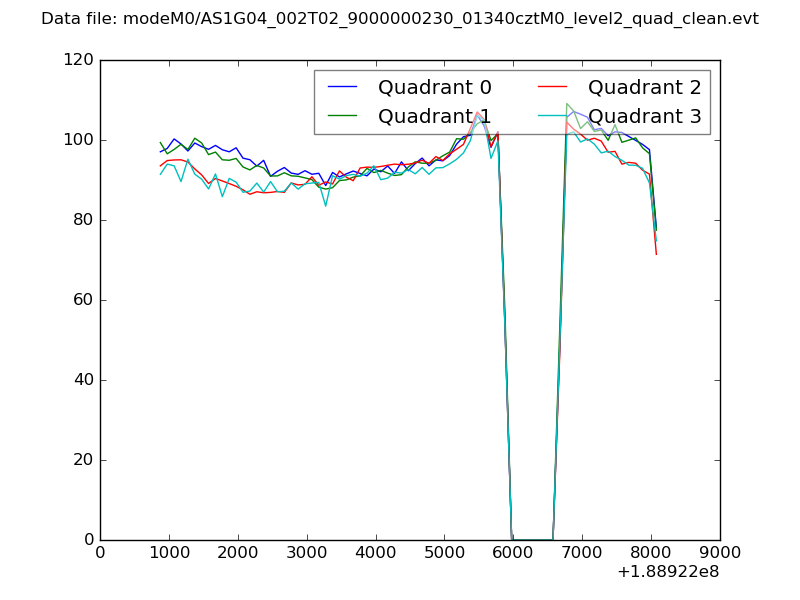 |
|
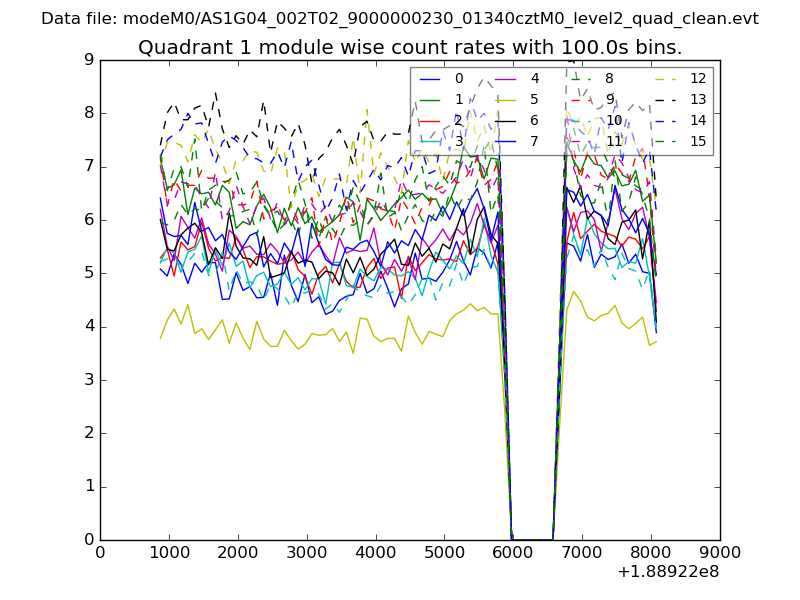
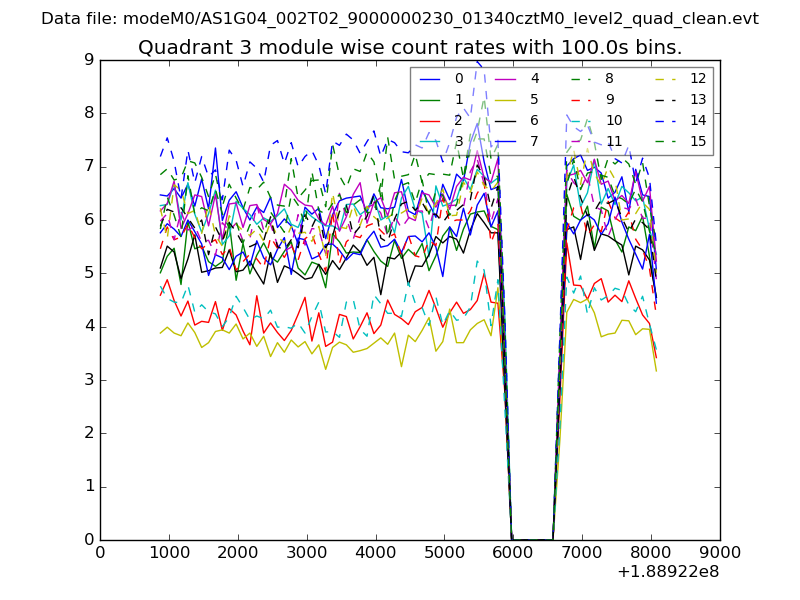
| Module-wise count rates for Quadrant A Data is divided into 100 sec bins |
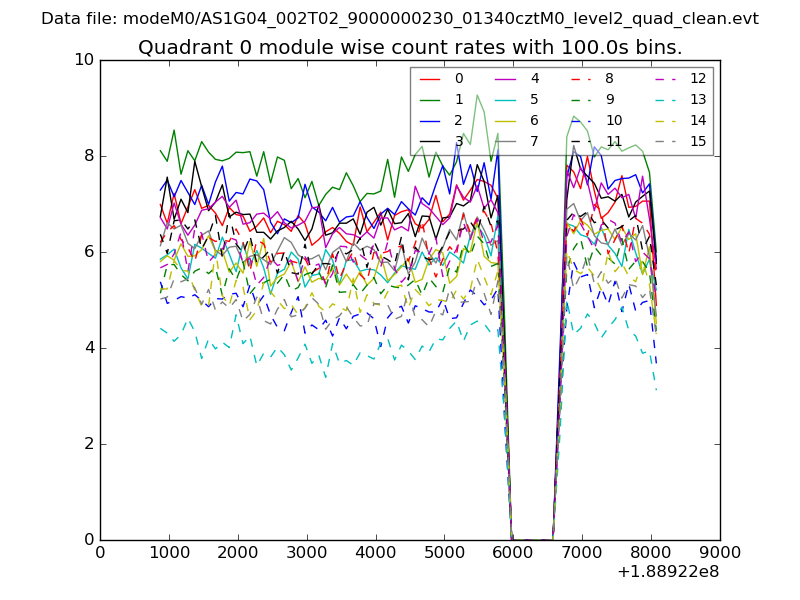 |
 |
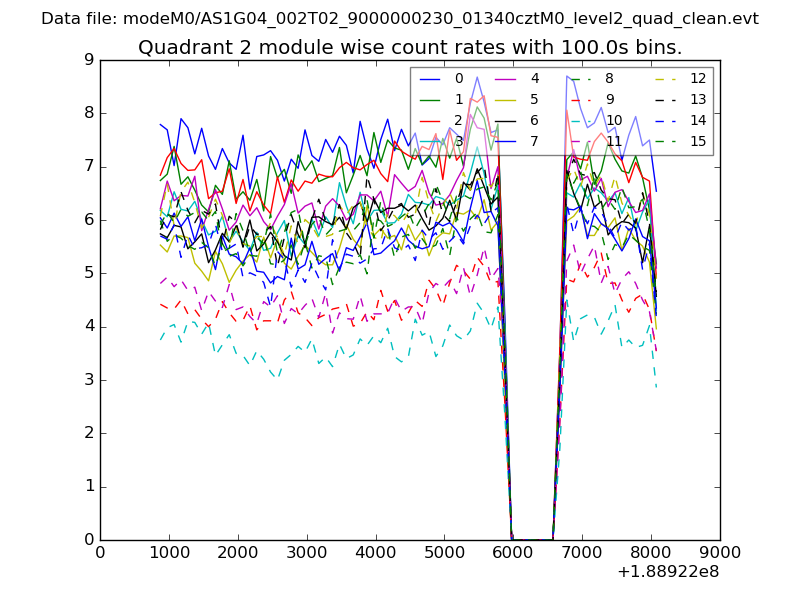
| Module-wise count rates for Quadrant B Data is divided into 100 sec bins |
 |
 |
| Module-wise count rates for Quadrant C Data is divided into 100 sec bins |
 |
 |
| Module-wise count rates for Quadrant D Data is divided into 100 sec bins |
 |
 |
| Parameter | Plot |
|---|---|
| CZT HV Monitor | 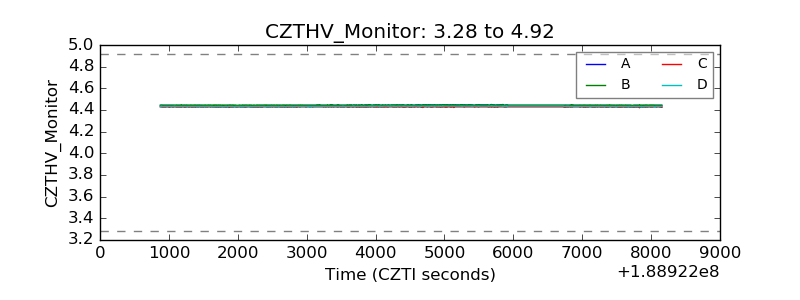 |
| D_VDD | 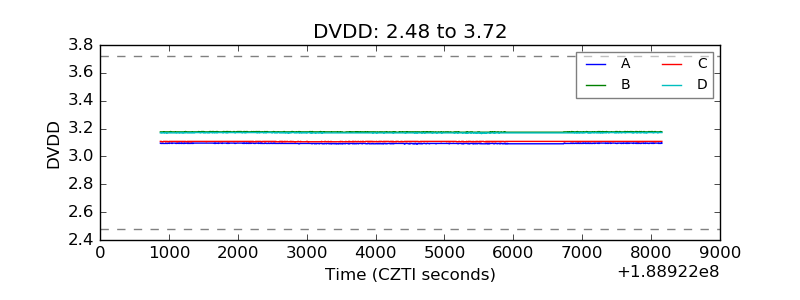 |
| Temperature 1 | 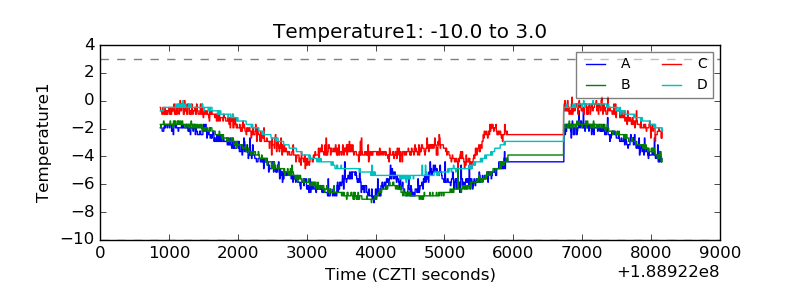 |
| Veto HV Monitor | 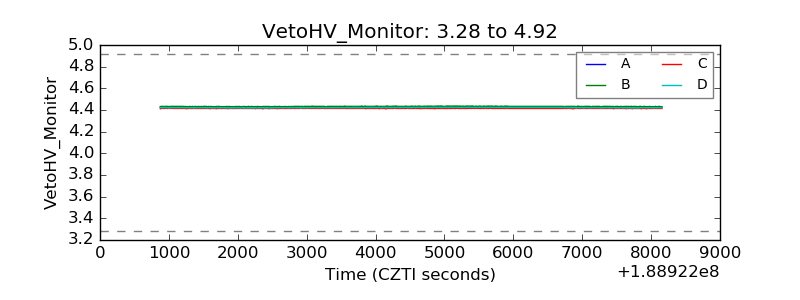 |
| Veto LLD | 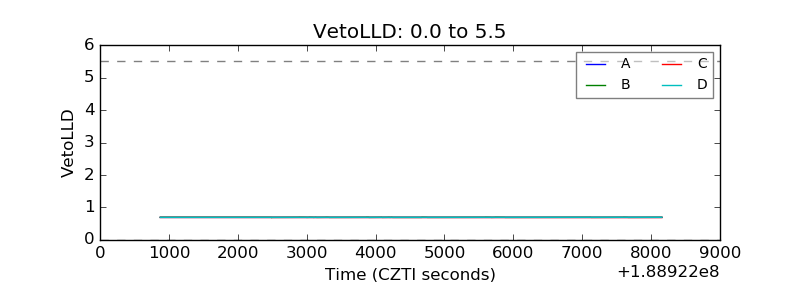 |
| Alpha Counter | 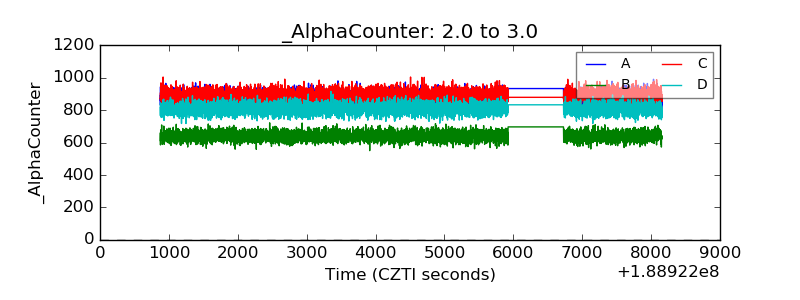 |
| _CPM_Rate | 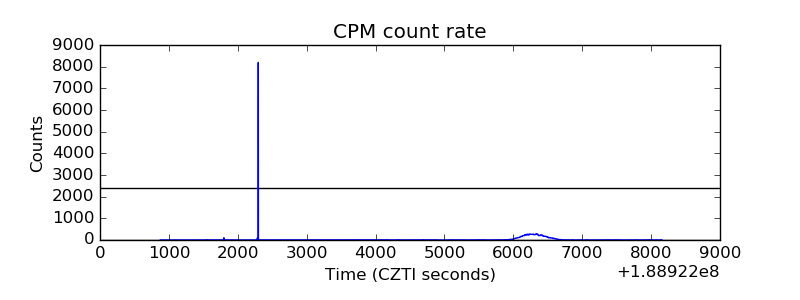 |
| CZT Counter | 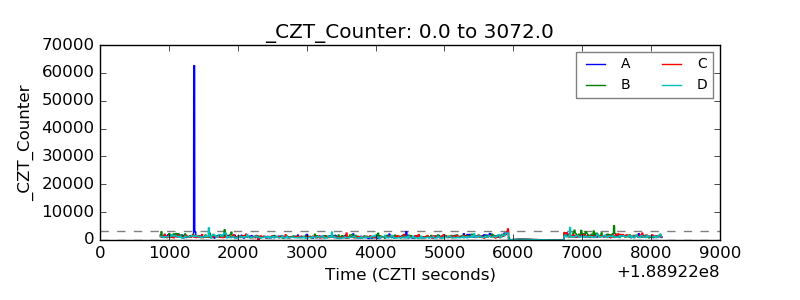 |
| +2.5 Volts monitor |  |
| +5 Volts monitor |  |
| _ROLL_ROT | 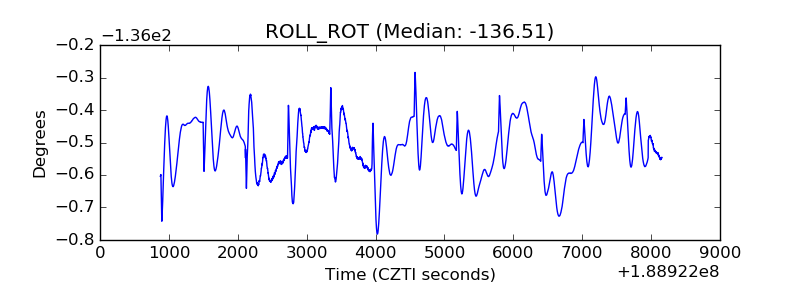 |
| _Roll_DEC | 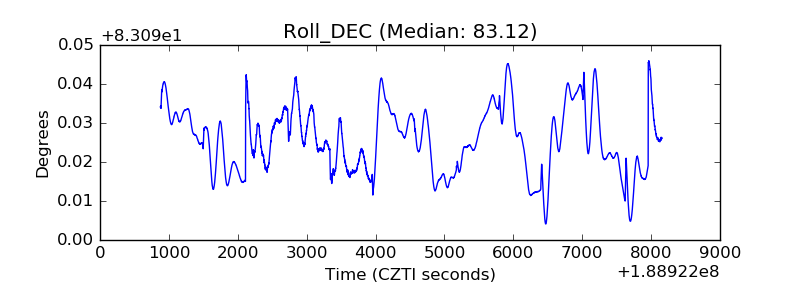 |
| _Roll_RA | 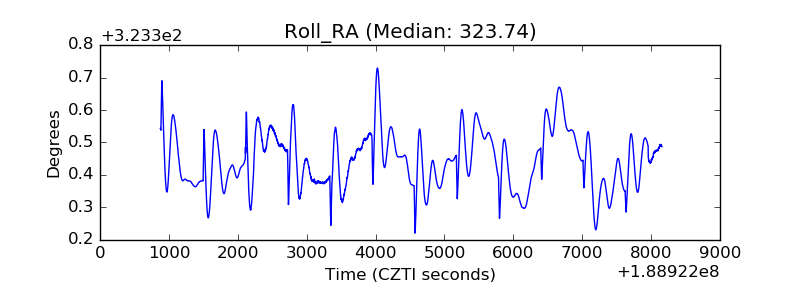 |
| Veto Counter | 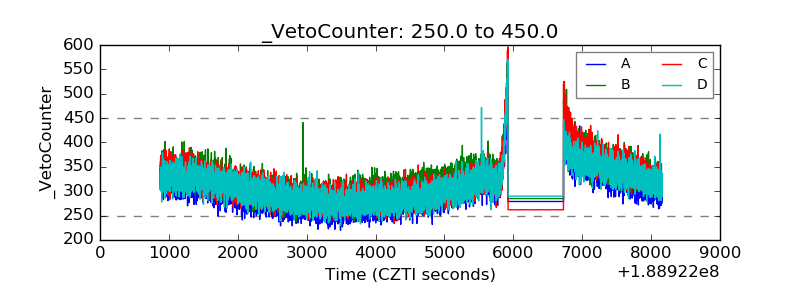 |