| Param | Original file | Final file |
|---|---|---|
| Filename | modeM0/AS1G04_002T02_9000000230_01341cztM0_level2.evt | modeM0/AS1G04_002T02_9000000230_01341cztM0_level2_quad_clean.evt |
| Size (bytes) | 1,095,989,760 | 99,869,760 |
| Size | 1.0 GB | 95.2 MB |
| Events in quadrant A | 8,504,018 | 649,619 |
| Events in quadrant B | 8,831,113 | 648,720 |
| Events in quadrant C | 8,133,477 | 635,344 |
| Events in quadrant D | 7,288,042 | 632,053 |
| Mode M9 | |||
|---|---|---|---|
| Quadrant | BADHDUFLAG | Total packets | Discarded packets |
| A | 0 | 10 | 0 |
| B | 0 | 10 | 0 |
| C | 0 | 10 | 0 |
| D | 0 | 10 | 0 |
| Mode M0 | |||
|---|---|---|---|
| Quadrant | BADHDUFLAG | Total packets | Discarded packets |
| A | 0 | 29901 | 2 |
| B | 0 | 30889 | 1 |
| C | 0 | 28812 | 1 |
| D | 0 | 26303 | 1 |
| Mode SS | |||
|---|---|---|---|
| Quadrant | BADHDUFLAG | Total packets | Discarded packets |
| A | 0 | 134 | 0 |
| B | 0 | 134 | 0 |
| C | 0 | 134 | 0 |
| D | 0 | 134 | 0 |
| Quadrant | Total seconds | Saturated seconds | Saturation percentage |
|---|---|---|---|
| A | 6578 | 15 | 0.228033% |
| B | 6578 | 53 | 0.805716% |
| C | 6578 | 19 | 0.288842% |
| D | 6578 | 23 | 0.349650% |
Noise dominated data is calculated using 1-second bins in cleaned event files. If a bin has >2000 counts, and if more than 50% of those come from <1% of pixels, then it is considered to be noise-dominated and hence unusable.
| Quadrant | # 1 sec bins | Bins with >0 counts | Bins with >2000 counts | High rate bins dominated by noise | Noise dominated (total time) | Noise dominated (detector-on time) | Marked lightcurve |
|---|---|---|---|---|---|---|---|
| A | 7548 | 6579 | 433 | 433 | 5.74% | 6.58% | 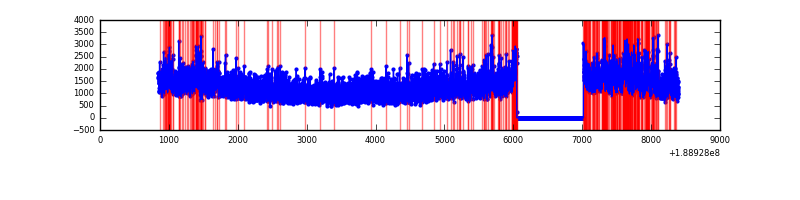 |
| B | 7548 | 6579 | 526 | 526 | 6.97% | 8.00% | 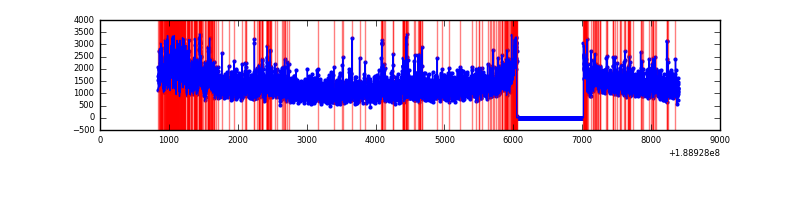 |
| C | 7548 | 6579 | 227 | 227 | 3.01% | 3.45% | 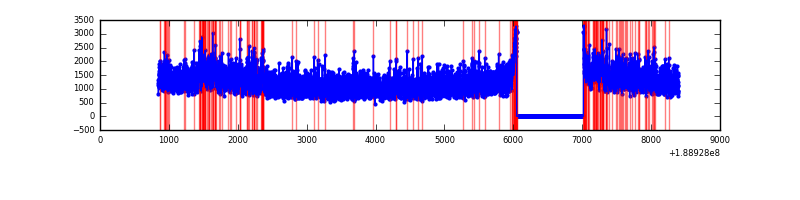 |
| D | 7548 | 6579 | 142 | 142 | 1.88% | 2.16% | 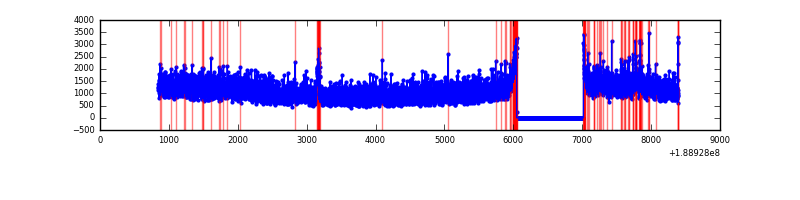 |
Top three noisy pixels from each quadrant. If the there are fewer than three noisy pixels in the level2.evt file, extra rows are filled as -1
| Pixel properties | Quadrant properties | ||||||
|---|---|---|---|---|---|---|---|
| Quadrant | DetID | PixID | Counts | Sigma | Mean | Median | Sigma |
| A | 4 | 32 | 510327 | 1047.17 | 2000 | 2012 | 485.4 |
| A | 15 | 127 | 308819 | 632.05 | 2000 | 2012 | 485.4 |
| A | 11 | 79 | 8009 | 12.35 | 2000 | 2012 | 485.4 |
| B | 8 | 4 | 503573 | 1020.39 | 2083 | 2092 | 491.5 |
| B | 6 | 53 | 113113 | 225.9 | 2083 | 2092 | 491.5 |
| B | 5 | 191 | 68068 | 134.24 | 2083 | 2092 | 491.5 |
| C | 15 | 241 | 309088 | 573.2 | 1927 | 1991 | 535.8 |
| C | 3 | 9 | 240326 | 444.86 | 1927 | 1991 | 535.8 |
| C | 3 | 79 | 27424 | 47.47 | 1927 | 1991 | 535.8 |
| D | 10 | 125 | 60111 | 100.46 | 1869 | 1939 | 579.0 |
| D | 13 | 252 | 55108 | 91.82 | 1869 | 1939 | 579.0 |
| D | 10 | 84 | 47117 | 78.02 | 1869 | 1939 | 579.0 |
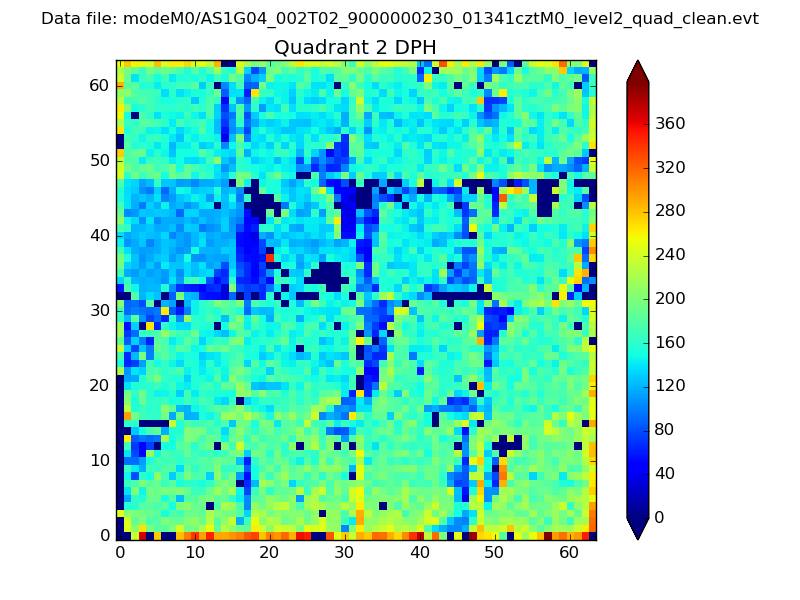
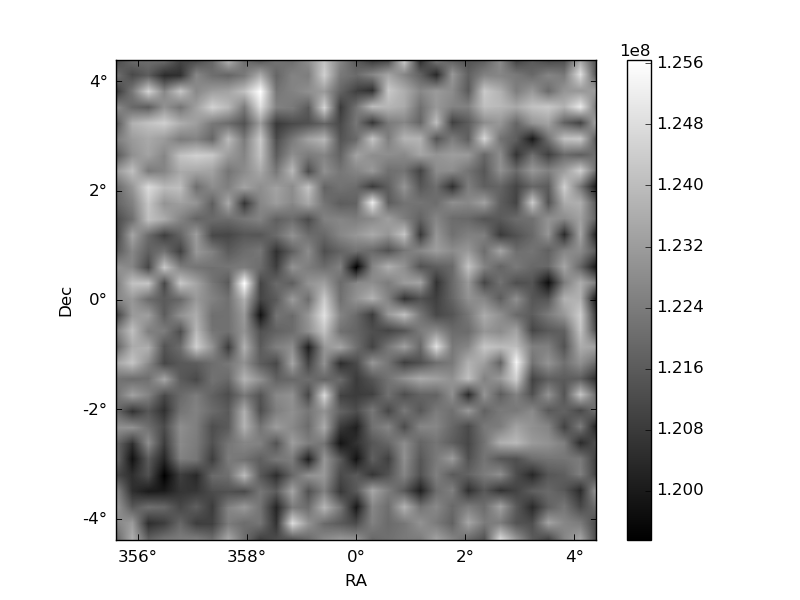
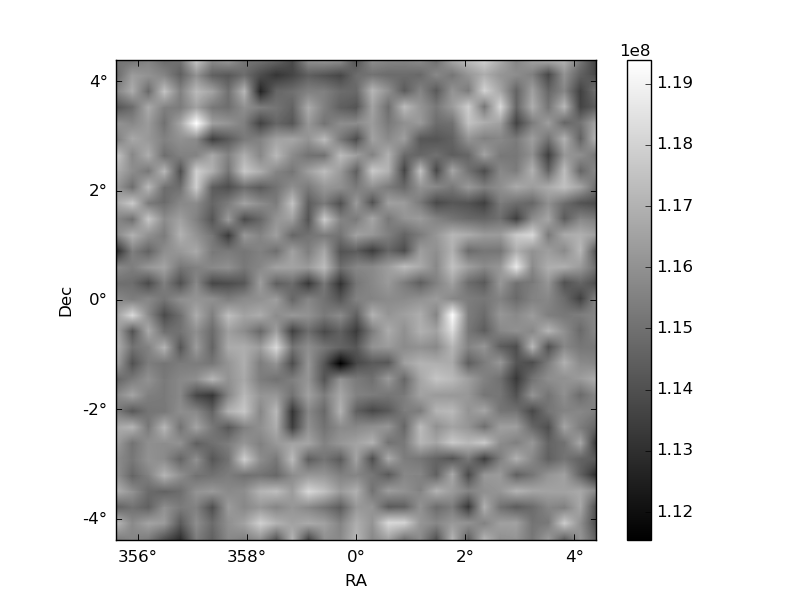
Histogram calculated using DETX and DETY for each event in the final _common_clean file
| Quadrant A | 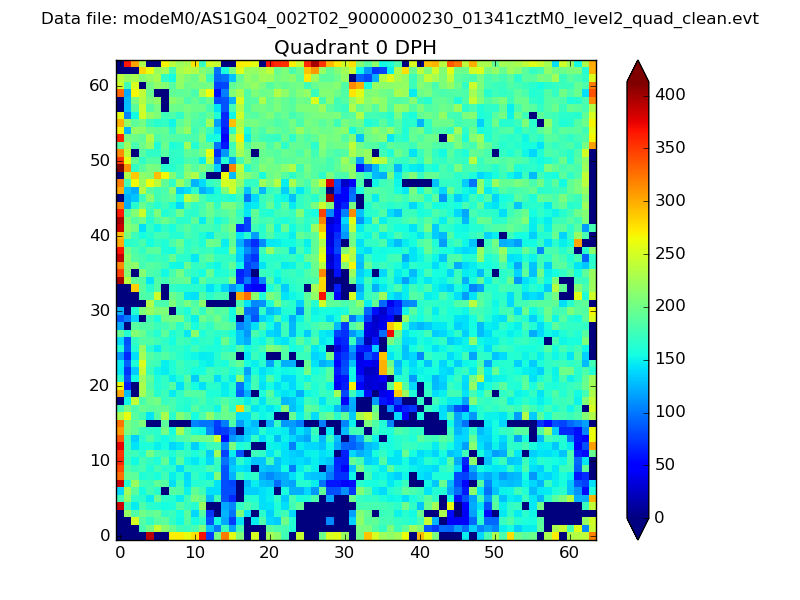 |
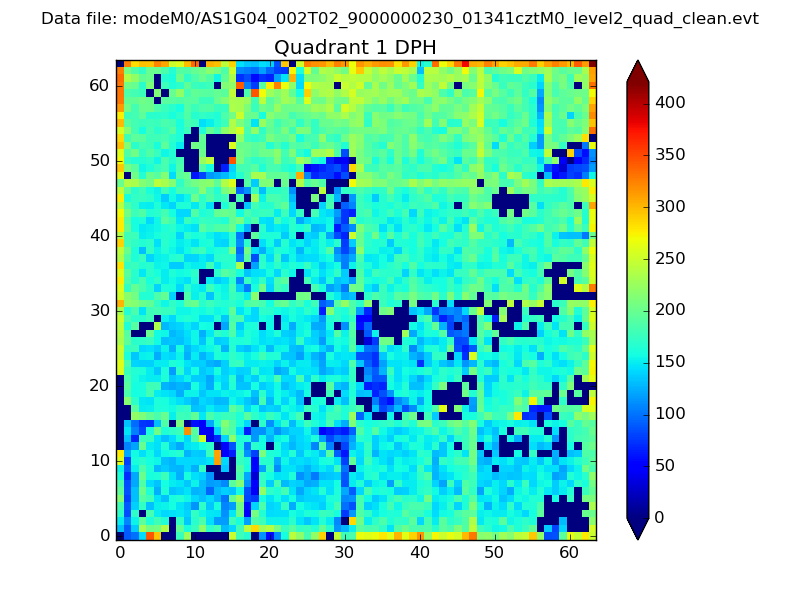 |
Quadrant B |
|---|---|---|---|
| Quadrant D | 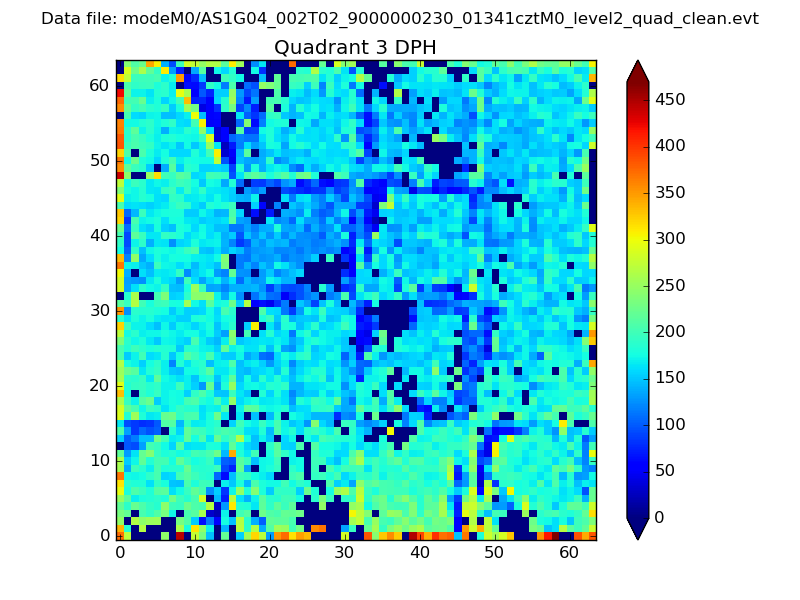 |
 |
Quadrant C |
| Plot type | Count rate plots | Images |
|---|---|---|
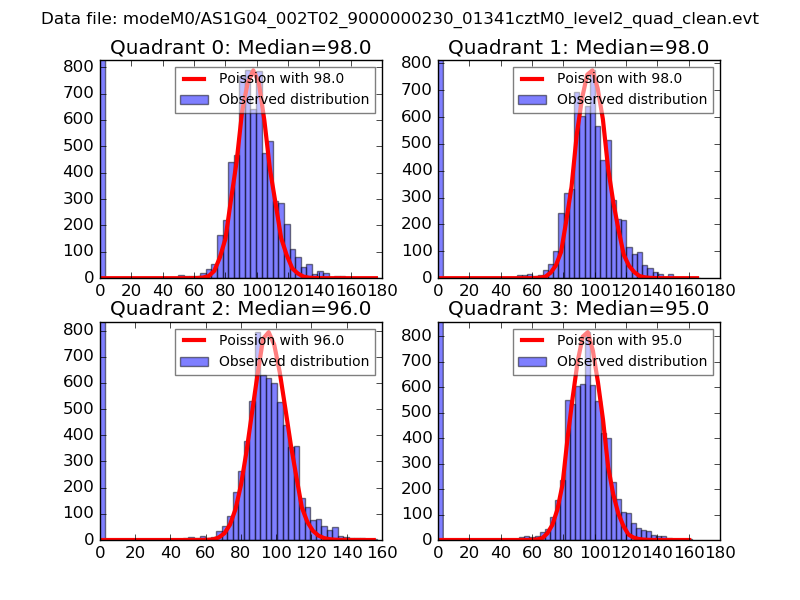
| Comparison with Poisson distribution Blue bars denote a histogram of data divided into 1 sec bins. Red curve is a Poisson curve with rate = median count rate of data. |
 |
 |
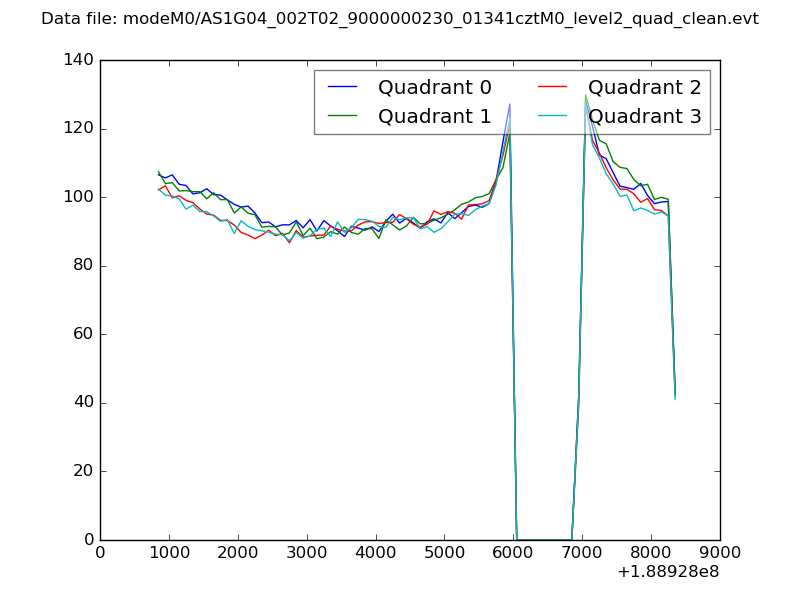
| Quadrant-wise count rates Data is divided into 100 sec bins |
 |
|
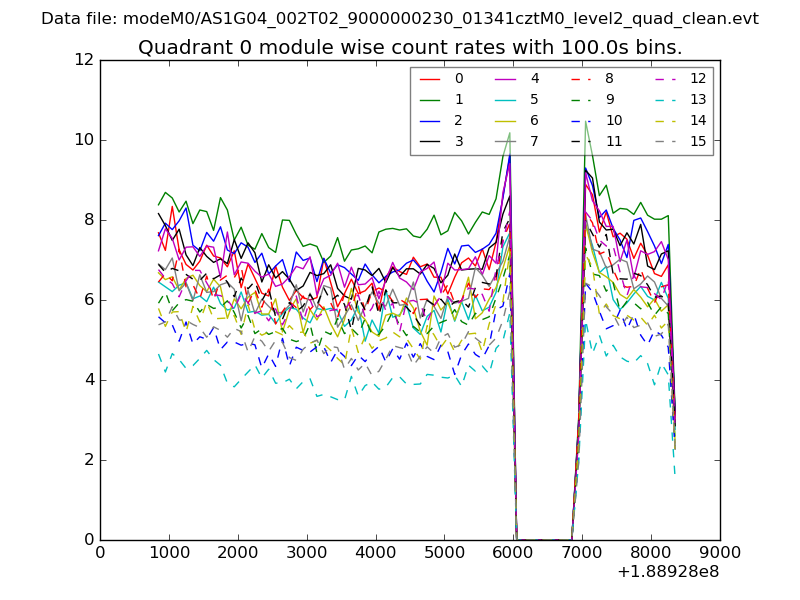
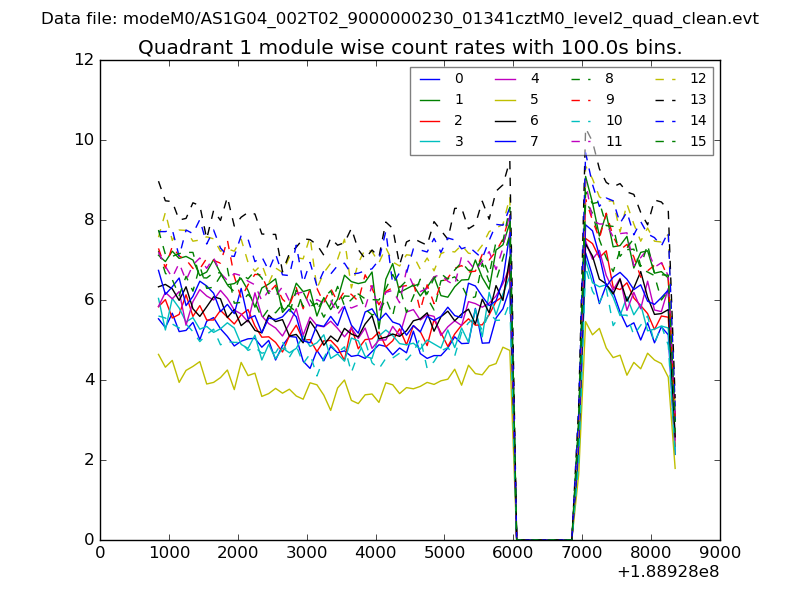
| Module-wise count rates for Quadrant A Data is divided into 100 sec bins |
 |
 |
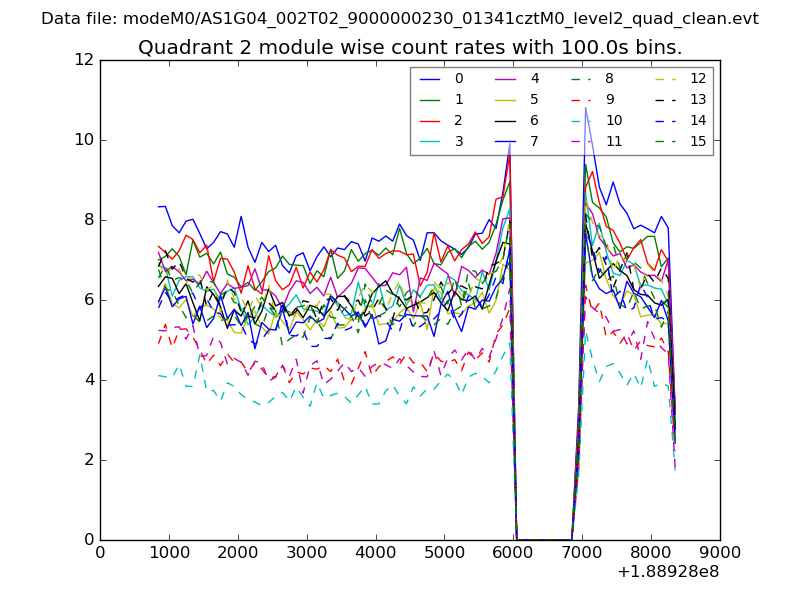
| Module-wise count rates for Quadrant B Data is divided into 100 sec bins |
 |
 |
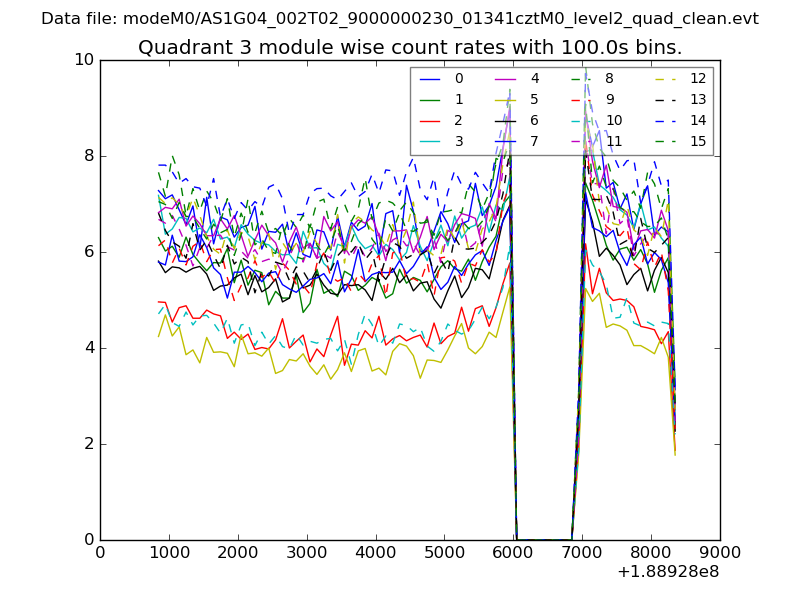
| Module-wise count rates for Quadrant C Data is divided into 100 sec bins |
 |
 |
| Module-wise count rates for Quadrant D Data is divided into 100 sec bins |
 |
 |
| Parameter | Plot |
|---|---|
| CZT HV Monitor | 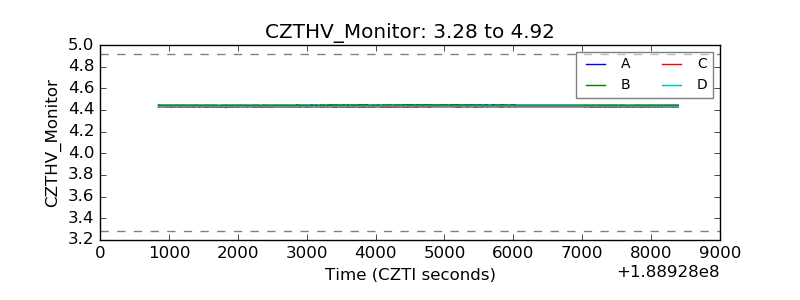 |
| D_VDD | 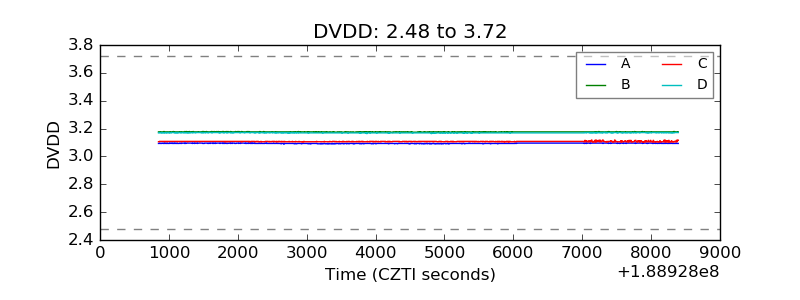 |
| Temperature 1 | 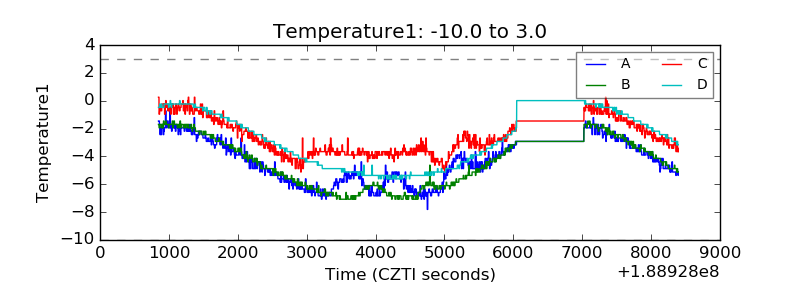 |
| Veto HV Monitor | 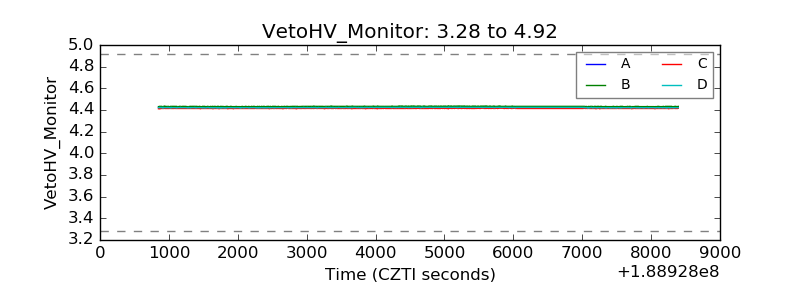 |
| Veto LLD | 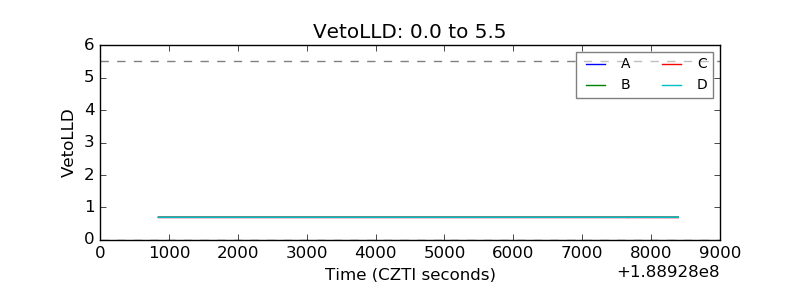 |
| Alpha Counter | 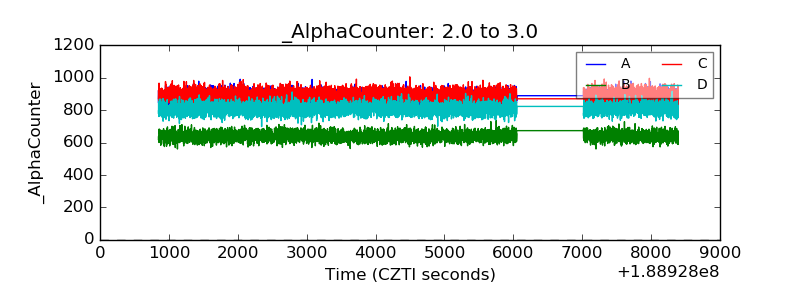 |
| _CPM_Rate | 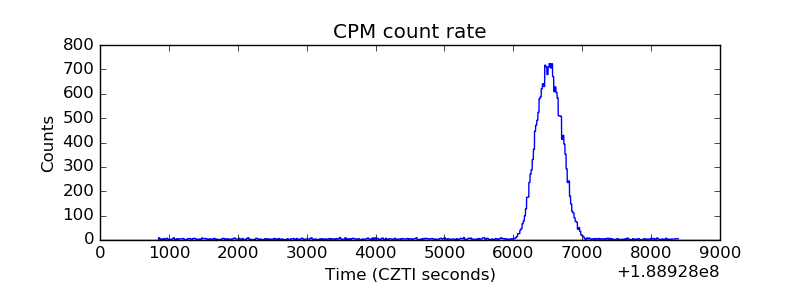 |
| CZT Counter | 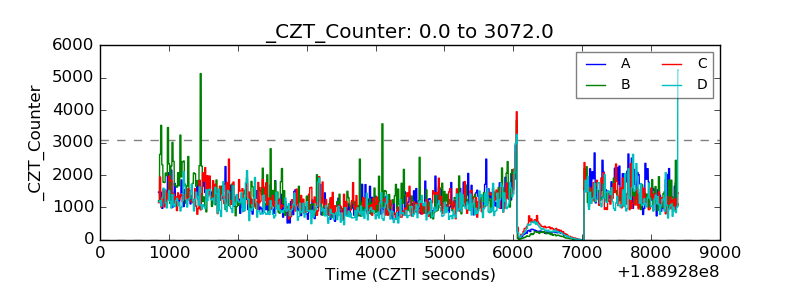 |
| +2.5 Volts monitor | 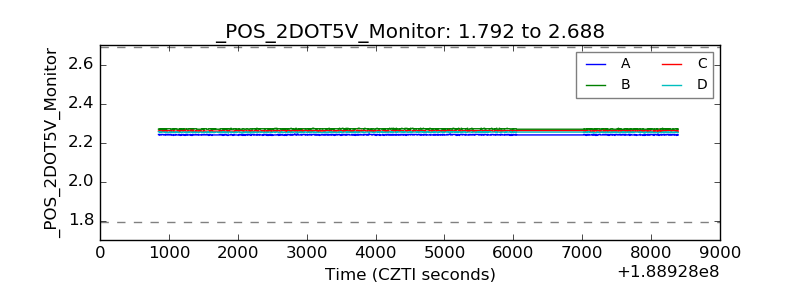 |
| +5 Volts monitor | 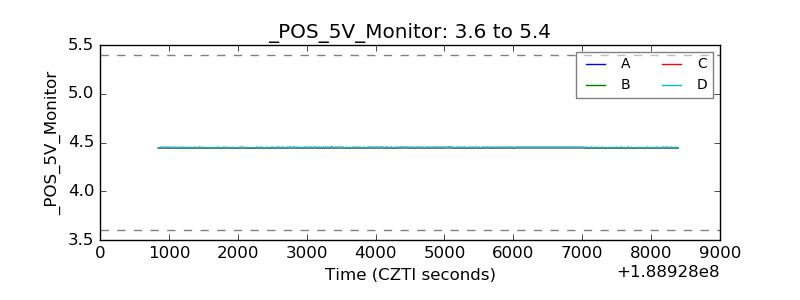 |
| _ROLL_ROT | 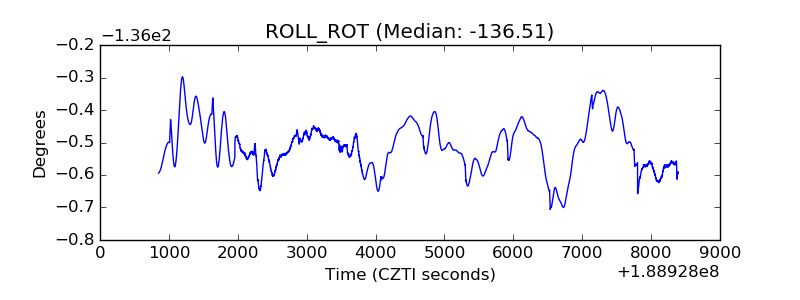 |
| _Roll_DEC | 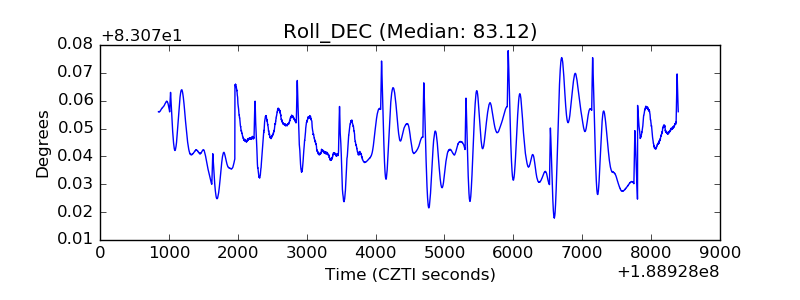 |
| _Roll_RA | 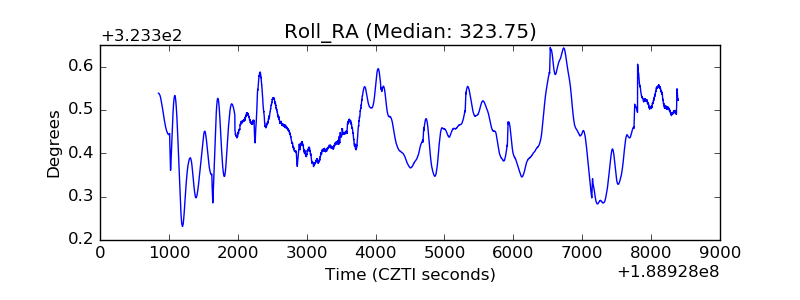 |
| Veto Counter | 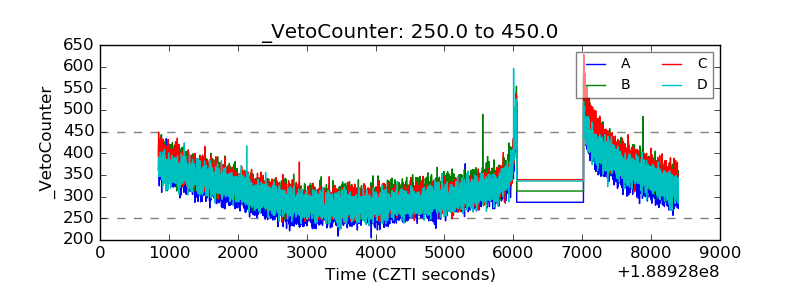 |