| Param | Original file | Final file |
|---|---|---|
| Filename | modeM0/AS1G04_002T02_9000000230_01344cztM0_level2.evt | modeM0/AS1G04_002T02_9000000230_01344cztM0_level2_quad_clean.evt |
| Size (bytes) | 1,034,971,200 | 98,130,240 |
| Size | 987.0 MB | 93.6 MB |
| Events in quadrant A | 7,789,957 | 632,847 |
| Events in quadrant B | 8,071,901 | 647,025 |
| Events in quadrant C | 7,456,306 | 640,734 |
| Events in quadrant D | 7,614,329 | 617,428 |
| Mode M9 | |||
|---|---|---|---|
| Quadrant | BADHDUFLAG | Total packets | Discarded packets |
| A | 0 | 16 | 0 |
| B | 0 | 16 | 0 |
| C | 0 | 16 | 0 |
| D | 0 | 17 | 0 |
| Mode M0 | |||
|---|---|---|---|
| Quadrant | BADHDUFLAG | Total packets | Discarded packets |
| A | 0 | 27551 | 3 |
| B | 0 | 28383 | 2 |
| C | 0 | 26553 | 2 |
| D | 0 | 27043 | 2 |
| Mode SS | |||
|---|---|---|---|
| Quadrant | BADHDUFLAG | Total packets | Discarded packets |
| A | 0 | 128 | 0 |
| B | 0 | 128 | 0 |
| C | 0 | 128 | 0 |
| D | 0 | 128 | 0 |
| Quadrant | Total seconds | Saturated seconds | Saturation percentage |
|---|---|---|---|
| A | 6210 | 86 | 1.384863% |
| B | 6210 | 40 | 0.644122% |
| C | 6210 | 12 | 0.193237% |
| D | 6210 | 37 | 0.595813% |
Noise dominated data is calculated using 1-second bins in cleaned event files. If a bin has >2000 counts, and if more than 50% of those come from <1% of pixels, then it is considered to be noise-dominated and hence unusable.
| Quadrant | # 1 sec bins | Bins with >0 counts | Bins with >2000 counts | High rate bins dominated by noise | Noise dominated (total time) | Noise dominated (detector-on time) | Marked lightcurve |
|---|---|---|---|---|---|---|---|
| A | 7445 | 6211 | 340 | 340 | 4.57% | 5.47% | 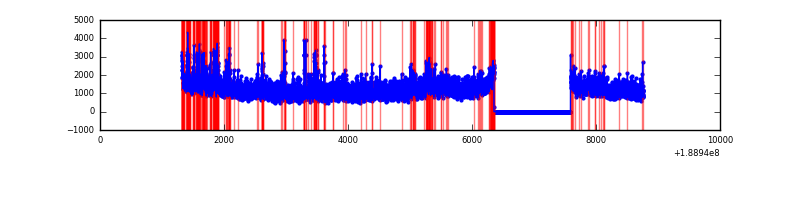 |
| B | 7445 | 6211 | 338 | 338 | 4.54% | 5.44% | 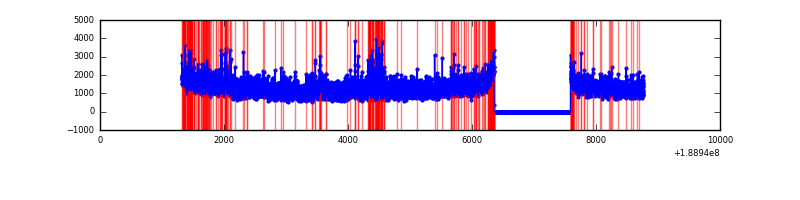 |
| C | 7445 | 6211 | 198 | 198 | 2.66% | 3.19% | 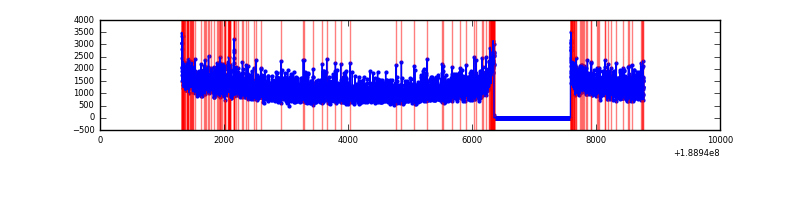 |
| D | 7445 | 6211 | 402 | 402 | 5.40% | 6.47% | 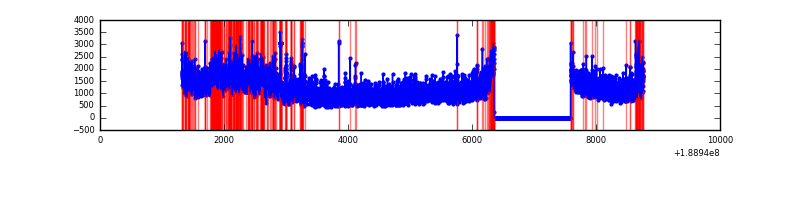 |
Top three noisy pixels from each quadrant. If the there are fewer than three noisy pixels in the level2.evt file, extra rows are filled as -1
| Pixel properties | Quadrant properties | ||||||
|---|---|---|---|---|---|---|---|
| Quadrant | DetID | PixID | Counts | Sigma | Mean | Median | Sigma |
| A | 4 | 32 | 518816 | 1184.95 | 1827 | 1843 | 436.3 |
| A | 15 | 127 | 235817 | 536.29 | 1827 | 1843 | 436.3 |
| A | 11 | 79 | 7901 | 13.89 | 1827 | 1843 | 436.3 |
| B | 8 | 4 | 246785 | 541.7 | 1946 | 1956 | 452.0 |
| B | 5 | 191 | 210852 | 462.19 | 1946 | 1956 | 452.0 |
| B | 12 | 52 | 80289 | 173.32 | 1946 | 1956 | 452.0 |
| C | 15 | 241 | 259662 | 518.48 | 1798 | 1861 | 497.2 |
| C | 3 | 9 | 86958 | 171.14 | 1798 | 1861 | 497.2 |
| C | 9 | 52 | 34141 | 64.92 | 1798 | 1861 | 497.2 |
| D | 12 | 22 | 797012 | 1502.07 | 1715 | 1778 | 529.4 |
| D | 1 | 83 | 126648 | 235.86 | 1715 | 1778 | 529.4 |
| D | 2 | 88 | 90925 | 168.38 | 1715 | 1778 | 529.4 |
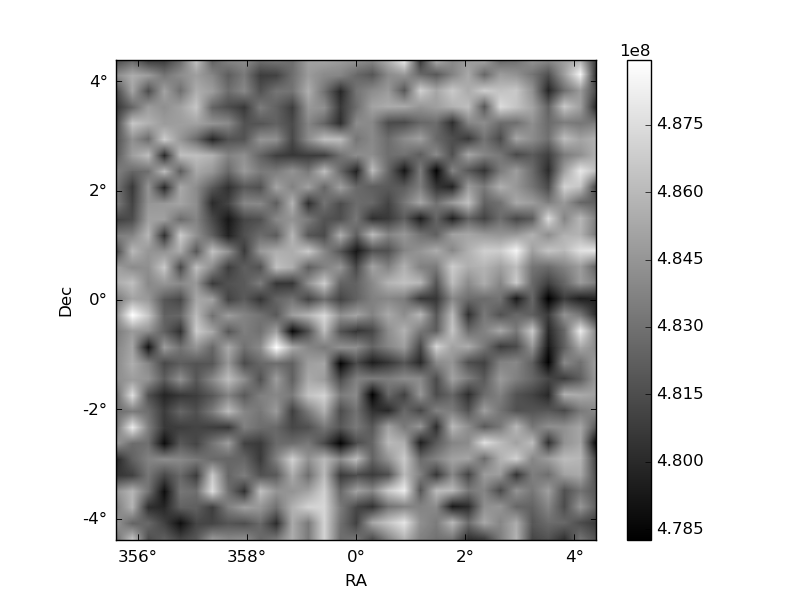
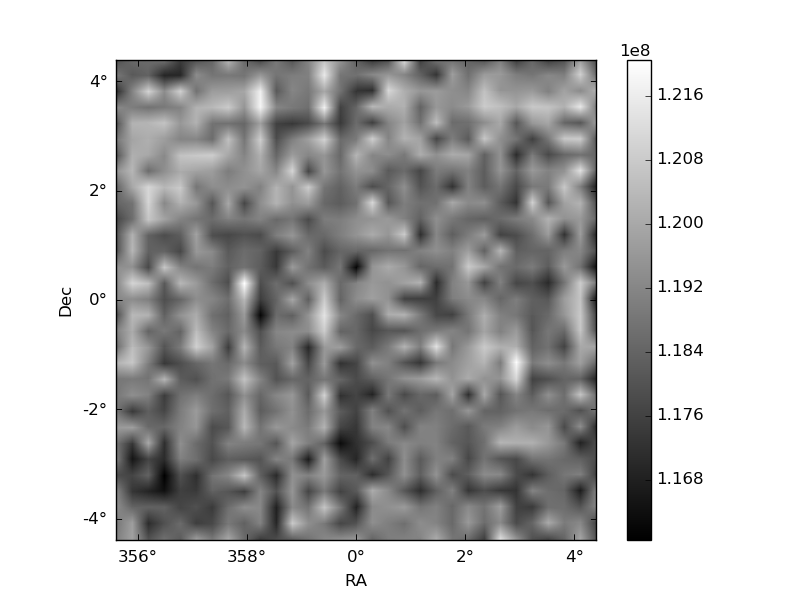
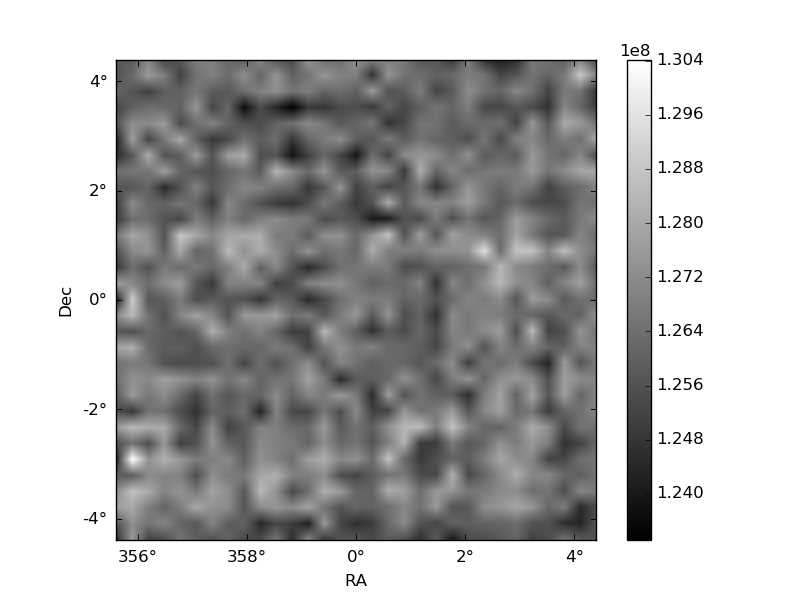
Histogram calculated using DETX and DETY for each event in the final _common_clean file
| Quadrant A | 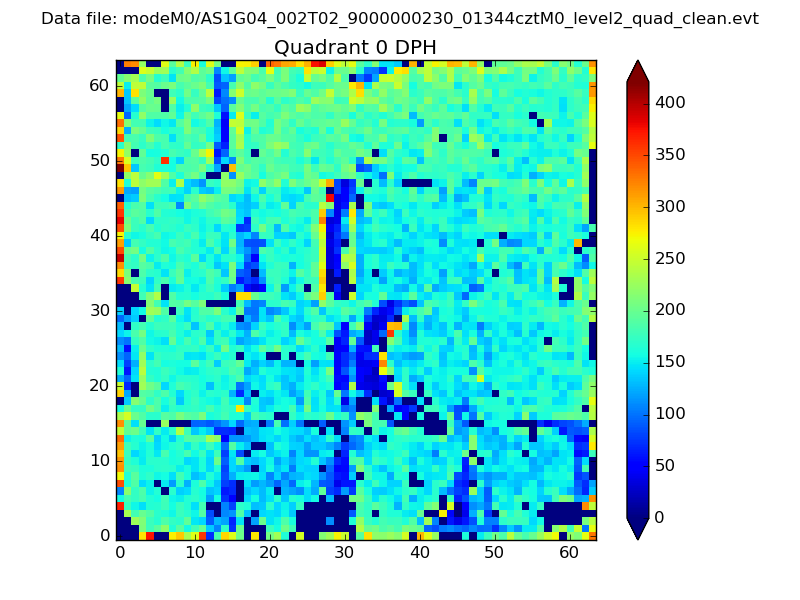 |
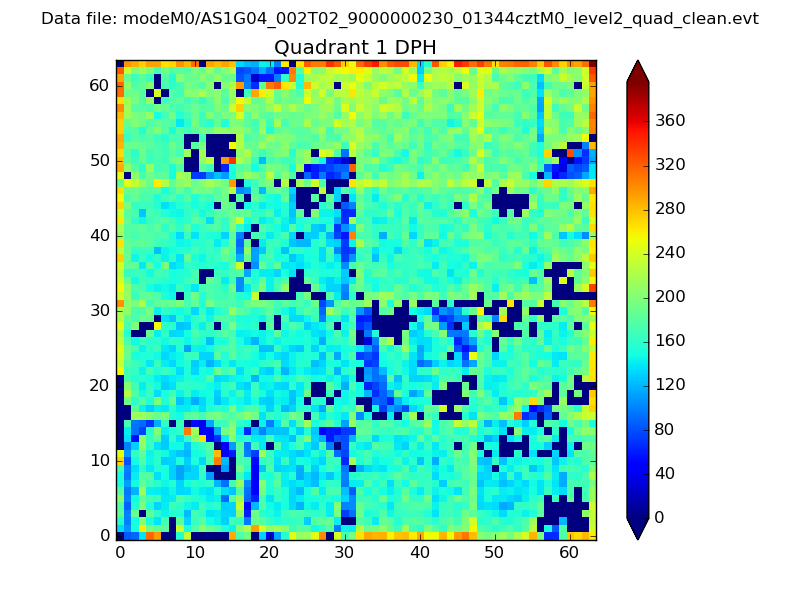 |
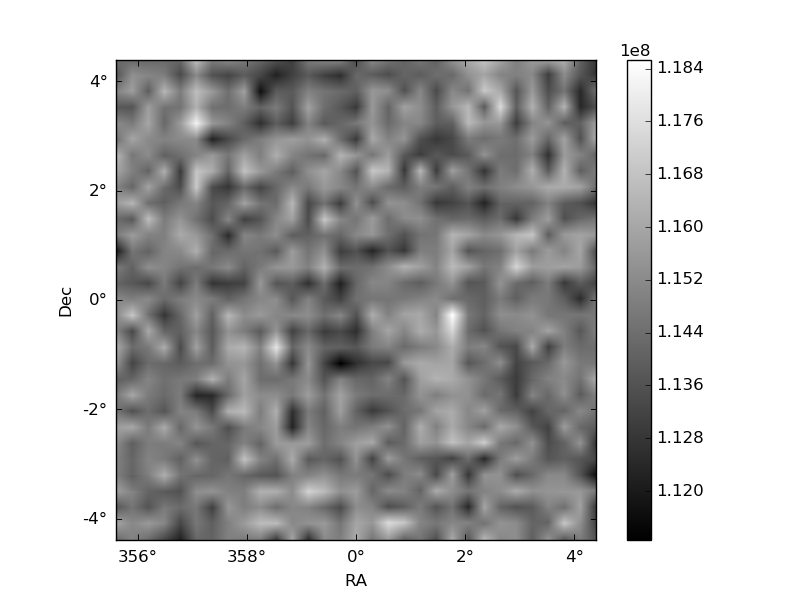
Quadrant B |
|---|---|---|---|
| Quadrant D | 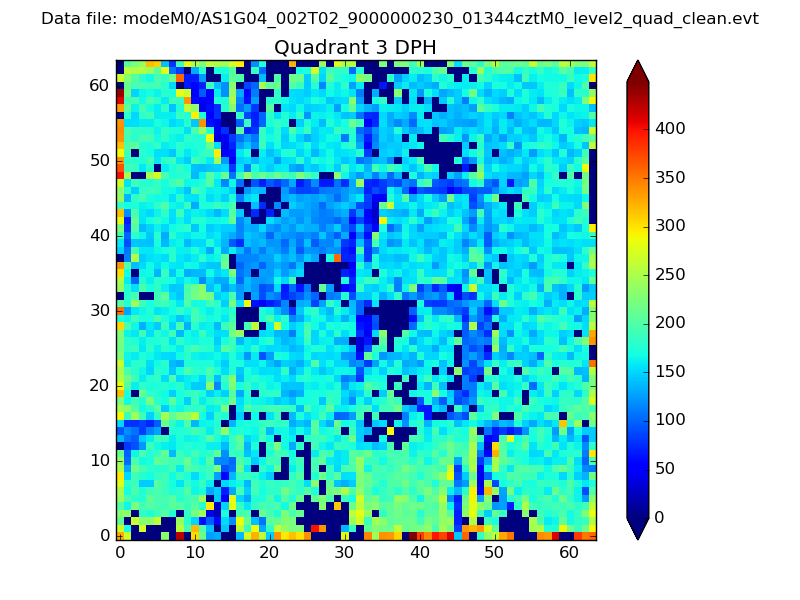 |
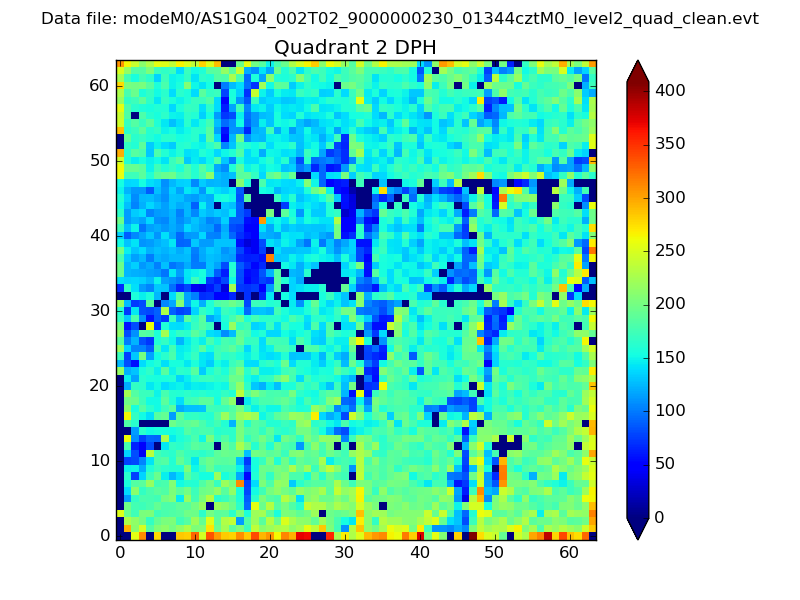 |
Quadrant C |
| Plot type | Count rate plots | Images |
|---|---|---|
| Comparison with Poisson distribution Blue bars denote a histogram of data divided into 1 sec bins. Red curve is a Poisson curve with rate = median count rate of data. |
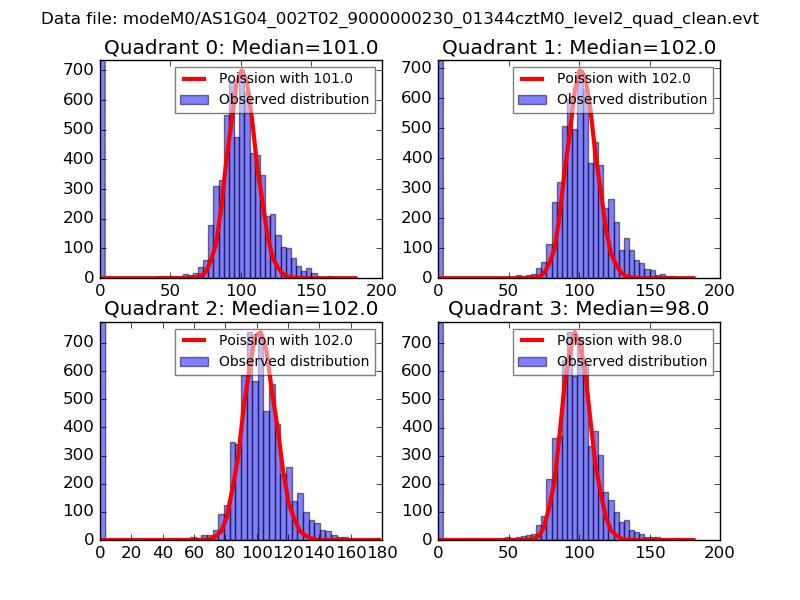 |
 |
| Quadrant-wise count rates Data is divided into 100 sec bins |
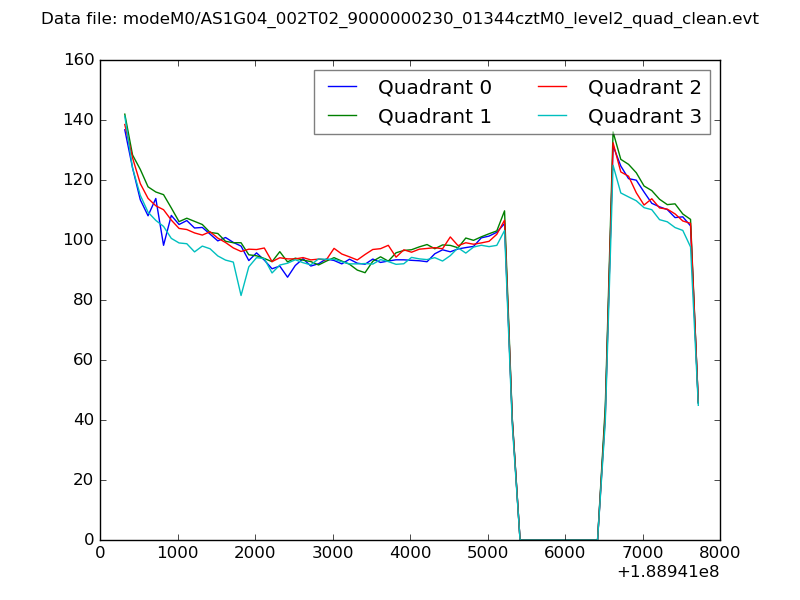 |
|
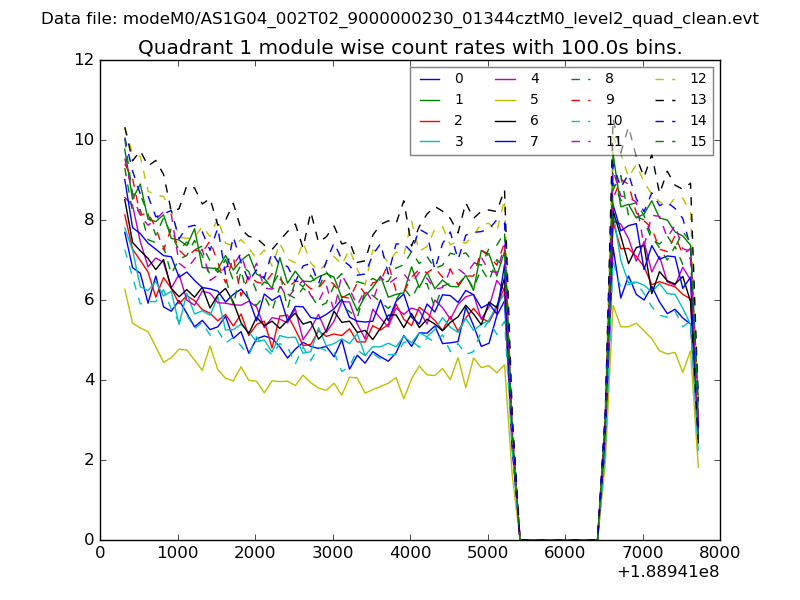
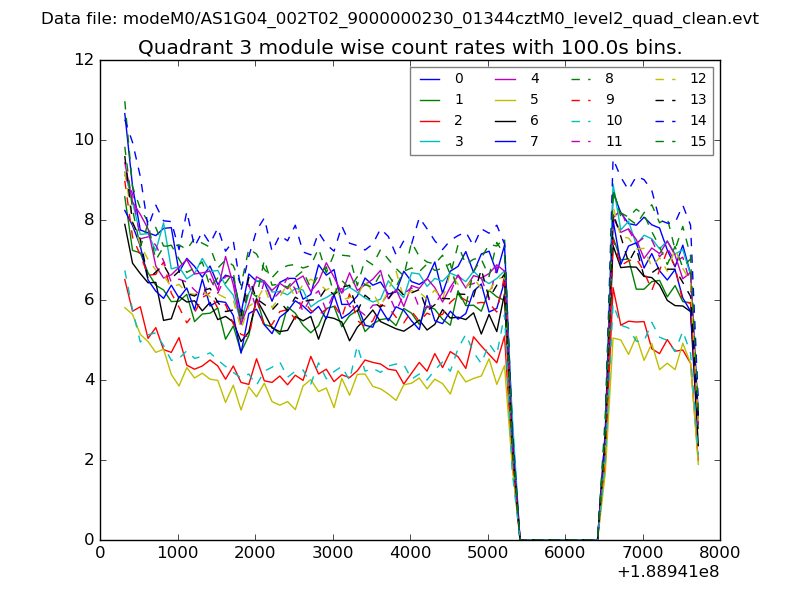
| Module-wise count rates for Quadrant A Data is divided into 100 sec bins |
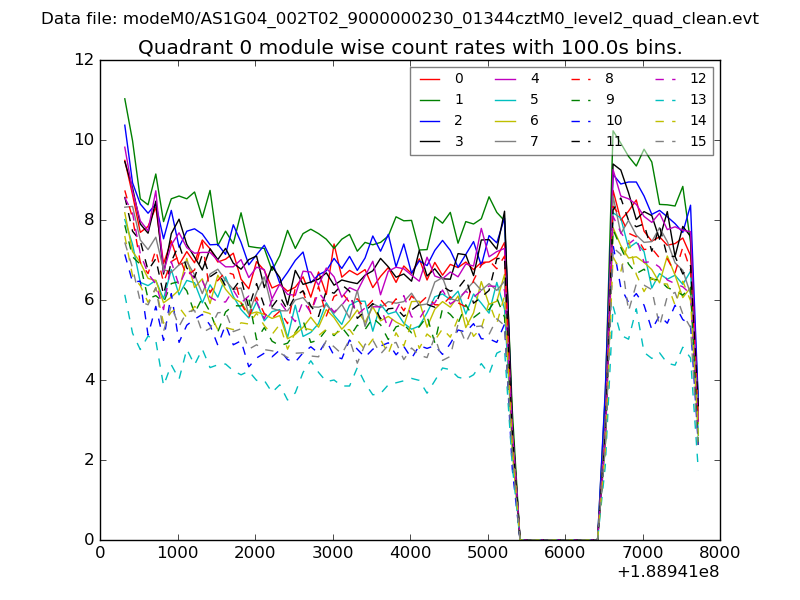 |
 |
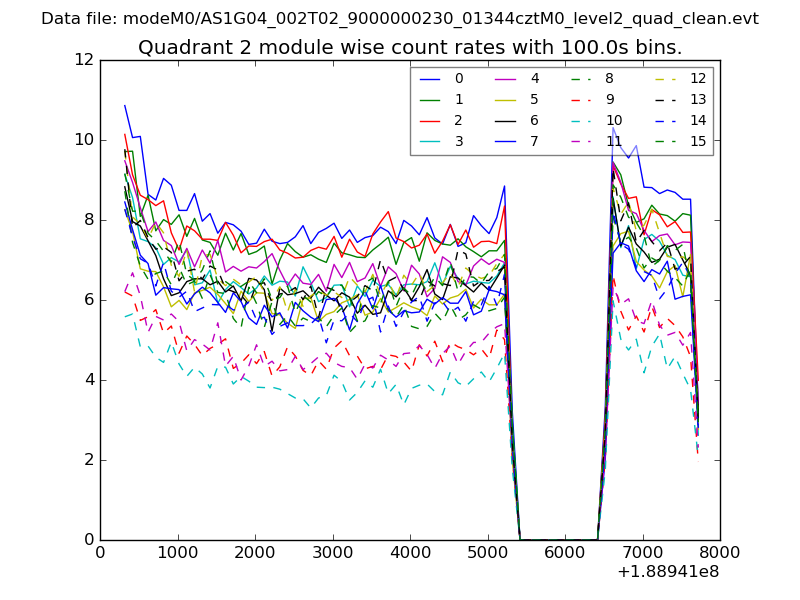
| Module-wise count rates for Quadrant B Data is divided into 100 sec bins |
 |
 |
| Module-wise count rates for Quadrant C Data is divided into 100 sec bins |
 |
 |
| Module-wise count rates for Quadrant D Data is divided into 100 sec bins |
 |
 |
| Parameter | Plot |
|---|---|
| CZT HV Monitor | 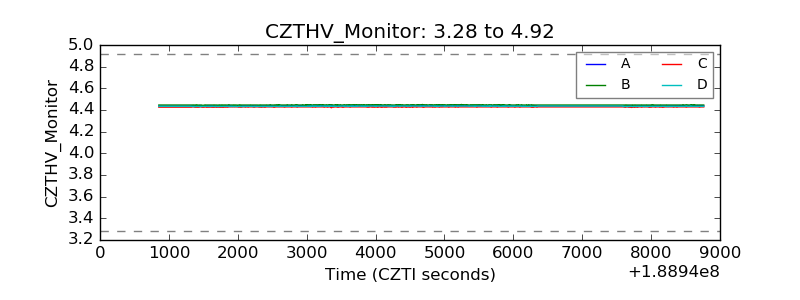 |
| D_VDD | 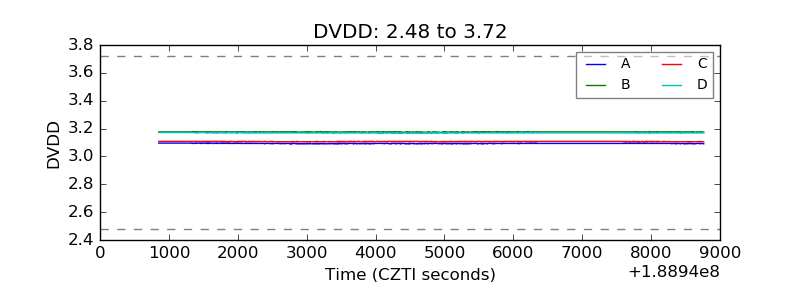 |
| Temperature 1 | 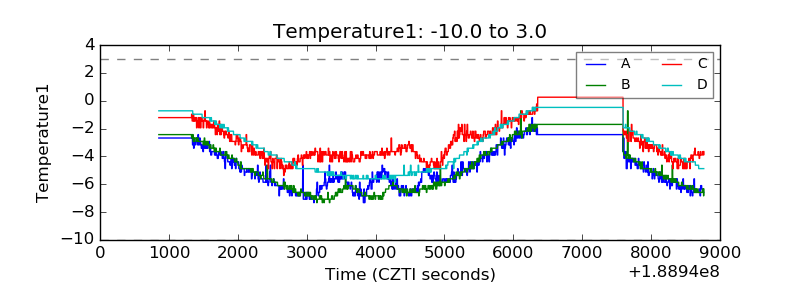 |
| Veto HV Monitor | 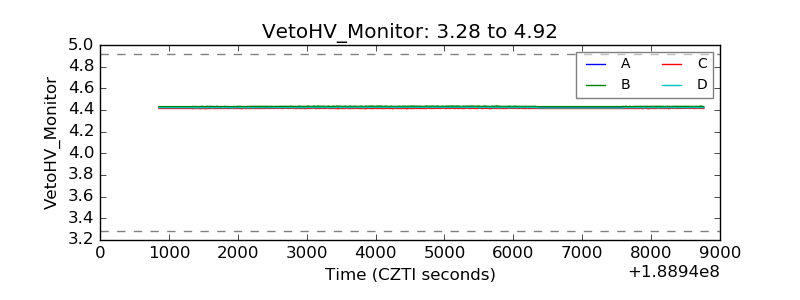 |
| Veto LLD | 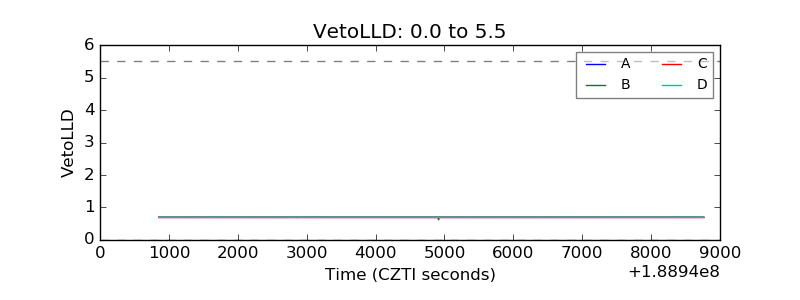 |
| Alpha Counter | 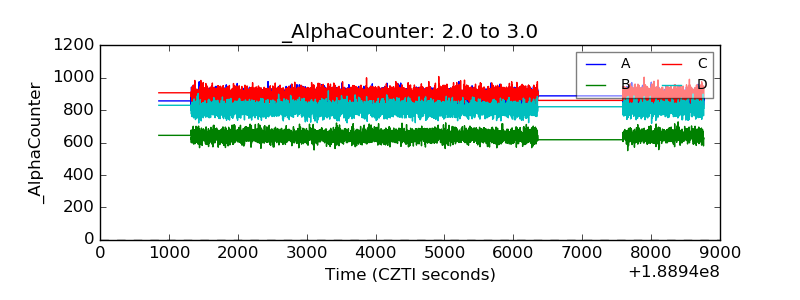 |
| _CPM_Rate | 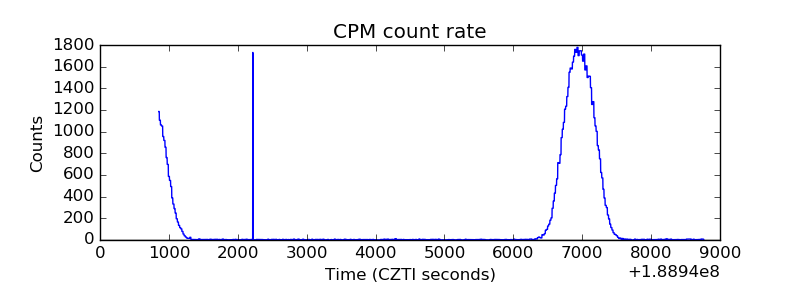 |
| CZT Counter | 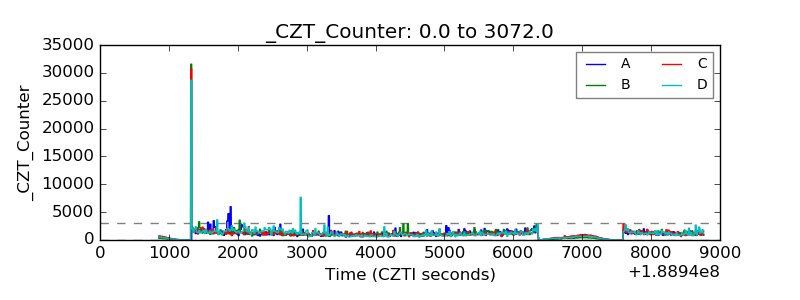 |
| +2.5 Volts monitor |  |
| +5 Volts monitor |  |
| _ROLL_ROT | 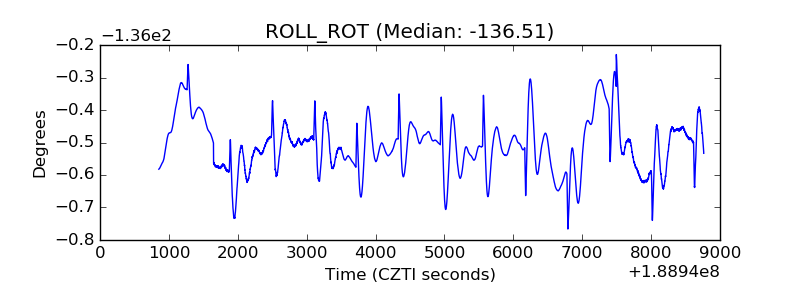 |
| _Roll_DEC | 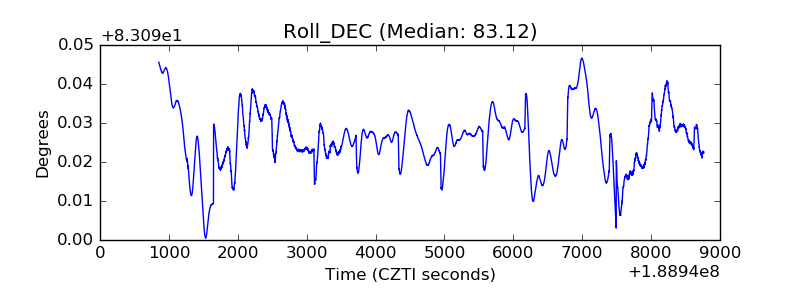 |
| _Roll_RA | 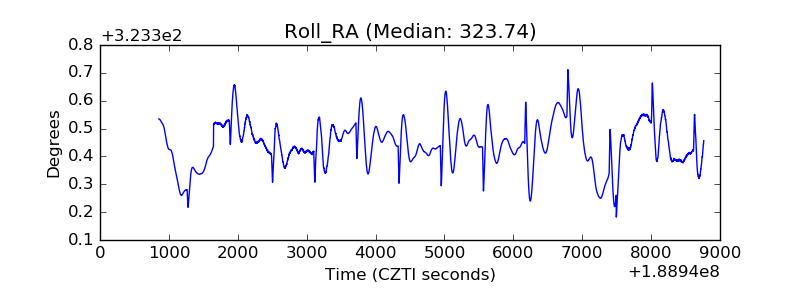 |
| Veto Counter | 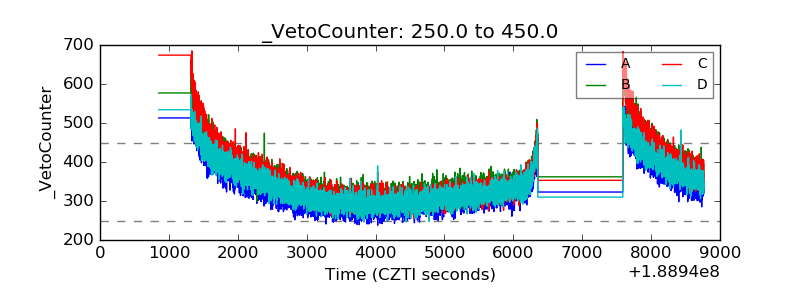 |