| Param | Original file | Final file |
|---|---|---|
| Filename | modeM0/AS1G04_002T02_9000000230_01345cztM0_level2.evt | modeM0/AS1G04_002T02_9000000230_01345cztM0_level2_quad_clean.evt |
| Size (bytes) | 991,316,160 | 98,804,160 |
| Size | 945.4 MB | 94.2 MB |
| Events in quadrant A | 7,205,313 | 643,397 |
| Events in quadrant B | 7,598,531 | 656,151 |
| Events in quadrant C | 7,238,546 | 646,413 |
| Events in quadrant D | 7,571,647 | 616,781 |
| Mode M9 | |||
|---|---|---|---|
| Quadrant | BADHDUFLAG | Total packets | Discarded packets |
| A | 0 | 20 | 0 |
| B | 0 | 20 | 0 |
| C | 0 | 20 | 0 |
| D | 0 | 21 | 0 |
| Mode M0 | |||
|---|---|---|---|
| Quadrant | BADHDUFLAG | Total packets | Discarded packets |
| A | 0 | 25757 | 3 |
| B | 0 | 26985 | 2 |
| C | 0 | 25908 | 2 |
| D | 0 | 26871 | 2 |
| Mode SS | |||
|---|---|---|---|
| Quadrant | BADHDUFLAG | Total packets | Discarded packets |
| A | 0 | 124 | 0 |
| B | 0 | 124 | 0 |
| C | 0 | 124 | 0 |
| D | 0 | 124 | 0 |
| Quadrant | Total seconds | Saturated seconds | Saturation percentage |
|---|---|---|---|
| A | 6157 | 6 | 0.097450% |
| B | 6157 | 15 | 0.243625% |
| C | 6157 | 6 | 0.097450% |
| D | 6157 | 47 | 0.763359% |
Noise dominated data is calculated using 1-second bins in cleaned event files. If a bin has >2000 counts, and if more than 50% of those come from <1% of pixels, then it is considered to be noise-dominated and hence unusable.
| Quadrant | # 1 sec bins | Bins with >0 counts | Bins with >2000 counts | High rate bins dominated by noise | Noise dominated (total time) | Noise dominated (detector-on time) | Marked lightcurve |
|---|---|---|---|---|---|---|---|
| A | 7437 | 6158 | 140 | 140 | 1.88% | 2.27% | 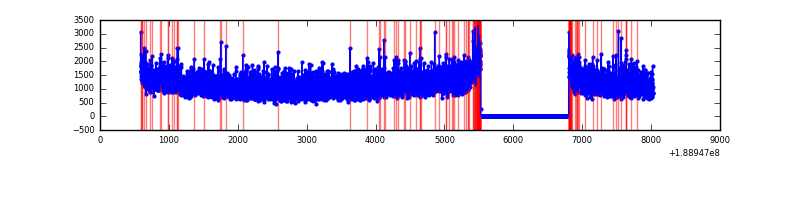 |
| B | 7437 | 6158 | 233 | 233 | 3.13% | 3.78% | 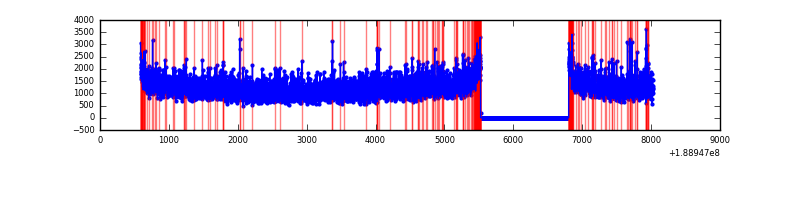 |
| C | 7437 | 6158 | 142 | 142 | 1.91% | 2.31% |  |
| D | 7437 | 6158 | 440 | 440 | 5.92% | 7.15% | 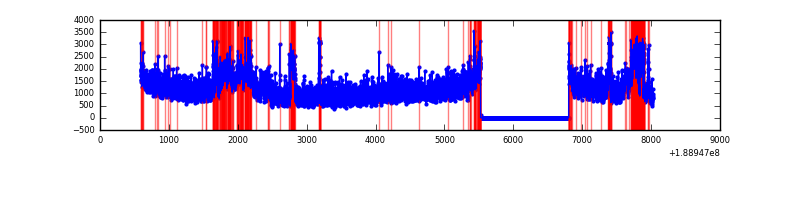 |
Top three noisy pixels from each quadrant. If the there are fewer than three noisy pixels in the level2.evt file, extra rows are filled as -1
| Pixel properties | Quadrant properties | ||||||
|---|---|---|---|---|---|---|---|
| Quadrant | DetID | PixID | Counts | Sigma | Mean | Median | Sigma |
| A | 15 | 127 | 142560 | 319.53 | 1828 | 1842 | 440.4 |
| A | 4 | 32 | 19956 | 41.13 | 1828 | 1842 | 440.4 |
| A | 14 | 5 | 10496 | 19.65 | 1828 | 1842 | 440.4 |
| B | 15 | 22 | 59665 | 128.48 | 1936 | 1942 | 449.3 |
| B | 6 | 53 | 54978 | 118.05 | 1936 | 1942 | 449.3 |
| B | 12 | 52 | 44213 | 94.09 | 1936 | 1942 | 449.3 |
| C | 15 | 241 | 285484 | 580.89 | 1768 | 1830 | 488.3 |
| C | 3 | 111 | 19987 | 37.18 | 1768 | 1830 | 488.3 |
| C | 3 | 79 | 15535 | 28.07 | 1768 | 1830 | 488.3 |
| D | 12 | 22 | 668719 | 1291.28 | 1675 | 1733 | 516.5 |
| D | 10 | 84 | 343267 | 661.21 | 1675 | 1733 | 516.5 |
| D | 1 | 83 | 159894 | 306.2 | 1675 | 1733 | 516.5 |
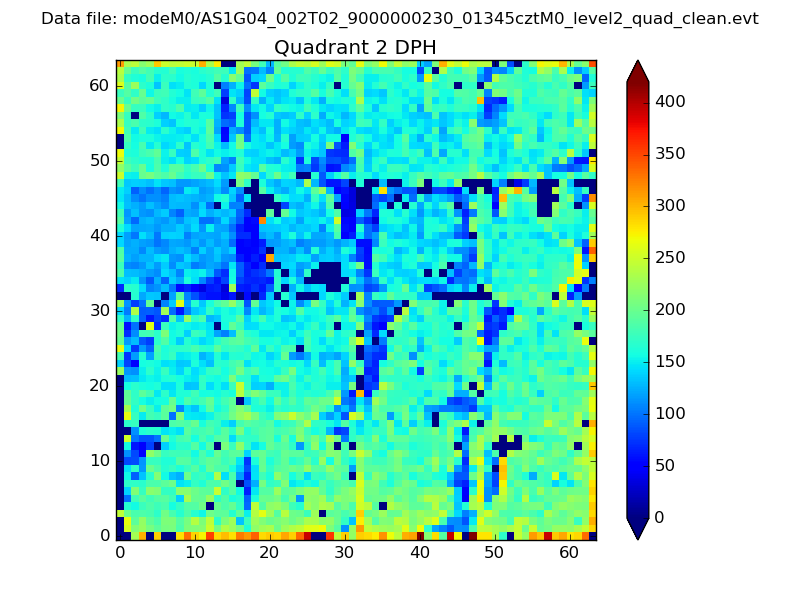
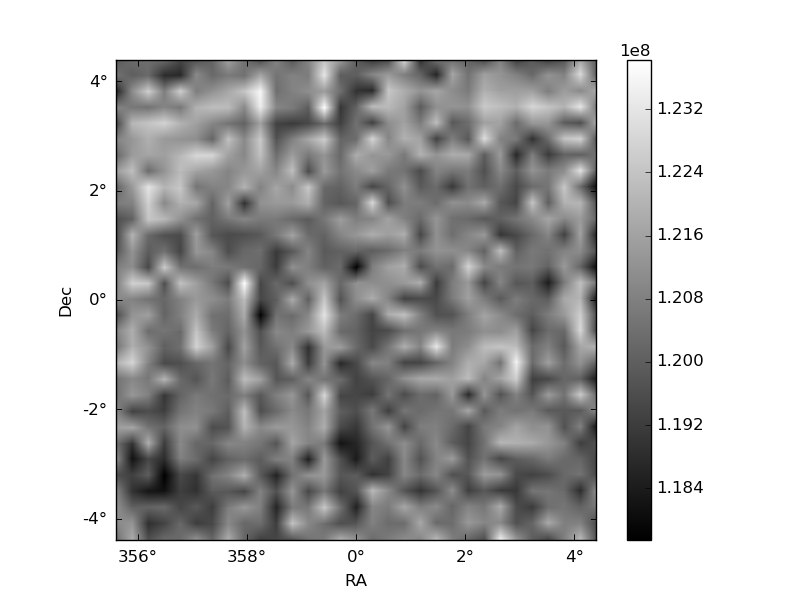
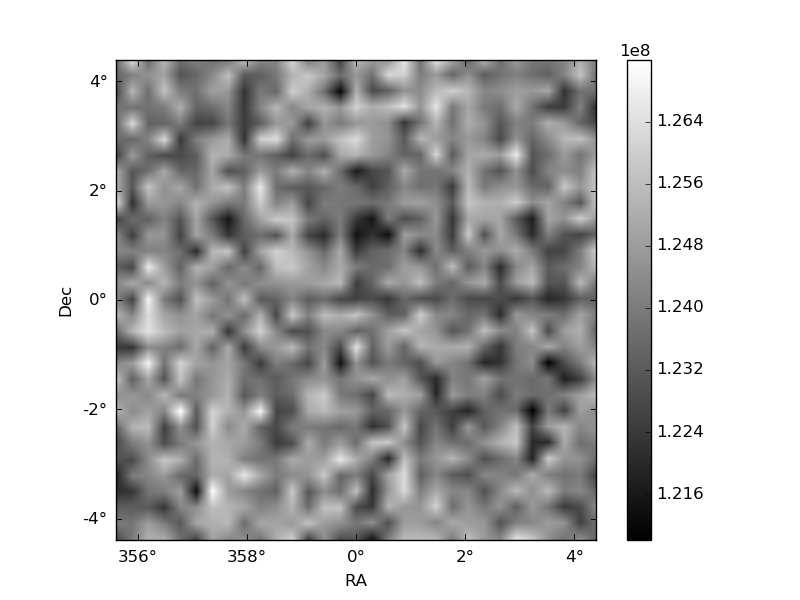
Histogram calculated using DETX and DETY for each event in the final _common_clean file
| Quadrant A | 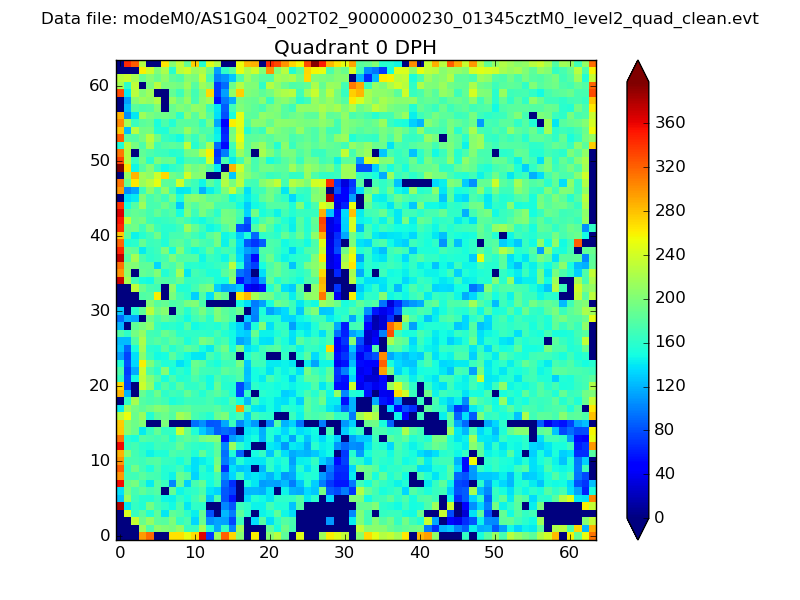 |
 |
Quadrant B |
|---|---|---|---|
| Quadrant D | 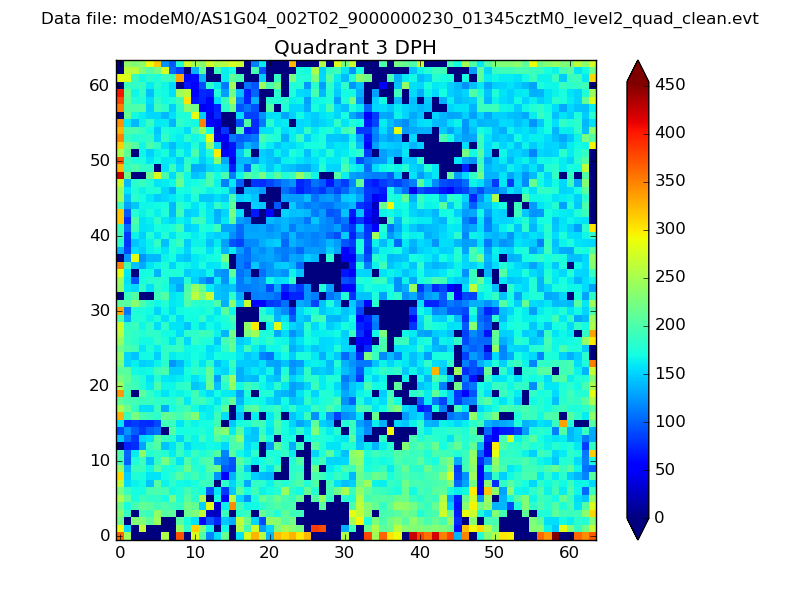 |
 |
Quadrant C |
| Plot type | Count rate plots | Images |
|---|---|---|
| Comparison with Poisson distribution Blue bars denote a histogram of data divided into 1 sec bins. Red curve is a Poisson curve with rate = median count rate of data. |
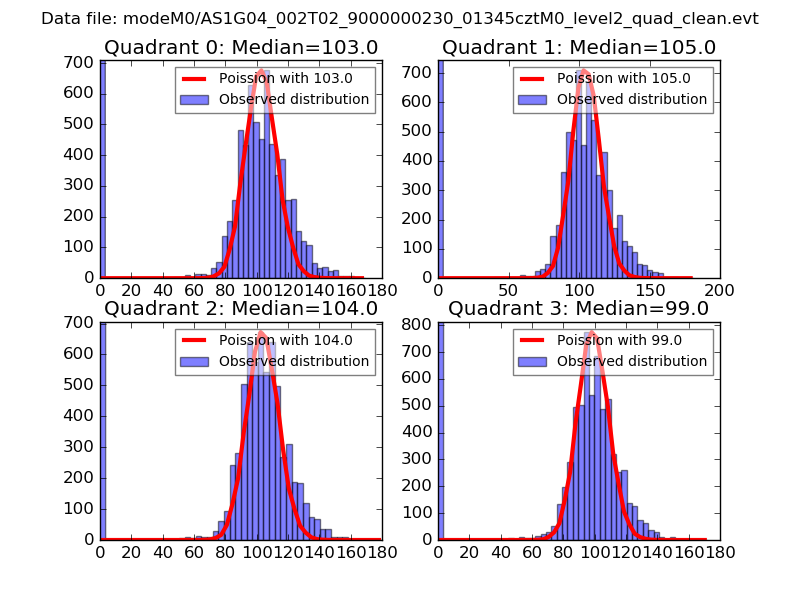 |
 |
| Quadrant-wise count rates Data is divided into 100 sec bins |
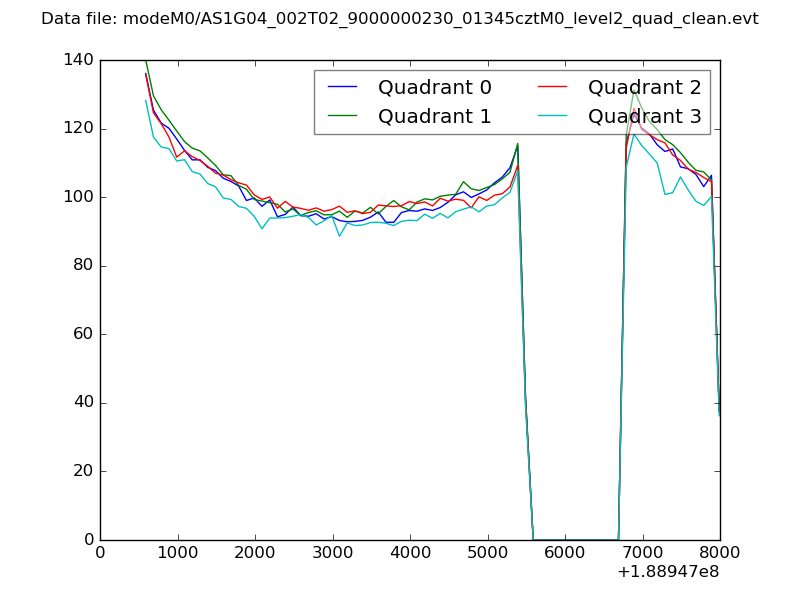 |
|
| Module-wise count rates for Quadrant A Data is divided into 100 sec bins |
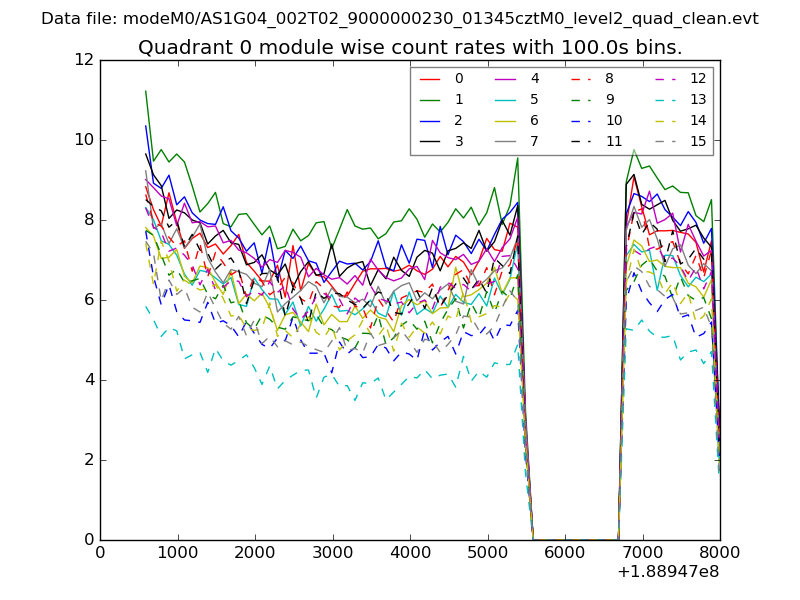 |
 |
| Module-wise count rates for Quadrant B Data is divided into 100 sec bins |
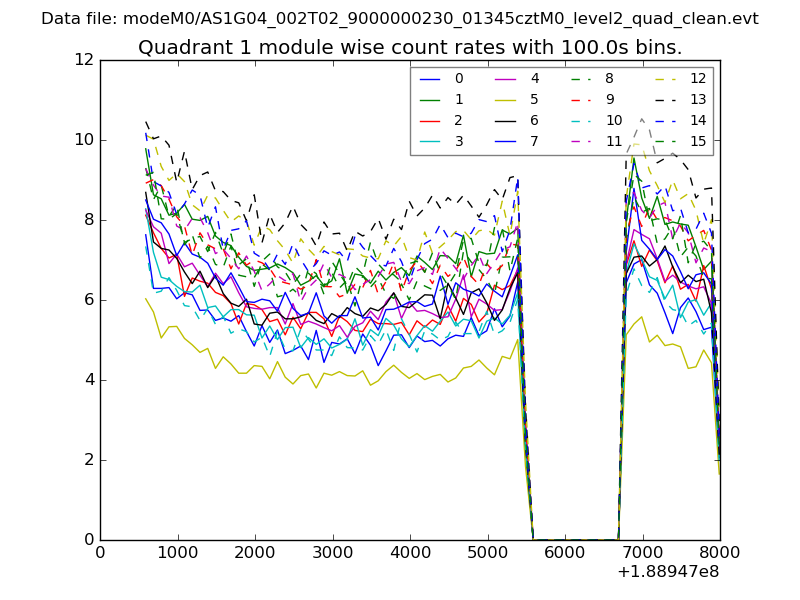 |
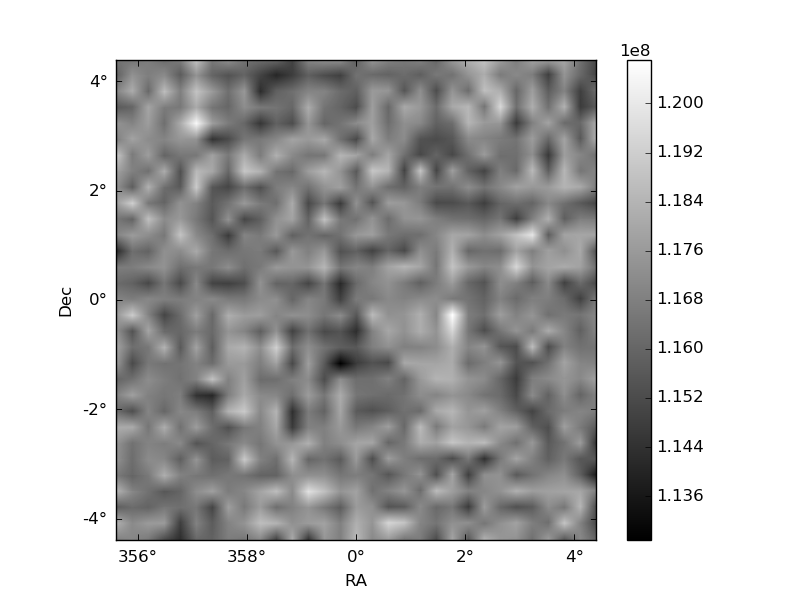 |
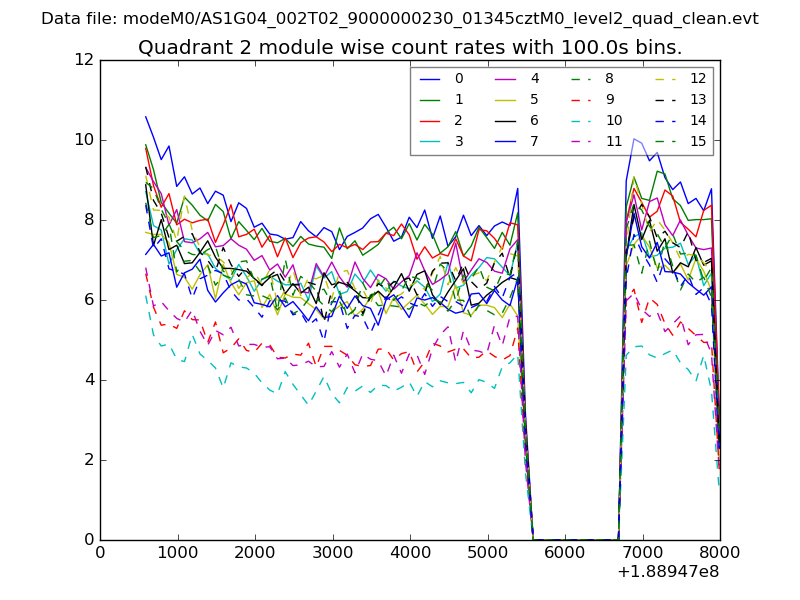
| Module-wise count rates for Quadrant C Data is divided into 100 sec bins |
 |
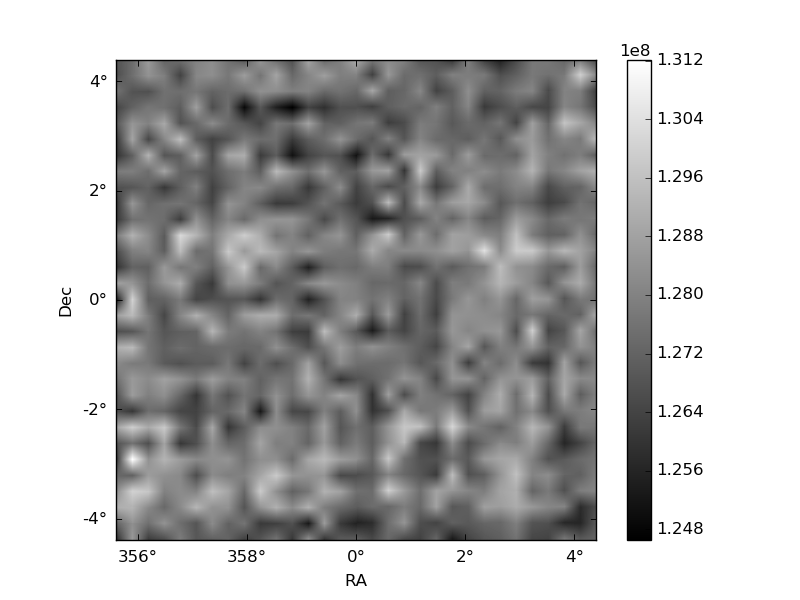 |
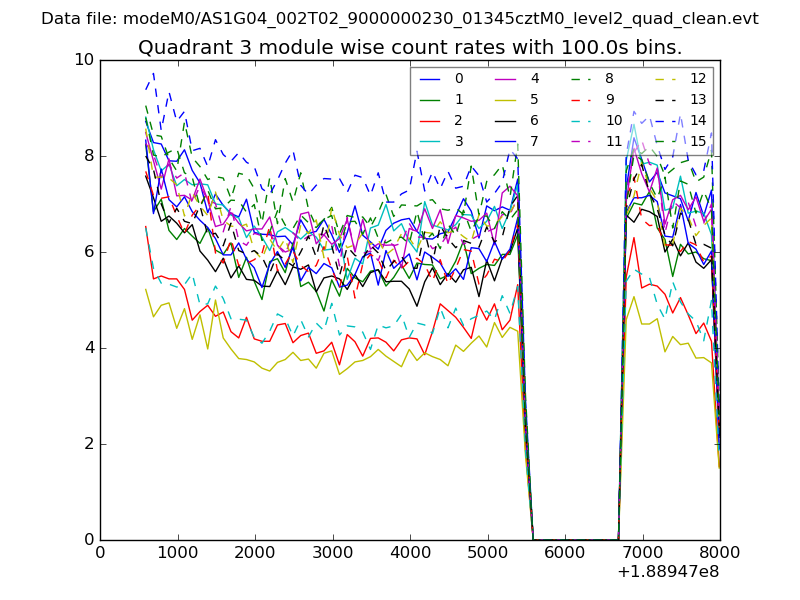
| Module-wise count rates for Quadrant D Data is divided into 100 sec bins |
 |
 |
| Parameter | Plot |
|---|---|
| CZT HV Monitor | 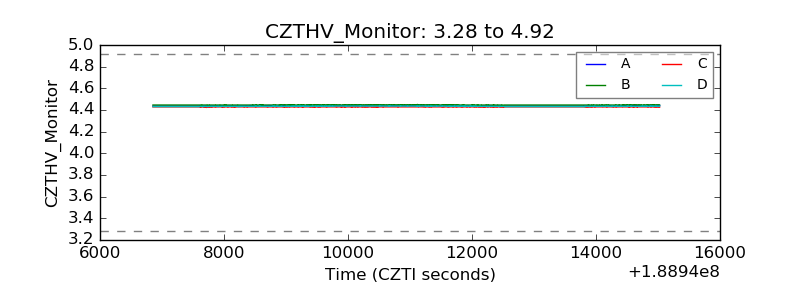 |
| D_VDD | 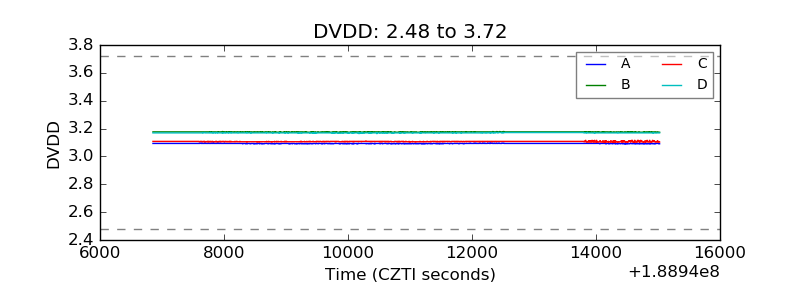 |
| Temperature 1 | 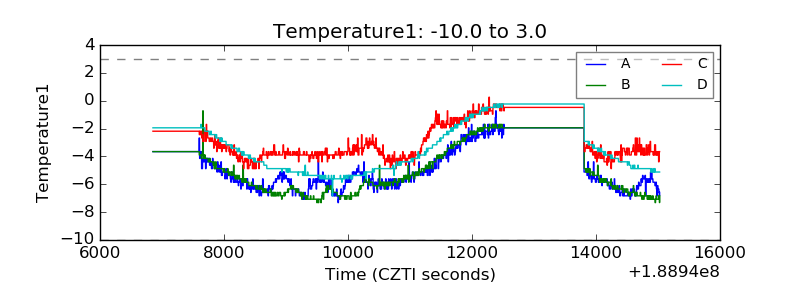 |
| Veto HV Monitor | 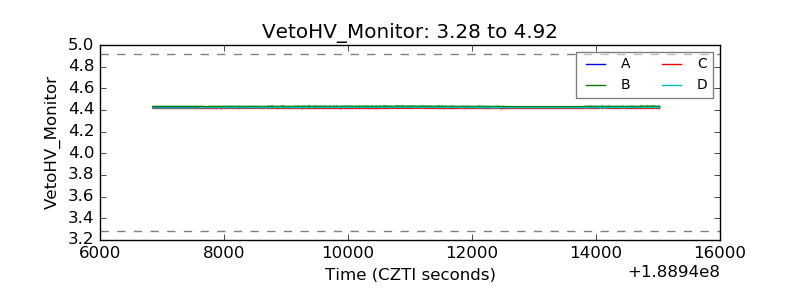 |
| Veto LLD | 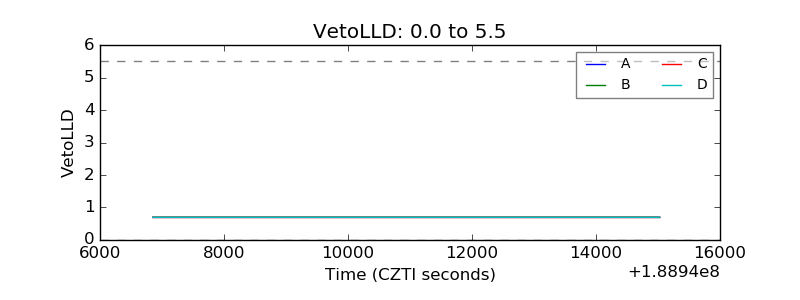 |
| Alpha Counter | 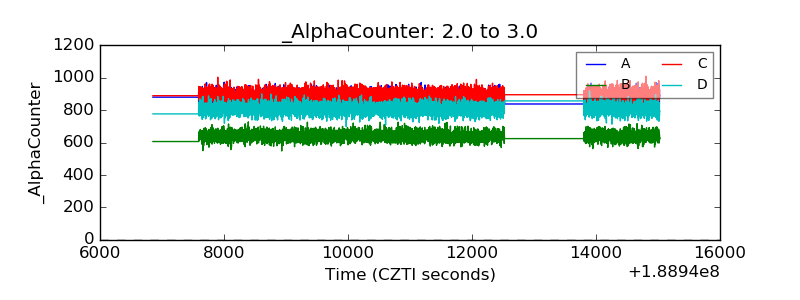 |
| _CPM_Rate | 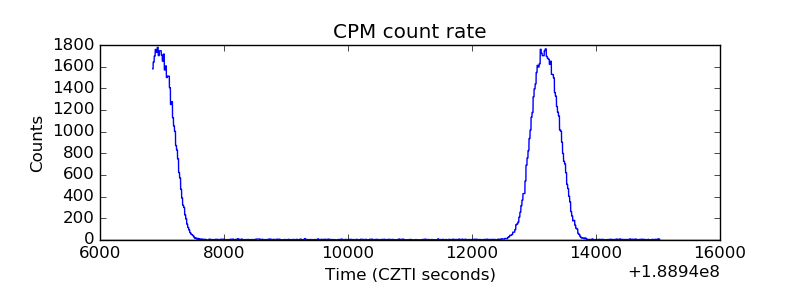 |
| CZT Counter | 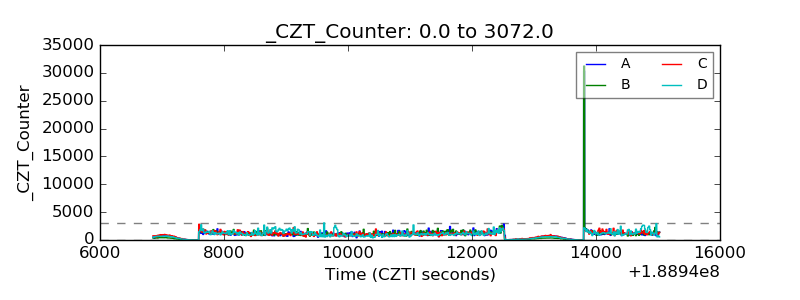 |
| +2.5 Volts monitor |  |
| +5 Volts monitor |  |
| _ROLL_ROT | 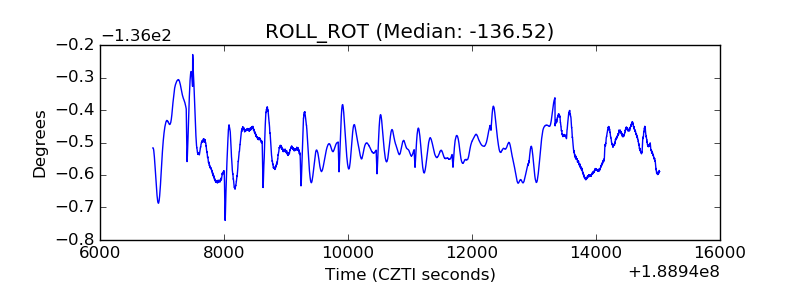 |
| _Roll_DEC | 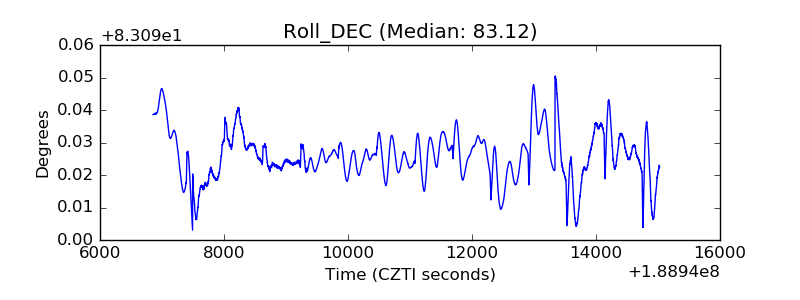 |
| _Roll_RA | 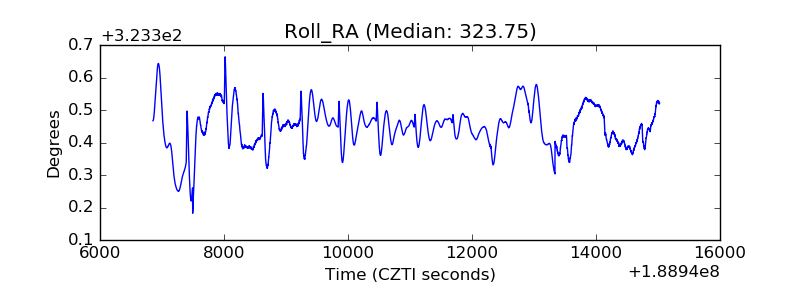 |
| Veto Counter | 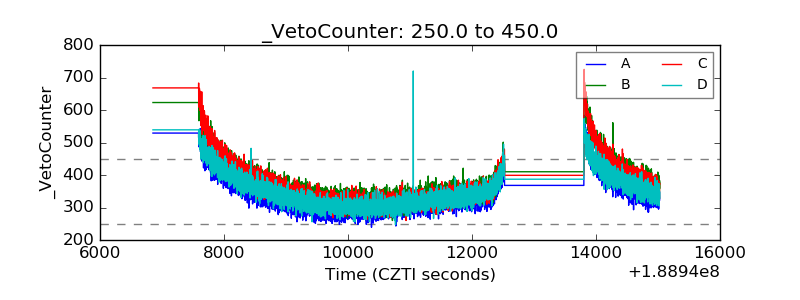 |